
![]()

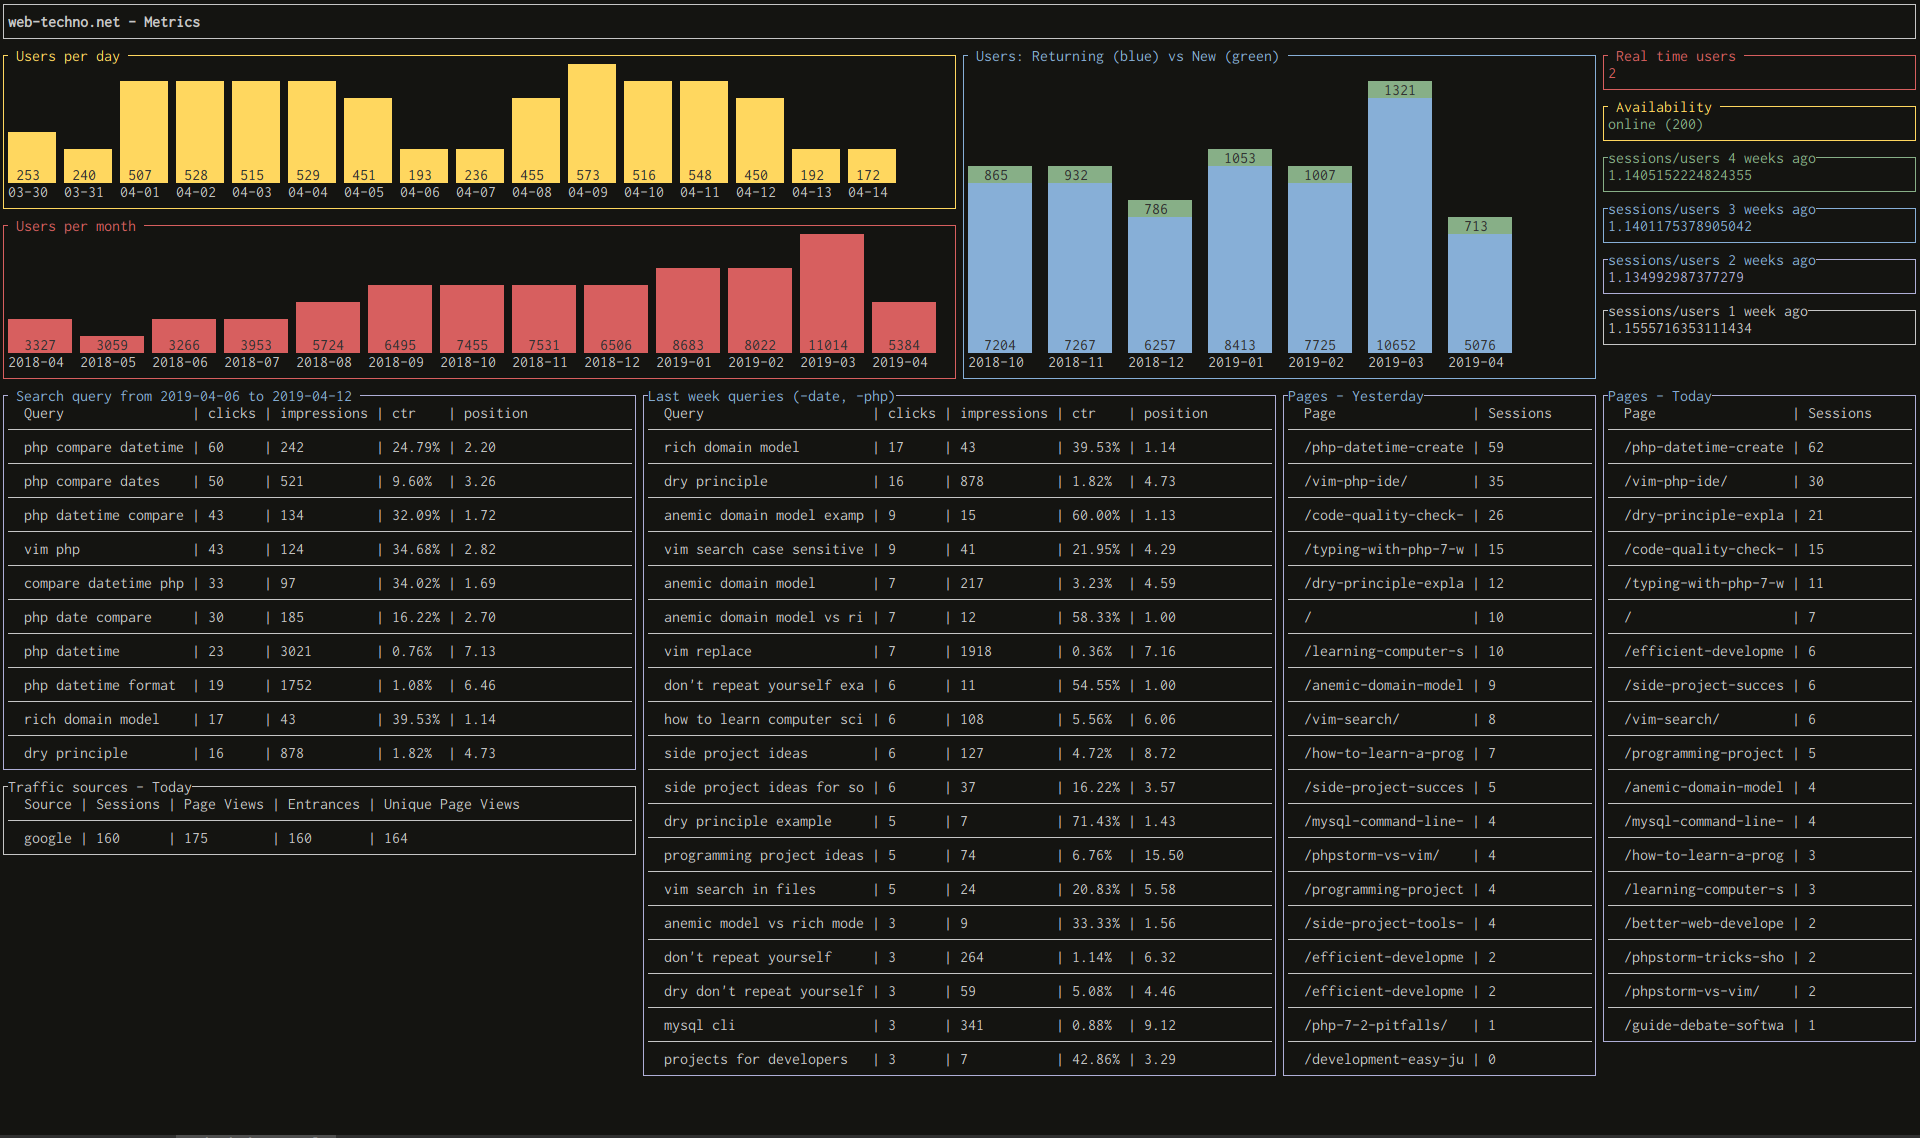
DevDash is a highly configurable terminal dashboard for developers, who want to choose and display the most up-to-date metrics they need, at one place.
Why using DevDash?
- Pull the data and display it in cool diagrams (or widgets) using YAML / JSON config, from:
- Your own computer. From your own scripts / command lines too!
- A remote computer via SSH
- Github
- Travis
- Google Analytics
- Google Search Console
- Feedly
- A huge amount of flexibility compared to other terminal dashboards:
- Choose the widgets you want.
- Place your widgets where you want.
- Choose the data you want to display, the colors you want to use, and a lot of other things for each widget.
- Don't want to personalize everything? Don't overwrite the defaults, then.
- Unlimited amount of different dashboards with different configurations.
- Data refreshed automatically via time ticks, or via a keyboard shortcut (Ctrl + r by default).
Menu
Installation
You can simply grab the latest released binary file and download the version you need, depending on your OS.
Linux script
Here's a simple way to download DevDash and move it in /usr/local/bin, in order to be able to use DevDash everywhere easily.
curl -LO https://raw.githubusercontent.com/Phantas0s/devdash/master/install/linux.sh && \
sh ./linux.sh && \
rm linux.sh
Manual installation
You need to clone this repository and build the binary: go build devdash.go.
How Does It Work?
In a nutshell:
- If you run DevDash without giving a dashboard configuration, it will create and display a default dashboard (
default.yml) located in$XDG_CONFIG_HOME/devdashor$HOME/.config/devdash. - To get used to dashboard' configurations, there are many examples here. They can help you getting started.
- To run a dashboard created in the two filepaths mentioned above, you just need to execute
dashboard -c my-super-dashboard, if your configuration file is calledmy-super-dashboard.yml. You can use JSON as well! - You can as well run any dashboard from anywhere if you give an absolute or relative path.
- I'm thriving to make DevDash easier to configure, yet very flexible and customizable. The next updates will go in that direction.
Documentation
The complete DevDash documentation is here..
You'll find:
- Installation / getting started
- Simple examples and real use cases
- Complete reference for configuring whatever you want.
Acknowledgement
Thanks to MariaLetta for the awesome and beautiful Gopher pack she made! I used it for my logo on top.
DevDash was inspired from other open source projects:
Bugs and Ideas
I would be happy to read about new ideas and to fix bugs. Opening an issue is the way to go.
Contribute
First of all, thanks a lot if you want to contribute to DevDash!
If you want to implement a new feature, let's speak about it first and decide if it fits DevDash scope.
Making Of
For anybody interested how I managed to develop DevDash on side of a full time job, and how I organized my time and kept my motivation, I wrote an article about that on my blog.
Licence
Showcase


