#--user --upgrade git+https://github.com/twintproject/twint.git@origin/master#egg=twint
The Blockchain Risk Scoring project taps into open-source information to monitor the risk level of cryptocurrency entities on a daily basis. Open-source information utilised includes news articles from both conventional and crypto-specific sites, as well as social media posts from Reddit and Twitter. While four different models were attempted, the final model used by the project is RoBERTa (Robustly Optimized BERT Pretraining Approach). We also built an additional layer upon the original neural network to cater to the context of risk scoring. Scored risks, both on a post and entity level, are eventually stored in a centralised database. In the future, APIs will be created to query into the database for visualization purposes.
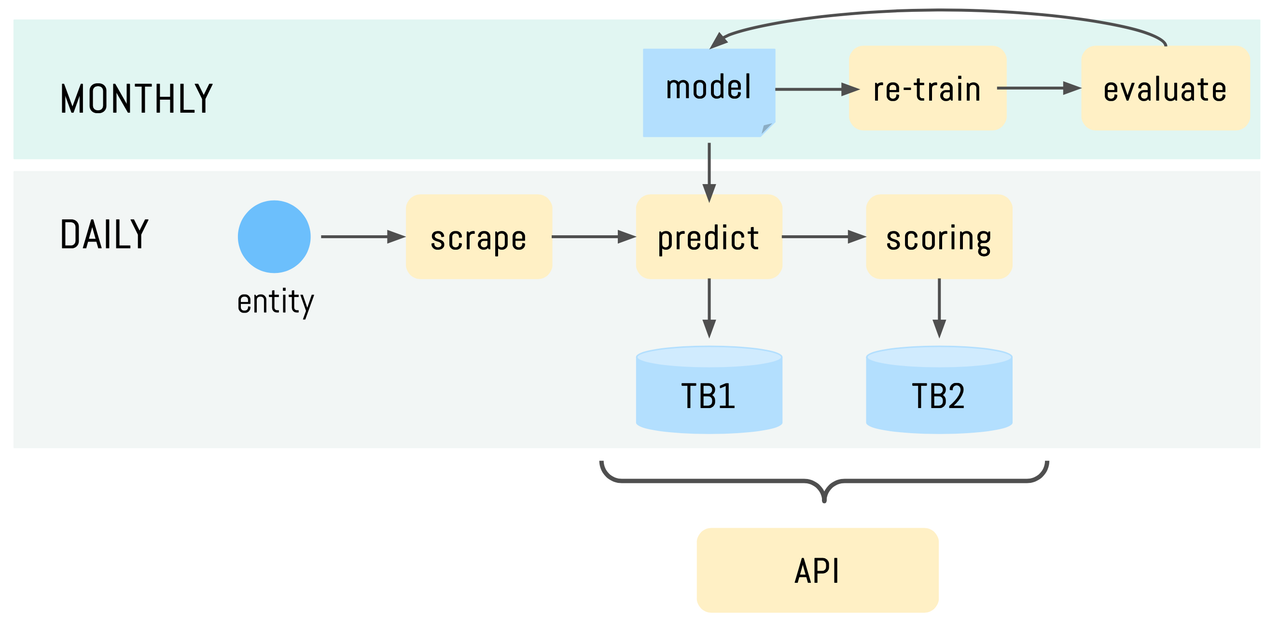
A more detailed breakdown of the project can be seen in the flowchart below.
This project should be run on Python 3.7. A conda environment can be created using the following:
conda create -n myenv python=3.7The end-user mainly makes use of the automation branch of the GitHub repository. A requirements.txt file is provided for the specification of the packages used in the project. The user can run the following command to install the packages.
pip install -r requirements.txtnumpy==1.19.2 numpy==1.18.5
The entire data retrieval, risk scoring, and data storage pipeline of the project have been automated in the auto_pipe.py file. The user simply specifies the entity and the time period for the get_data function. For example,
from datetime import datetime

entity = 'binance'
start = datetime(2020,9,1)
end = datetime(2020,10,26)
get_data(entity, start, end)
After retrieval of data for all entities, users need to apply the get_overall_risk function to calculate and store the overall risk score for all entities on each date within the date range.
The auto_pipe.py file also provides a train function for the model to be re-trained when performance drops (or on a monthly basis depending on whichever is more suitable). The train method automatically retrieves data from the database for re-training. Parameters that the train functions accepts are specified under the function itself.
/Users/charry/nft/lynx-blockchain-risk-scoring/scraping/bitcoinmagazine.py
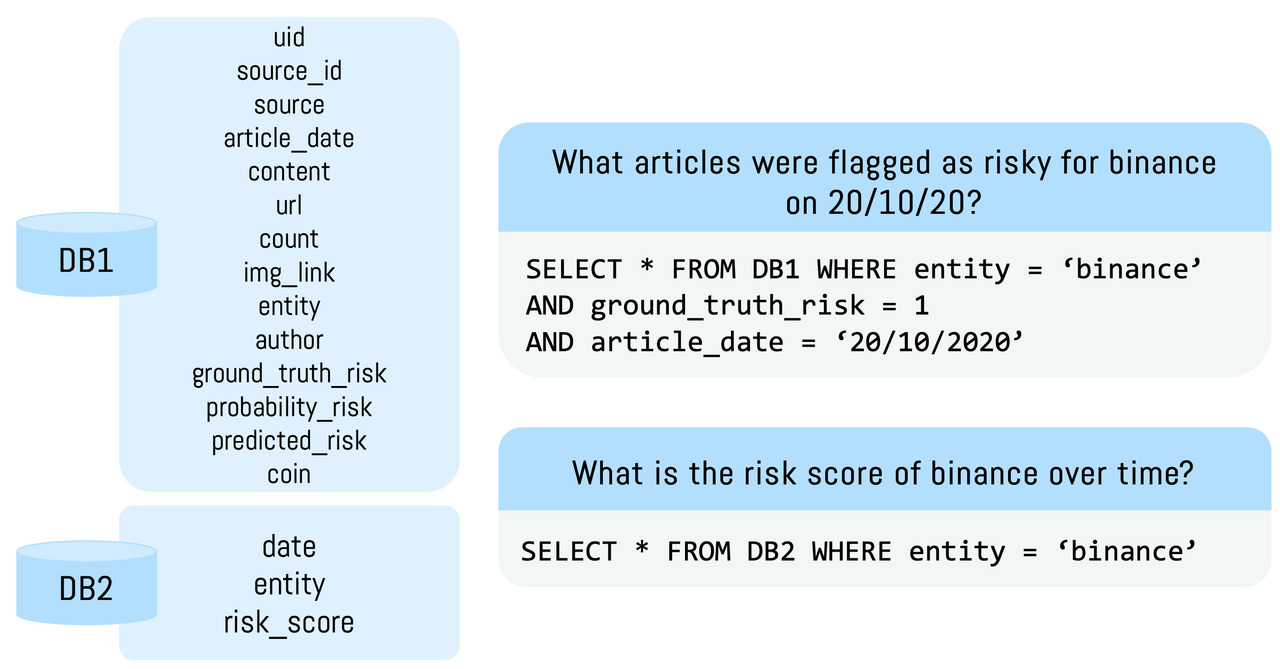
Two databases are used to store post-level and entity-level data respectively. Specific columns within each database and sample queries on risk scores can be seen below.
We created a dashboard using python Dash to demonstrate how our work can be utilised to help financial regulators monitor the cryptocurrecy entities.
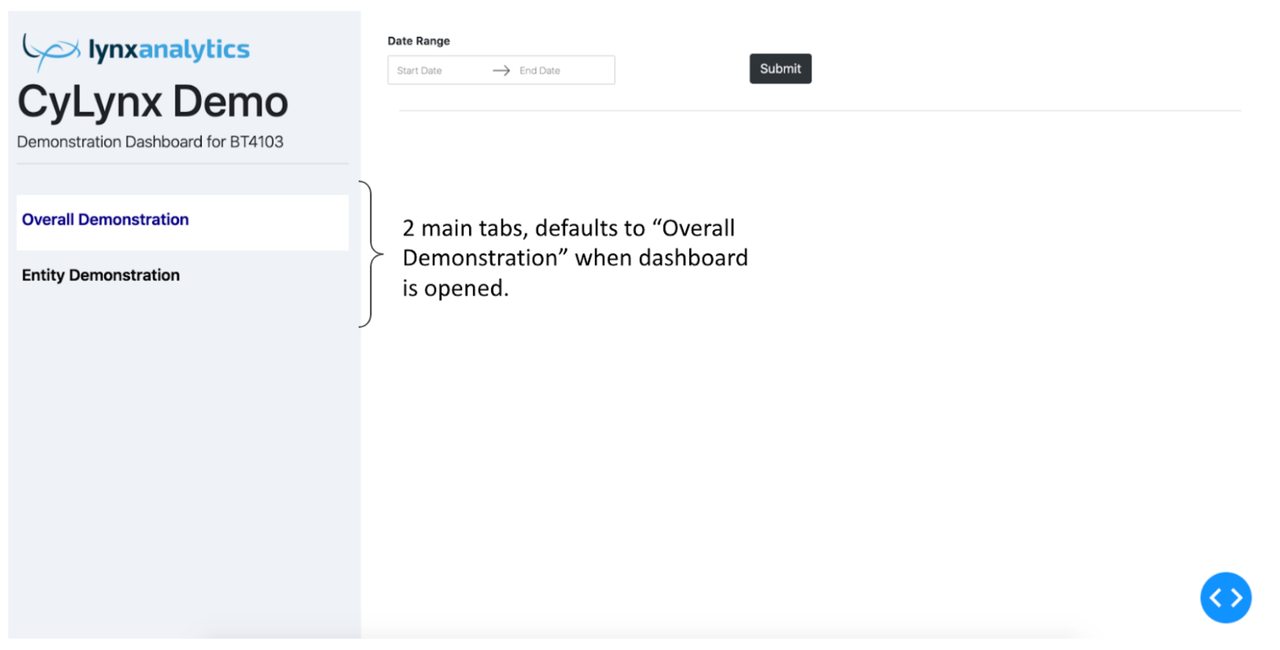
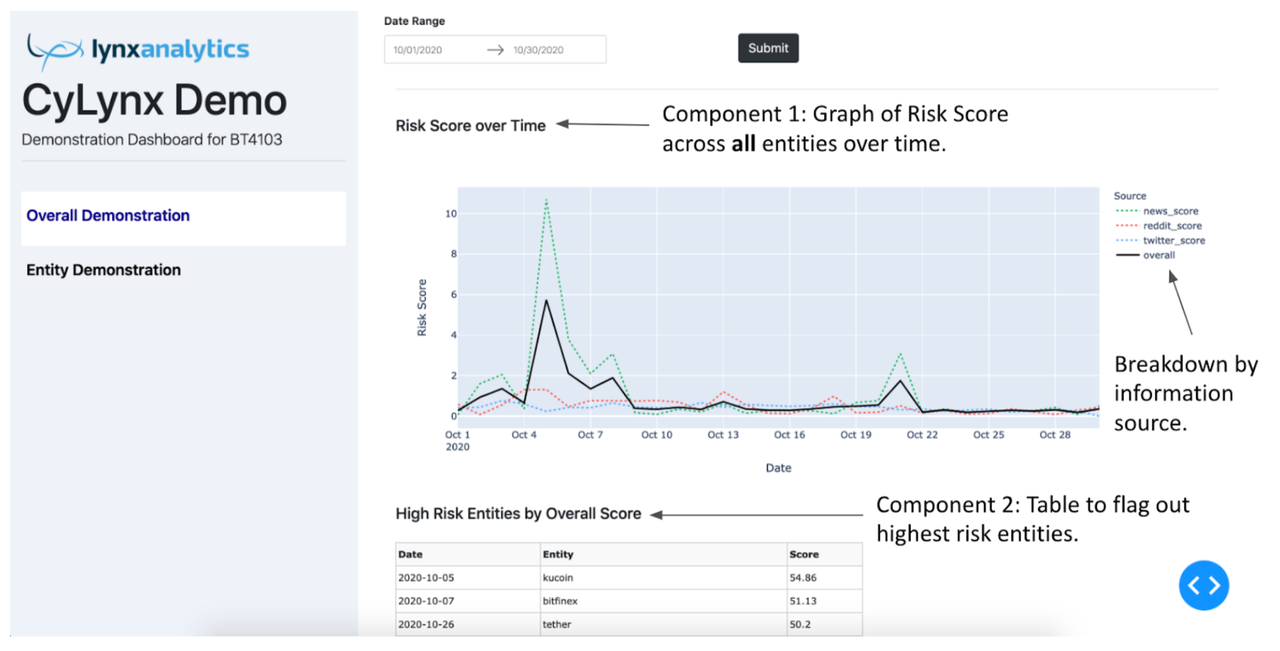
The following screenshot shows what the users will see when they open the dashboard. There are 2 main tabs: (1) Overall Demonstration, and (2) Entity Demonstration. The tab that the user is currently on is highlighted in white.
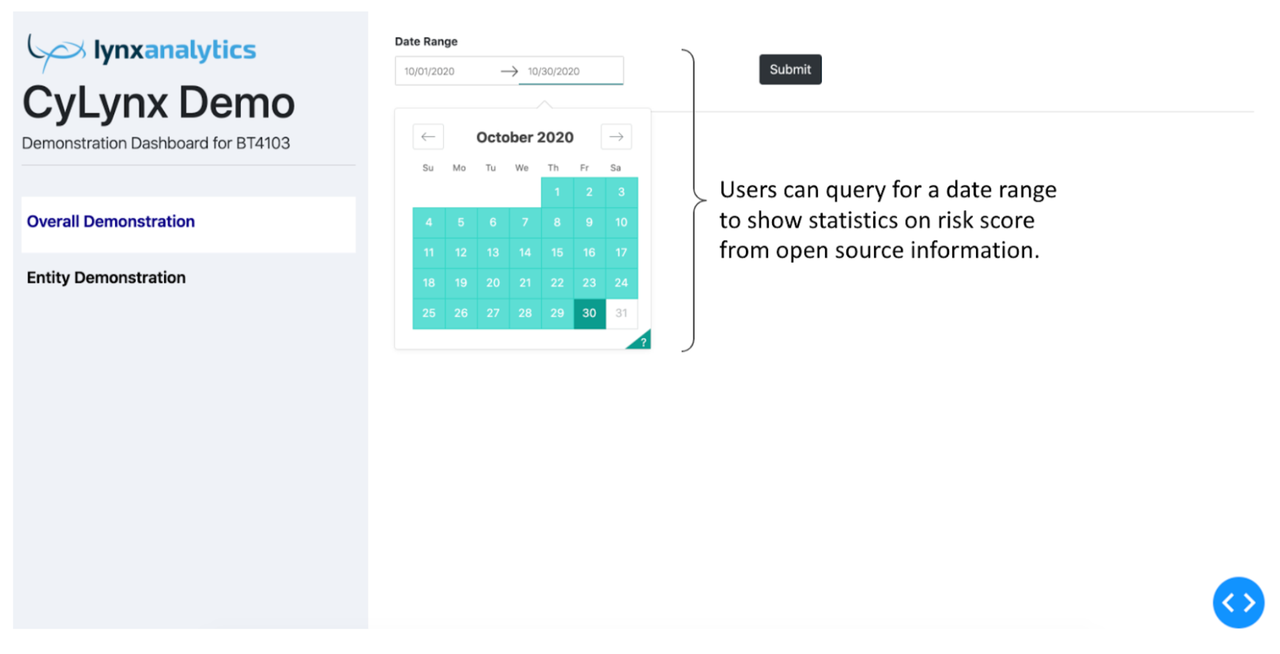
Under the Overall Demonstration tab, users can query for a date range.
The output of the query is shown in the screenshot below. There are 2 main components, the first being a graph of risk score across all entities over the queried time period. There are 4 lines in the graph: (i) Overall Score, aggregated across all information sources; (ii) News Score; (iii) Reddit Score; (iv) Twitter Score. The overall score is a solid, black line for easy identification, while the lines showing the breakdown from different news sources are in coloured, dotted lines. For easy recognition, the graph for Twitter and Reddit is in blue and red respectively, which corresponds to the colour of their application icons. The graph for news score over time is in green.
The second component of the overall demonstration tab is a table which flags out the highest risk entities in the queried time period.
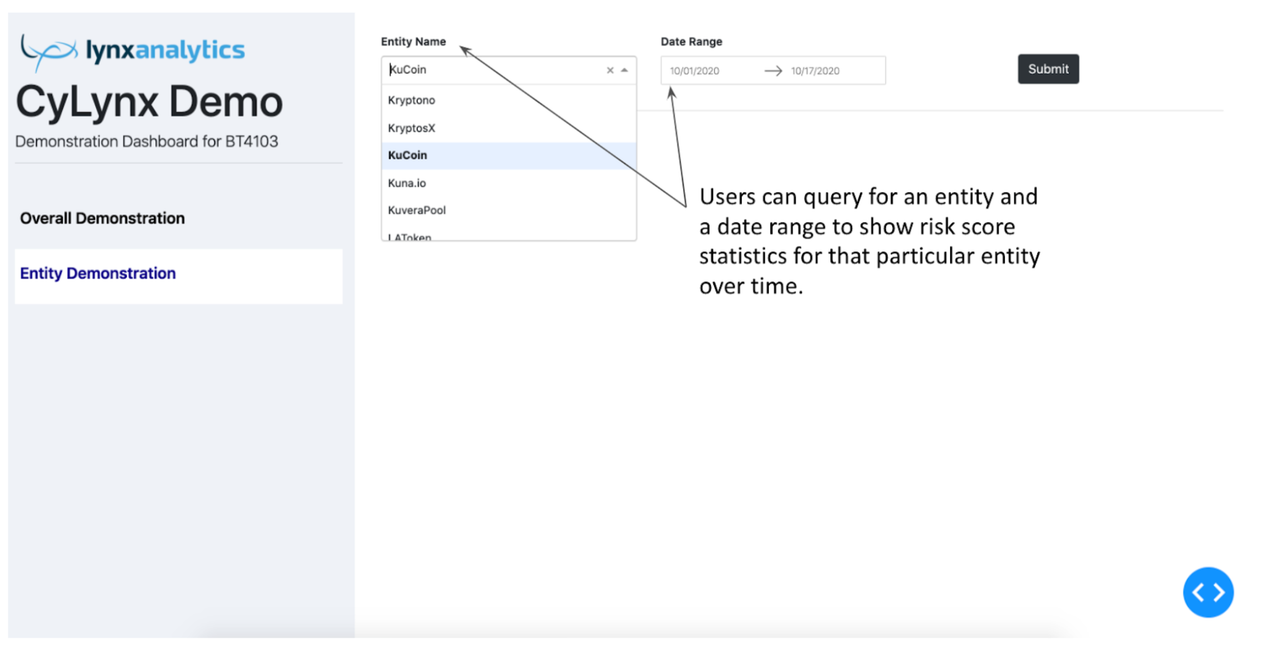
Under the Entity Demonstration tab, users can query for an entity and a date range.
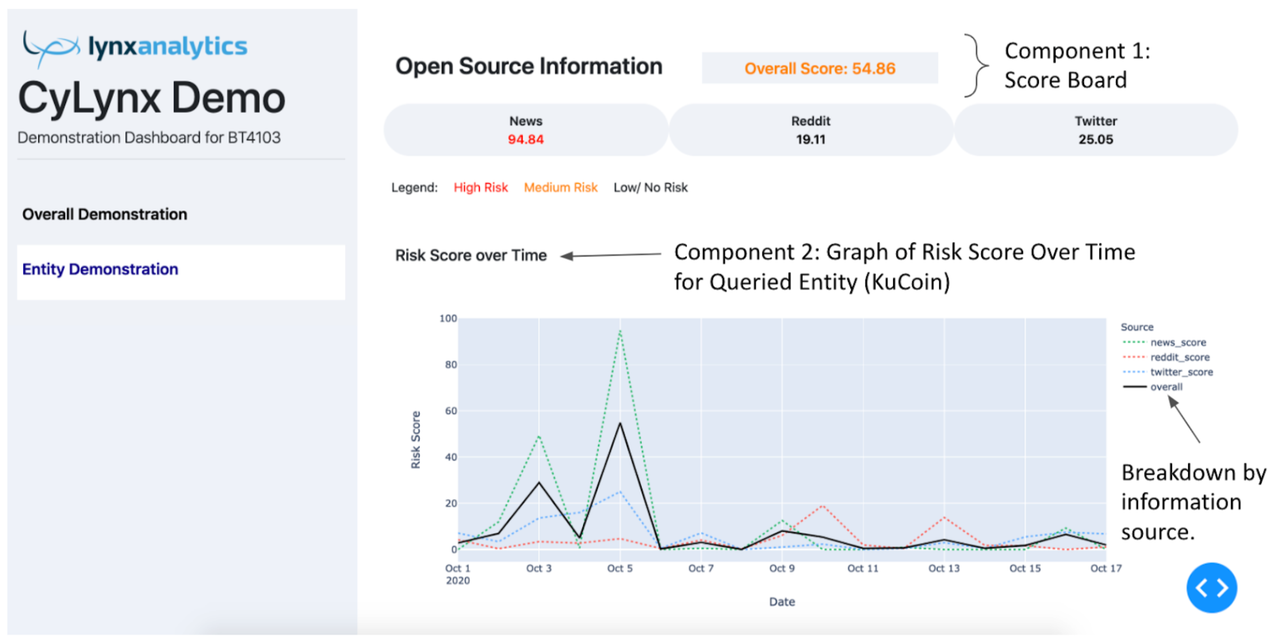
The output of the query is shown in the screenshot below. There are 3 main components, the first being a scoreboard which shows the maximum risk score of the various sources in the queried time period. They correspond to the value of the peaks in the individual line graphs in the second component. The scores are colour coded according to a legend, red being high risk, and orange being medium risk. The colours will help to flag out to end users important information, which is that the entity is of high risk in the queried time period in this case.
The second component is a graph of risk score over time for the queried entity, with a legend similar to the graph in the overall demonstration tab.
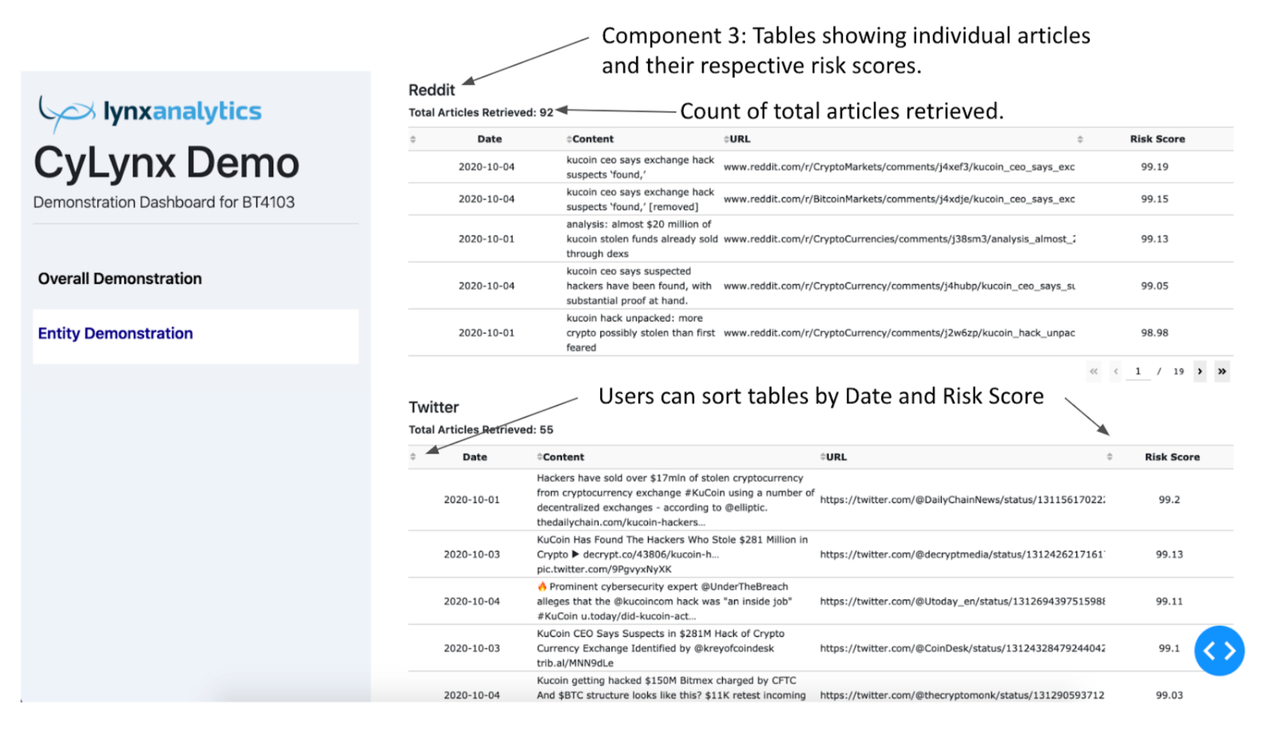
The third component of the entity demonstration tab consists of 3 tables: one for Conventional and Crypto news (not shown in the screenshot below), and one for Reddit and Twitter respectively. The table is limited to a maximum of 5 rows, for ease of reading.
The main folder to be used is automation, which has combined the source code and automated the pipeline using the other folders.
Here is a breakdown of the other folders,
| Folder | Function |
|---|---|
| scraping | Scraping scripts for open source information, including news, Reddit and Twitter data |
| sentiment-analysis | Models attempted for risk scoring, including Bert, FastText, word2vec and Vader |
| evaluation | Evaluation of the better performing models - Bert, Roberta and word2vec on 2020 data |
| scoring | Methods to assign risk scores to entities based on output from the model |
| demo | A sample visualisation built using python dash |
Mains scripts in the scraping folder are: main_conventional.py, main_crypto.py, reddit.py and twitter_twint.py. Note that the original twitter.py which uses the twitterscraper API may not be able to retrieve tweets due to a known problem stated on its GitHub page.
Each scraping function takes in three arguments: entity, start date and end date, and returns the open source data within the stated date range for the particular entity.
The rest of the scripts in the folder are website specific, such as cryptonews.py. These scripts are imported by the main scrapers.
Each of the four models attempted has additional files apart from the main one.
For Bert, the bert_model_analysis.ipynb was created to understand the model from various perspectives, including word cloud, word count and optimal threshold selection.
For FastText, three models are attempted and the scripts are saved separately. fasttext_offshelf.ipynb uses pretrained models; fasttext.ipynb trains a model using our own labelled data; fasttext_preprocessing.ipynb added preprocessing on top of fasttext.ipynb.
For Vader, vader.py contains the simple prediction code without performance evaluation. vader_original_backtest.py makes use of the original vader dictionary for sentiment scoring while vader_custom_backtest.py adds a list of customised words to the dictionary.
For word2vec, word2vec_improvements.ipynb contains various methods attempted to improve the performance. The lime package is used to explain the word2vec model and the code can be found in evaluation_lime.ipynb.
Two additional evaluation notebooks were created to better understand word2vec, Bert and Roberta:
- evaluation_textprocessing.ipynb: looks into how each model handles transaction hashes and joint digits (eg, "40 million" vs "40million")
- evaluation_wordrisk.ipynb: tries to list out the most influential words for prediction for each model
Notably, we have also tried to resolve the issue of an entity being wrongly tagged - the news mentioned this entity but the hack case was on another entity. However, the task proved to be too complicated and since such cases were rather rare, we took the issue as a limitation of the current model. The attempt can be found in article_tagging.ipynb.
The model performances were furtehr evaluated from the hack capturing perspective on 2020 data.
We compare the percentage of posts being scored as high risk for each entity and check whether high percentage correponds to the empirical hack cases. For example, the graph for Binance can be seen below.
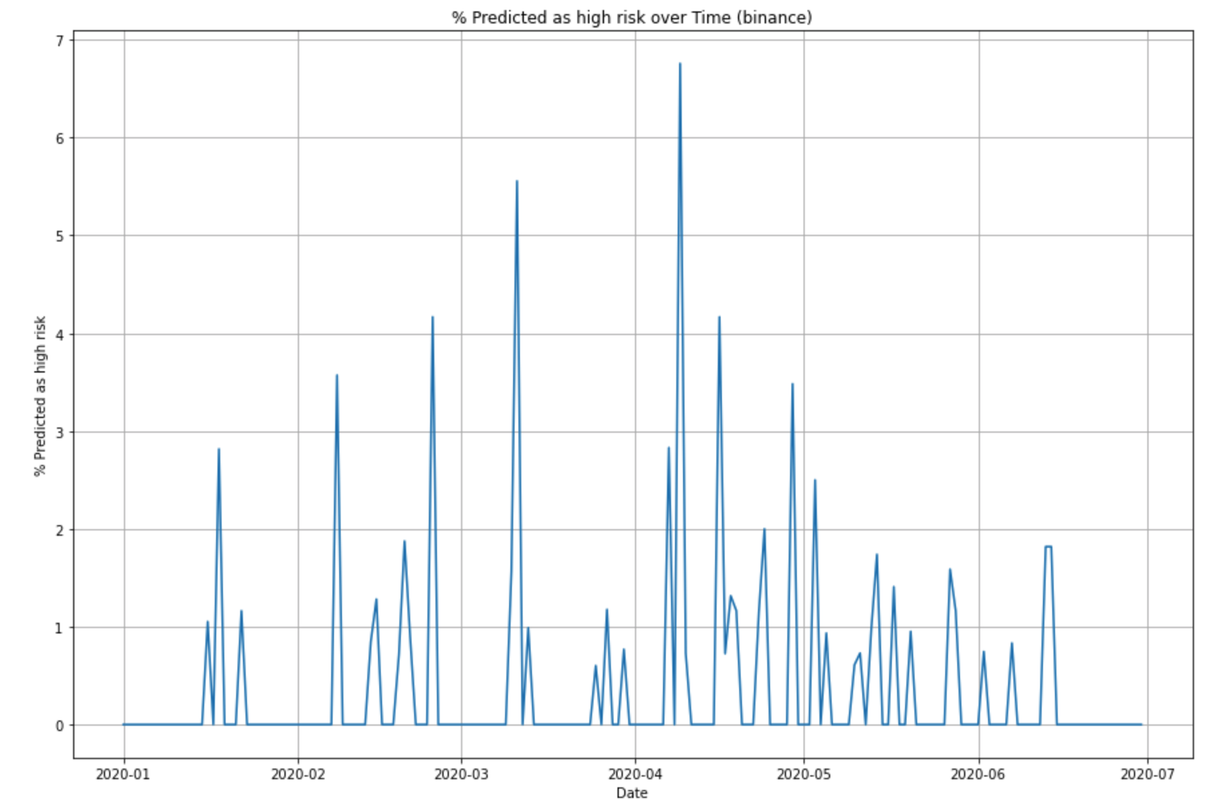
We can then compare to the real hacks reported for Binace,
2020-03-11 - Binance Users in Turkey May Have Been Compromised, Many Receive Phishing SMS Messages
2020-04-07 - Binance Accused of Stealing $1 Million Worth of Assets: Company Denies Everything but Class Action Underway
2020-04-29 - Binance ddos attack
This preliminary analysis on empirical performance is further developed with a precisely define risk scoring method across entities.
There are two files under this folder.
The scoring_exploration.ipynb includes our initial exploration in order to decide on the risk scoring method from the raw model output. The values attempted, regarding risky posts, include daily count, percentage and weighted percentage (as certain posts appear more than once, especially for Reddit and Twitter). Decay was also tried to smoothen the curve.
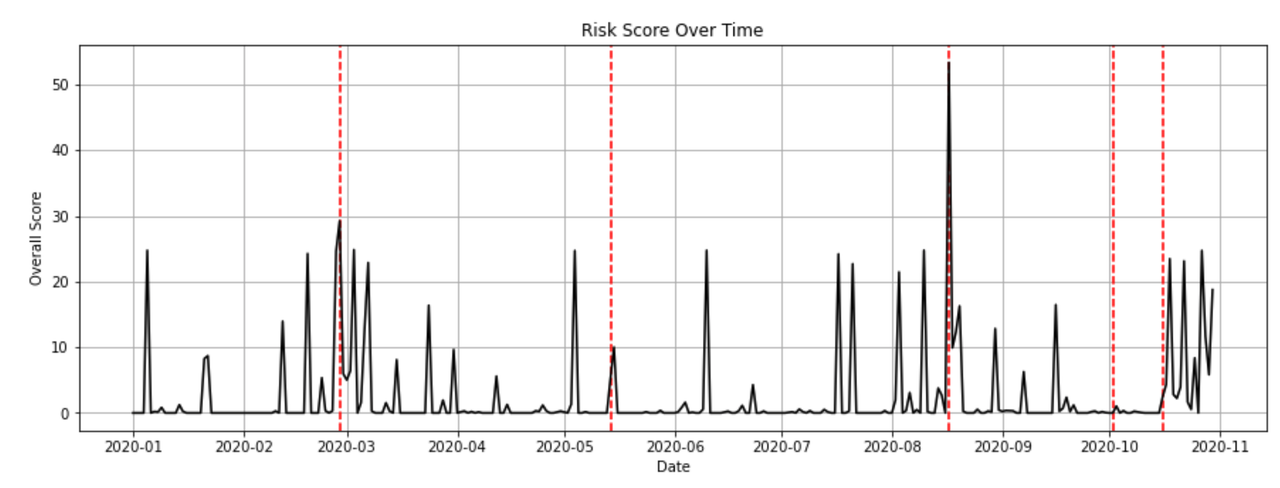
For the scoring_final.ipynb, we eventually decided to use weighted average with customised thresholds for different entities. Here is the sample output for Okex. The red dotted lines mark the actual hack cases.
The demo folder contains a sample dashboard for the end user. For simplicity, we just took in data from two csv files with the same information structure as the database. The actual visualisations are covered in the section above.