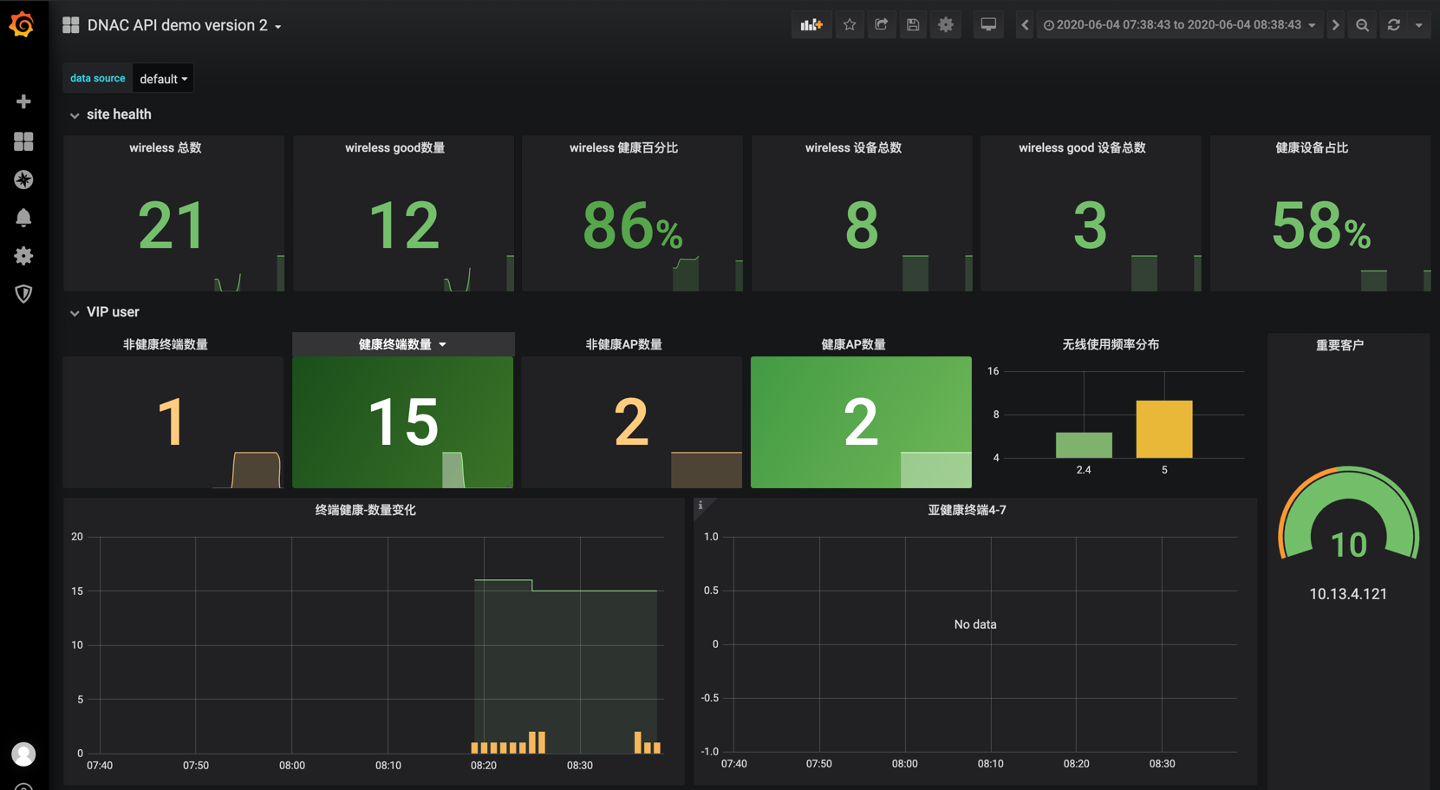
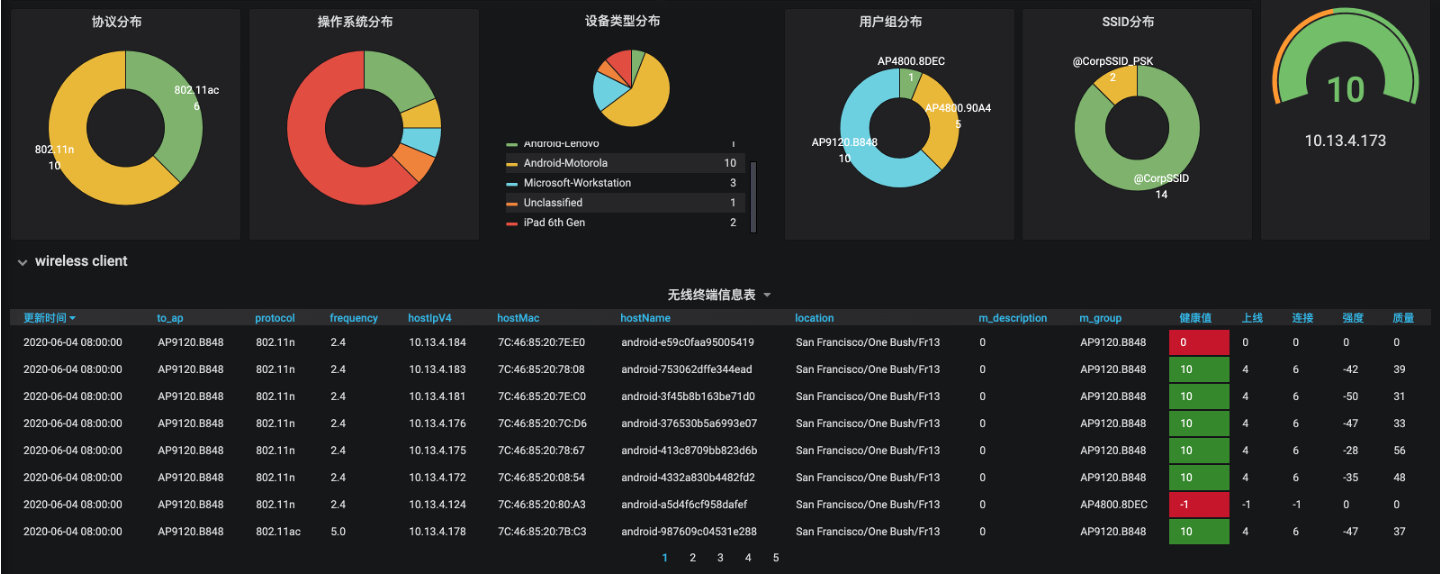
Virtualization, automation, and cross-domain solutions help a lot in modernize the infrastructure, while introducing unprecedented challenge in operation, as the managed objects explosively grow in quantity, not physically observable, continuously changing with increasing and diverse use cases.
Commercial operation platform doesn’t catch up, and would be costly to develop.
Operation is passive, with the same small operation team to handle the continuously growing complexity.
Help the customer build operation center starting from monitoring for Cisco cross-domain solutions.
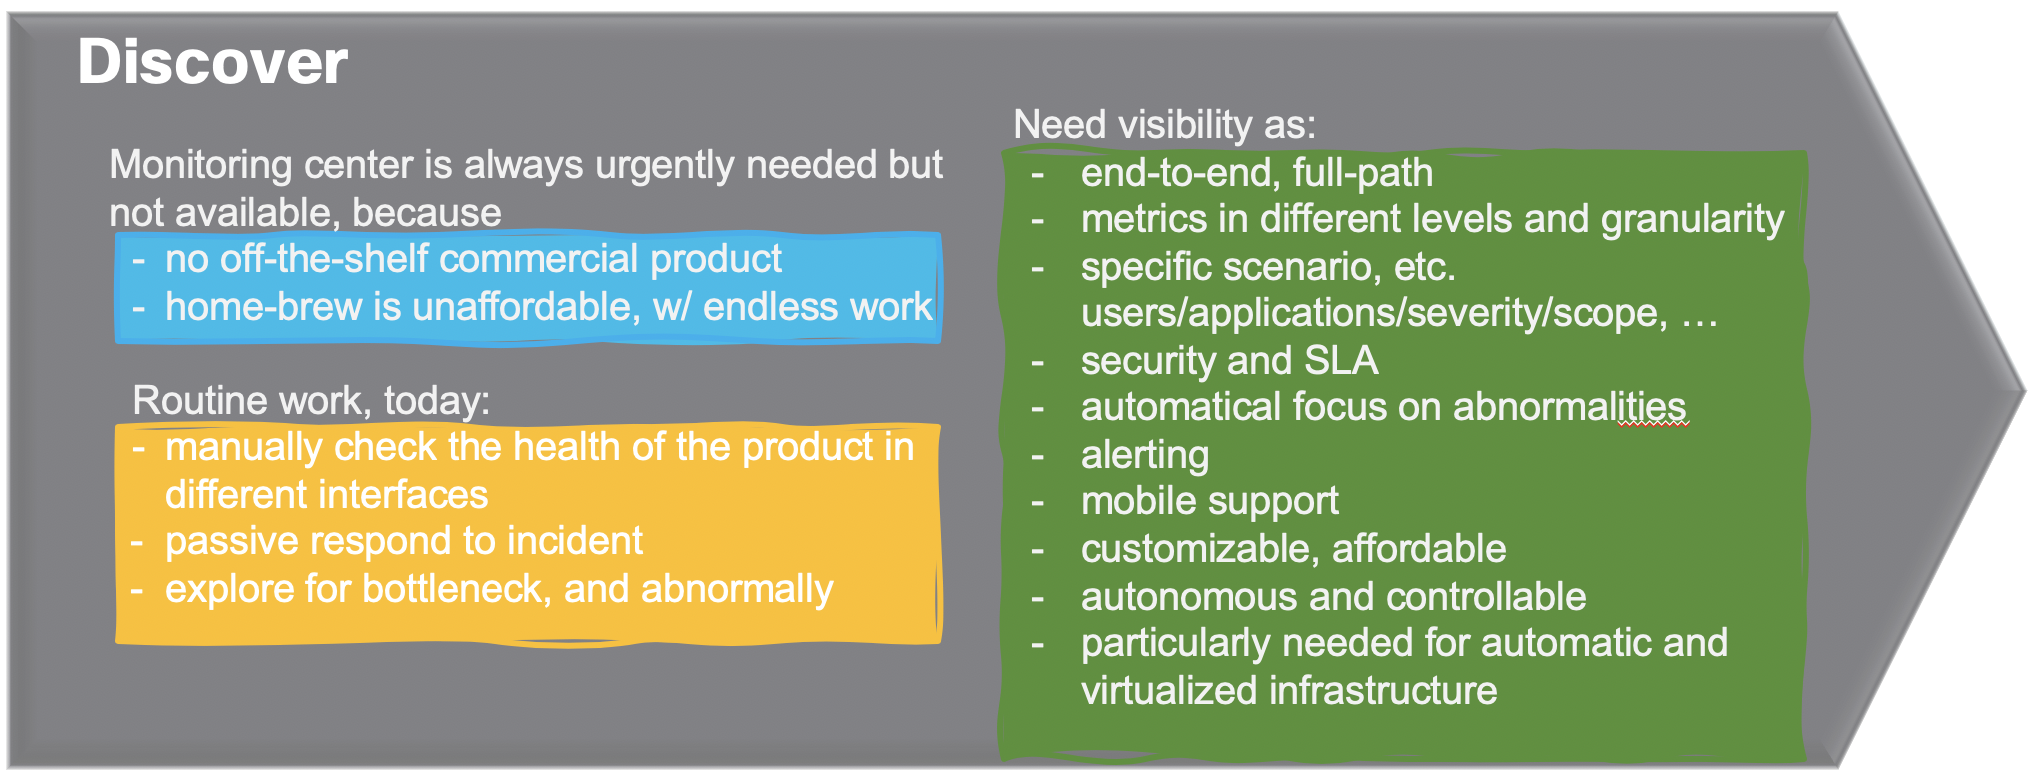
Use CNCF open source project to collect different monitoring sources
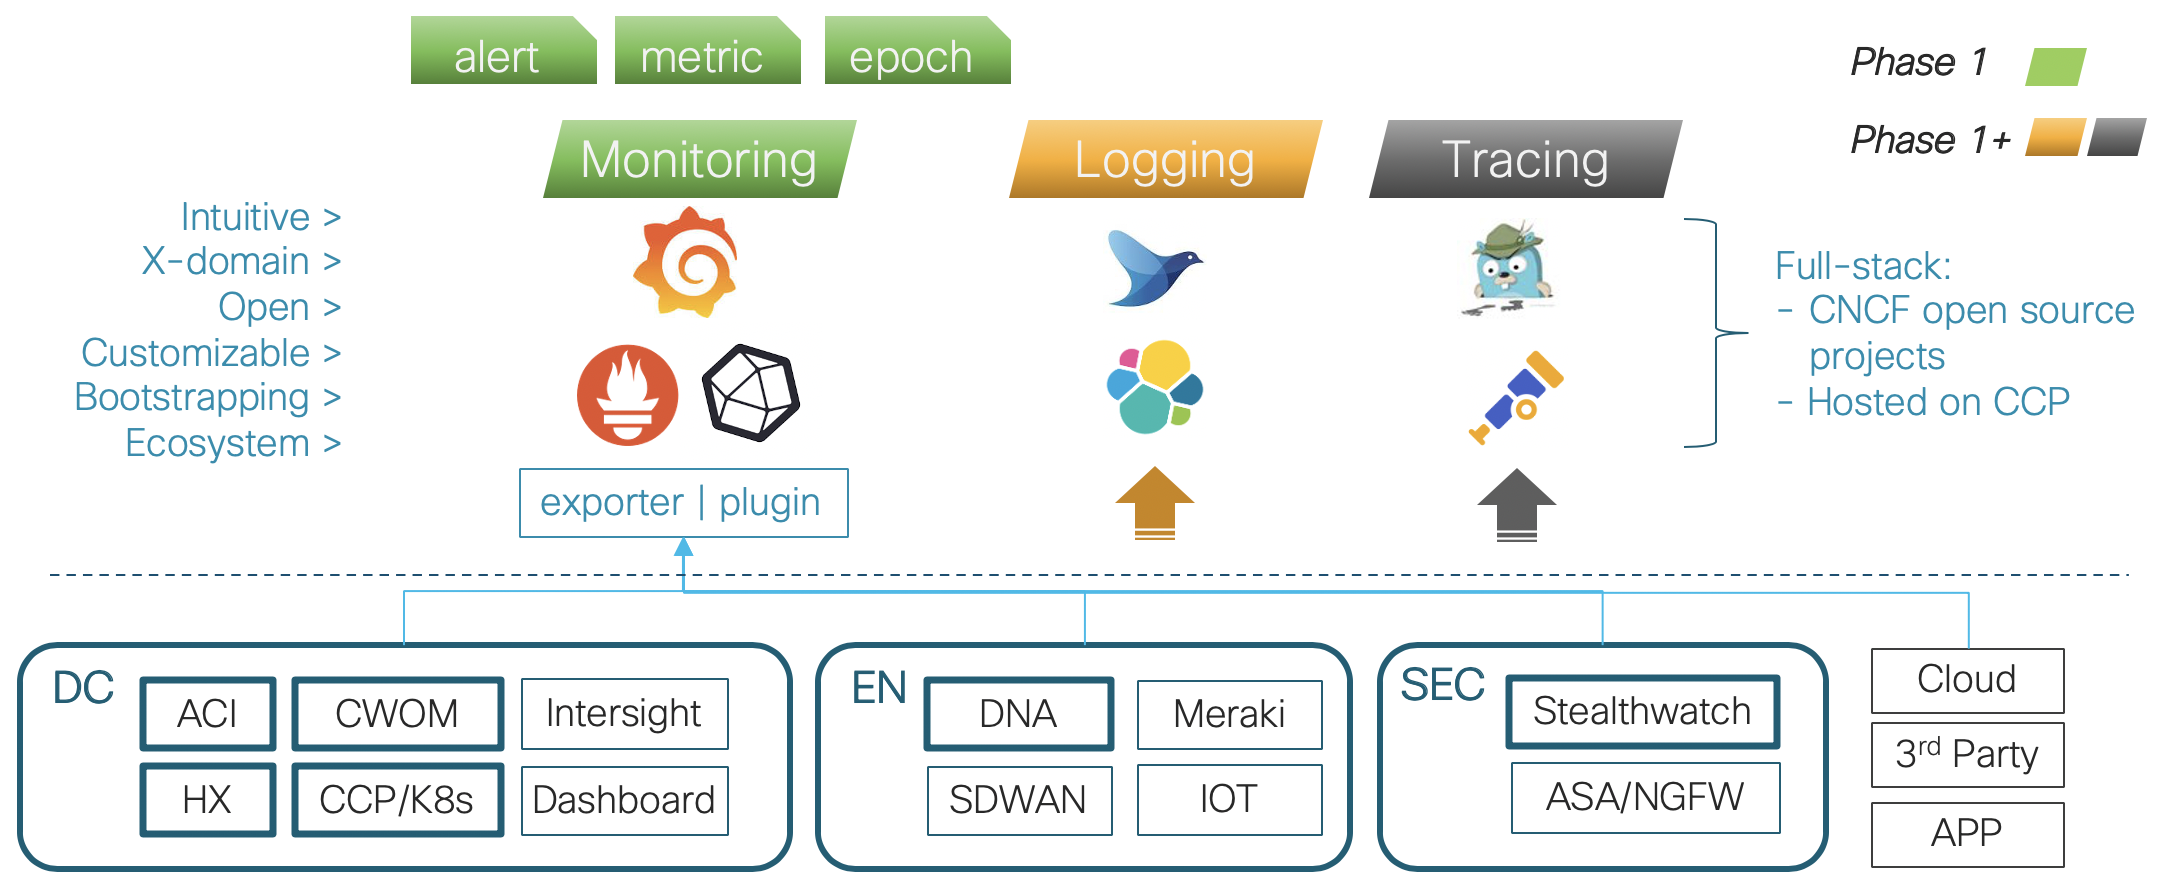 Monitoring: Grafana, Prometheus, Telegraf
Logging: Fluentd, ELK
Tracing: Jaeger, Open-telemetry
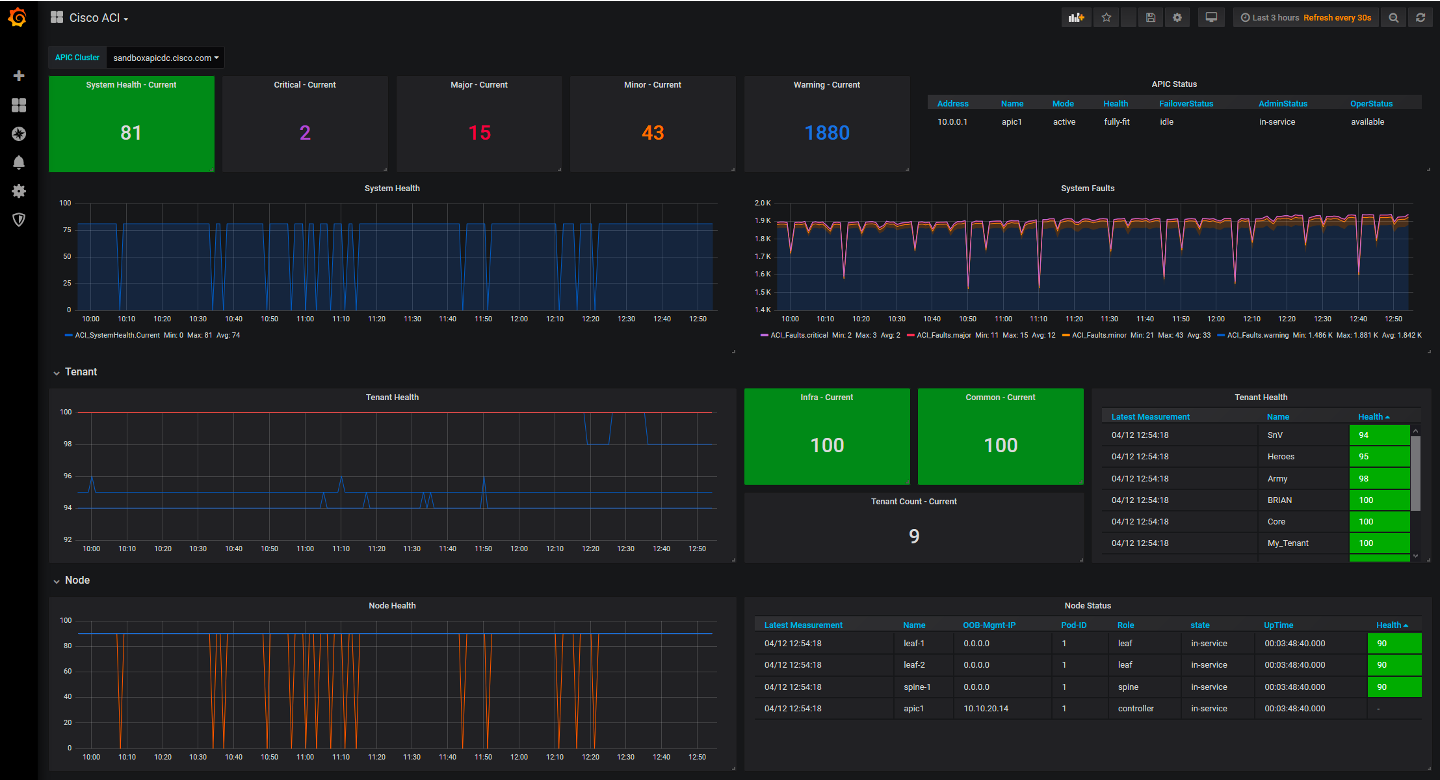
The Dashboard is a Cisco ACI visual operation center and metrics should help customers simplify monitoring and operation.
 The Dashboard is a Cisco DNAC visual operation center and metrics.
