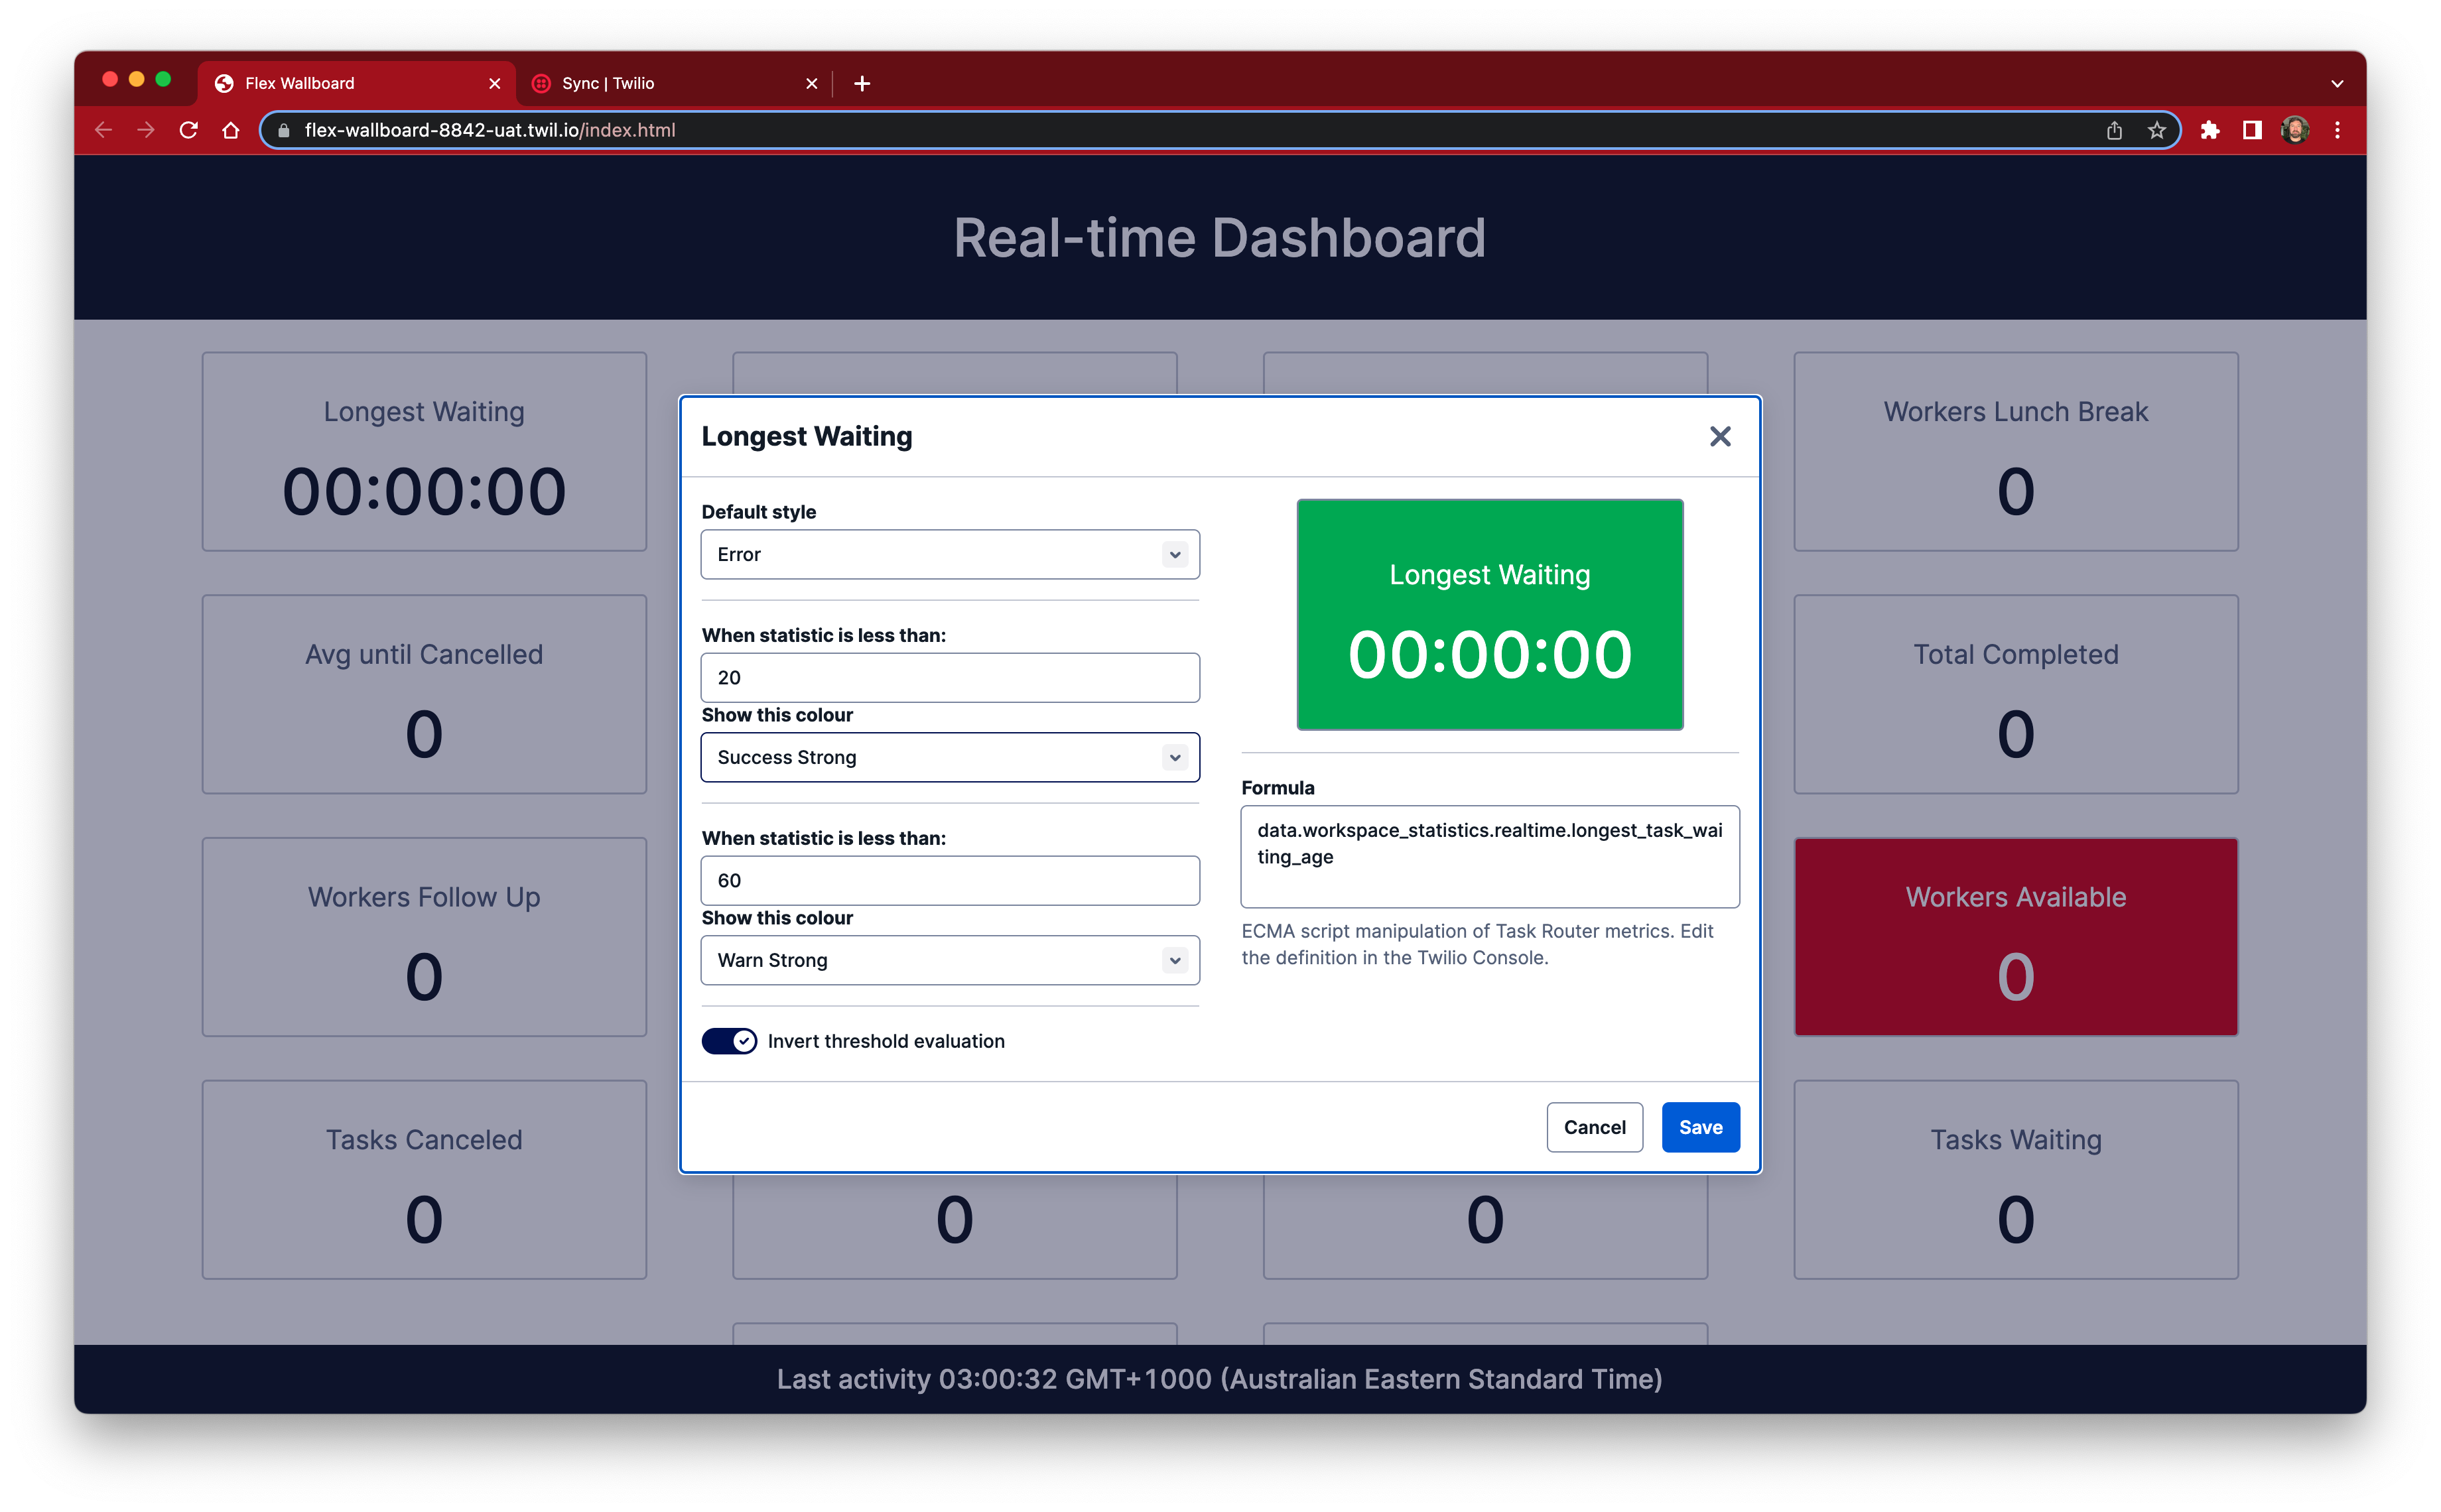
⚡️ Real-time dashboard ⚡️ to show statistics in on common displays or your other monitor
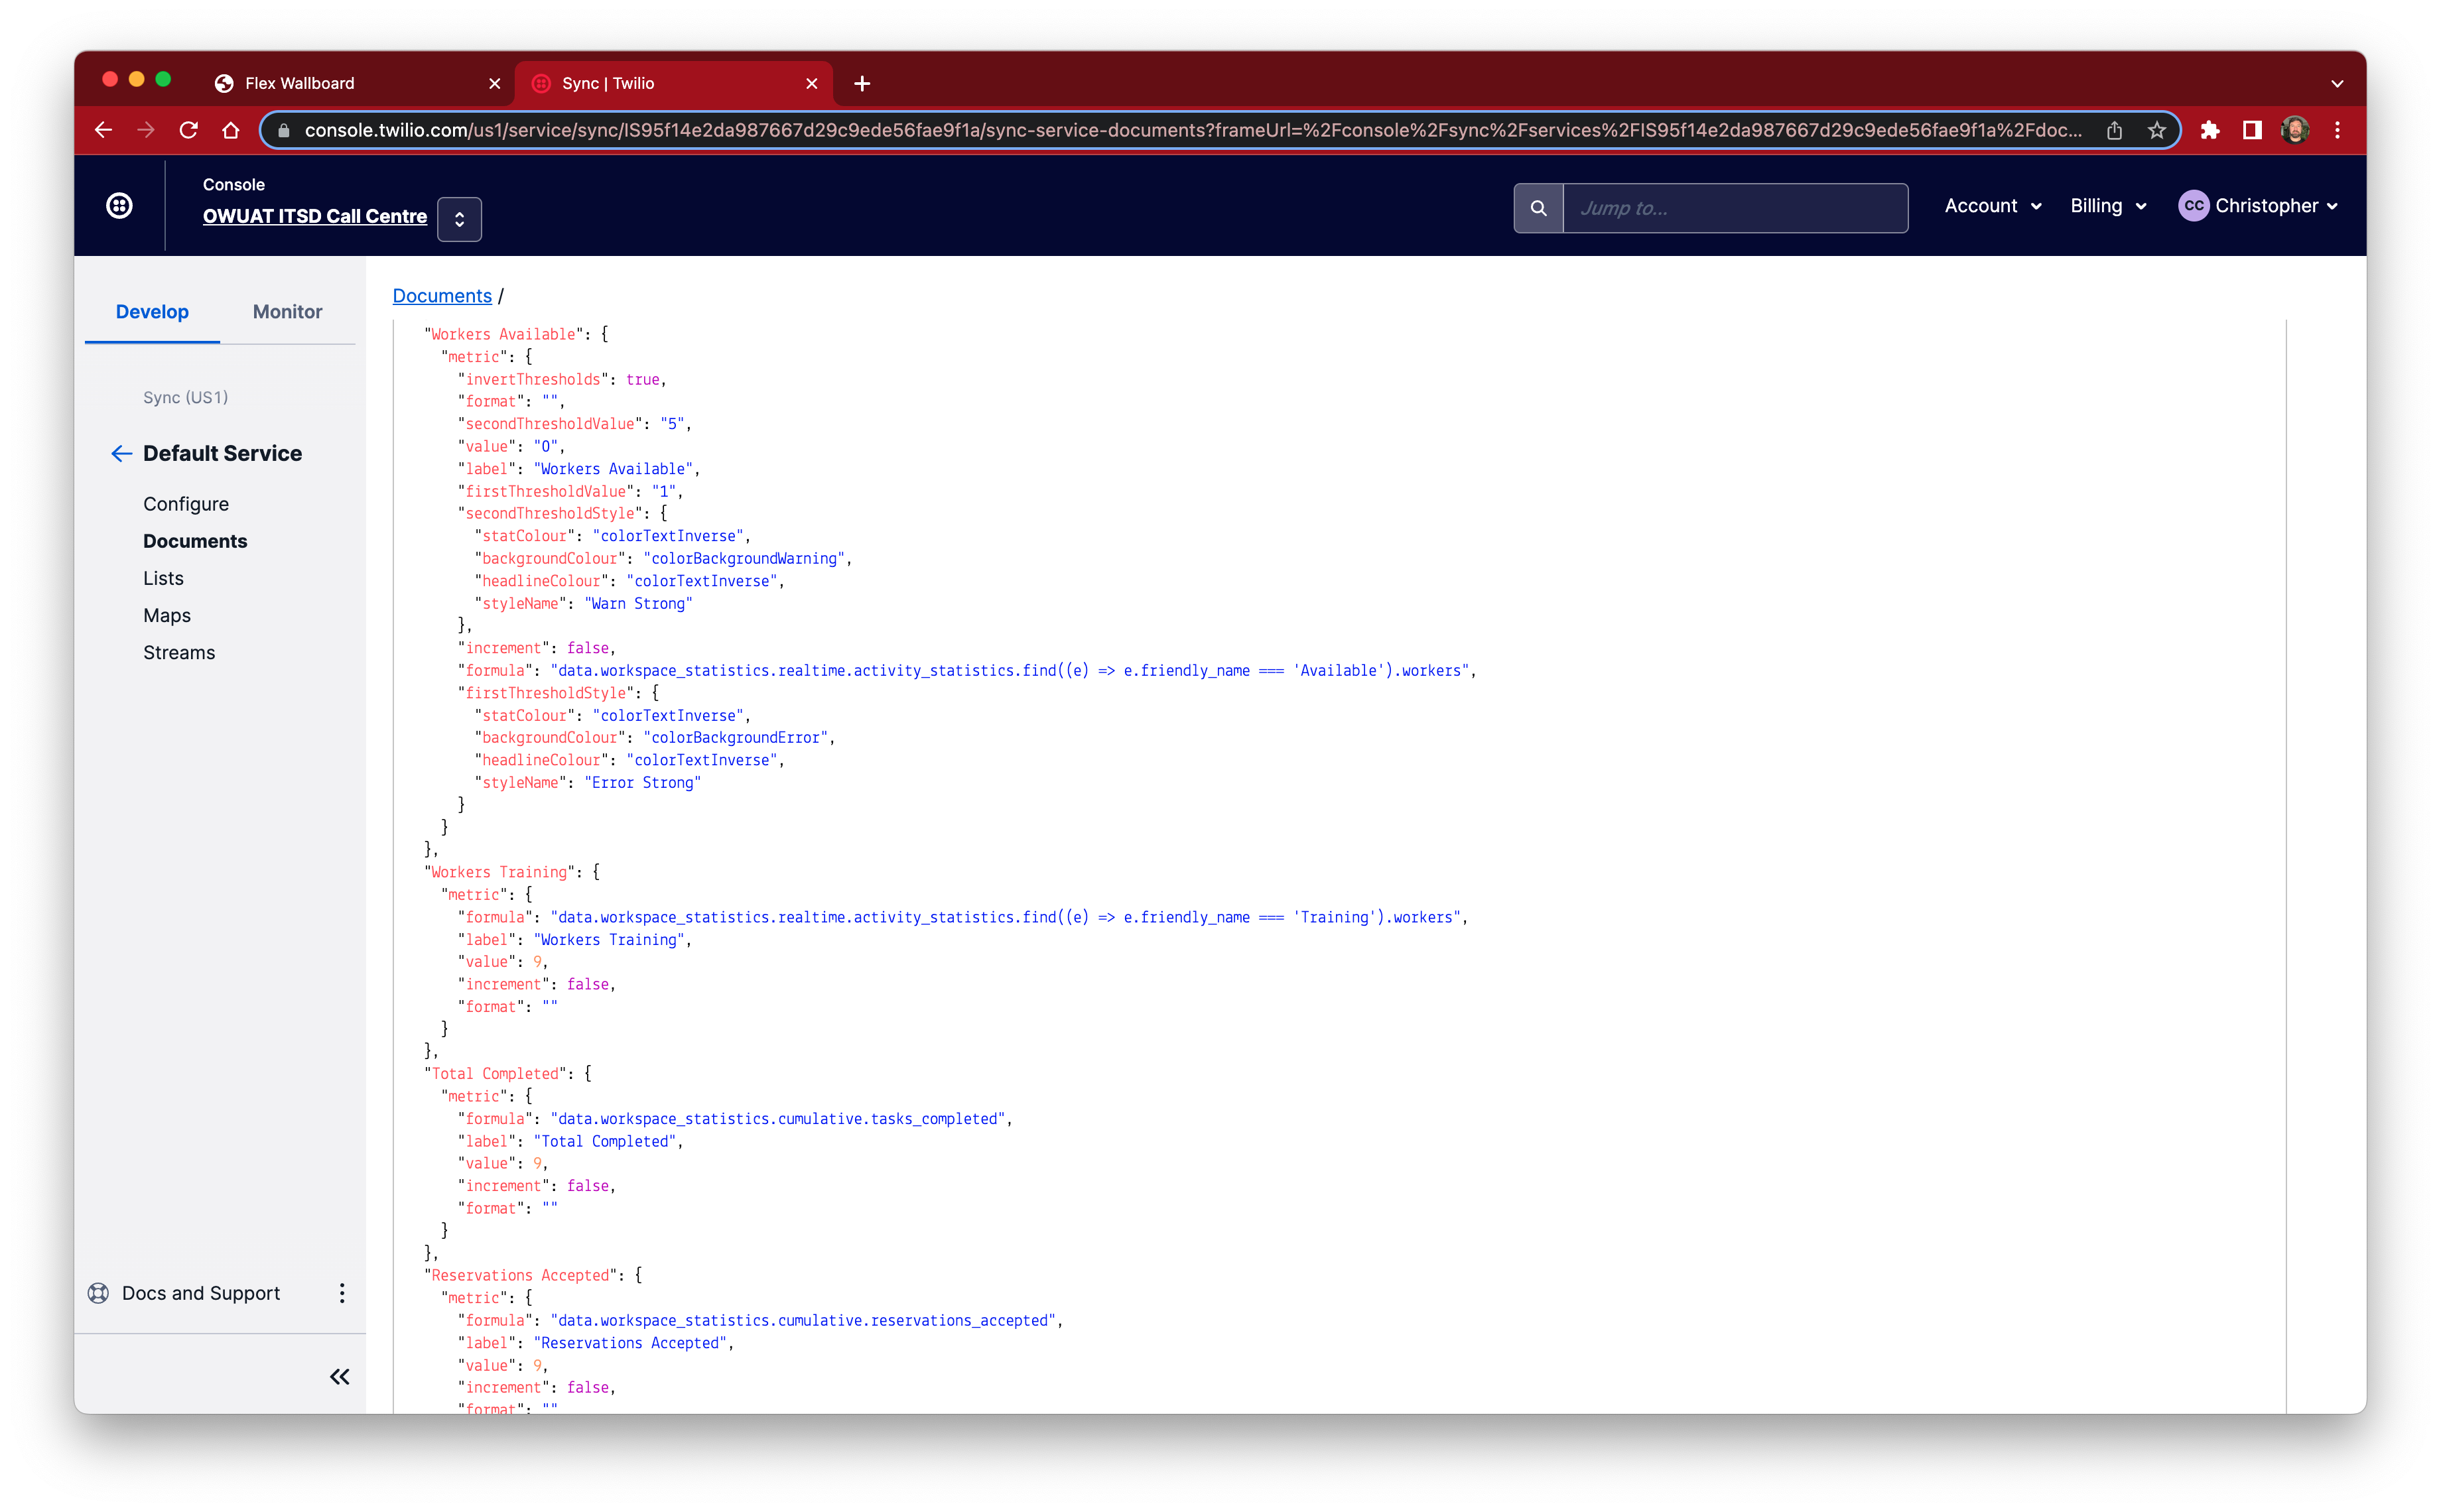
Stats are stored in a Twilio Sync document to which all clients are subscribed by the sync client API.
Metrics can be anything! The dashboard has a built-in ECMA script based interpreter that enables you to show any data you like by defining a formula, it can be a simple as the value or more complex as you see fit. All you need to do is define the metric and put it in the definitions sync document.
Features:
- 🆕 Supports high volume statistics using Sync Map item distribution
- 🌟 Configurable statics, anything in a JSON document can be turned into a metric 💥
- 🌟 Supports Workspace and Task Queue stats OOB
- 🌟 Javascript interpreter to evaluate stats at runtime => Formulas
- 🌟 Two levels of ✅ ⛔️ thresholds
- 🌟 Inverted thresholds (evaluate in rising/falling number)
- 🌟 All your favourite colours 😻
- 🌟 Paste theme customisation support
Minimum example:
{
  "Unique Stat Name": {
    "metric": {
      "value": 6,
      "label": "My awesome statistic",
      "formula": "data.key_name_to_show"
    }
  }
}Formulas can be any ES6 javascript notation using top level functions as utilities
{
  "Workers Logged In": {
    "metric": {
      "format": "",
      "formula": "data.workspace.realtime.total_workers - data.workspace_statistics.realtime.activity_statistics.find((e) => e.friendly_name === 'Offline').workers",
      "increment": false,
      "label": "Workers Logged In",
      "value": 9
    }
  }
}
Task Queues and associated data may be located using the .find method
"TQ: Everyone - Total Timed Out": {
  "metric": {
    "format": "",
    "formula": "data.queues.find((q) => q.friendlyName === 'Everyone').data.cumulative.reservations_timed_out",
    "increment": false,
    "label": "TQ: Everyone - Total Timed Out",
    "value": 9
  }
}An even more complex example with thresholds (colours) at different intervals
{
  "Longest Waiting": {
    "metric": {
      "defaultStyle": {
        "statColour": "colorText",
        "backgroundColour": "transparent",
        "headlineColour": "colorTextDecorative10",
        "styleName": "Default"
      },
      "format": "seconds",
      "secondThresholdValue": "600",
      "value": 6,
      "label": "Longest Waiting",
      "firstThresholdValue": "10",
      "secondThresholdStyle": {
        "statColour": "colorTextInverse",
        "backgroundColour": "colorBackgroundError",
        "headlineColour": "colorTextInverse",
        "styleName": "Error Strong"
      },
      "increment": true,
      "formula": "data.workspace.realtime.longest_task_waiting_age",
      "firstThresholdStyle": {
        "statColour": "colorTextInverse",
        "backgroundColour": "colorBackgroundWarning",
        "headlineColour": "colorTextInverse",
        "styleName": "Warn Strong"
      }
    }
  }
}We use the power of Task Router to update a sync document when an event occurs, Task Router will emit a JSON document to a helper function (see: serverless/src/functions/api/stats.ts). This function simply stores the all the metrics received into the document which in turn causes all of the dashboards to update.
Because the Task Router data has a well-known and stable structure, we can expected a certain set of values to normally exist. However if additional Break codes are configured for Flex then more or less data will be available. A set of default metrics is located in default_stats.json, load these into a sync document (steps below) to get bootstrapped.
This is a Twilio Serverless project, run yarn build:<environment> to create a new build which will put files into the assets folder which is ideal for Twilio Functions.
See package.json for script details.
-
Create Twilio API key
-
Create new Sync Service (or use default)
-
Create new Sync map in above service and copy the SID
-
Create another Sync document in the same service called
dashboard-definitions(see:.envfor name) -
Import default statistic definitions from
default_stats.json, modify as required. -
Update
.envfile with API Key, Auth token, Task Router workspace and Sync Service and Sync Map
Use GitHub actions to deploy code, ensure the following is created:
- Create an environment
- Configure secrets (see build.yaml)
During development and testing workflows can be prototyped using ACT
For example:
- Install using Brew
brew install act - Ensure docker is running
- Configure secrets in
.secrets - Configur inputs in
.input(e.g. a single line withenvironment=dev) - Run with
act
-
Run
yarn next-buildto create new app build and put it inassetsfolder, note you can build for specific environments with:yarn next-build:devwhich uses the.env.developmentfileyarn next-build:uatwhich uses the.env.uatfileyarn next-build:prodwhich uses the.env.productionfile
-
Set the timezone variable e.g.
DASHBOARD_TIMEZONE=Australia/Sydneyin.envfile -
Execute one of the following commands depending on your environment
- Run
twilio serverless:deploy --env=.env.developmentto create new service and deploy the functions and assets - Run
twilio serverless:deploy --env=.env.uat --environment=uatto create new service and deploy the functions and assets - Run
twilio serverless:deploy --env=.env.production --productionto create new service and deploy the functions and assets
- Run
-
Run
twilio api:serverless:v1:services:update --ui-editable --sid <SID>to enable console editing -
In Twilio console > Task Router > Workspaces > (Default workspace for Flex) > Settings, set the "Event callback URL" to
https://<functions path>/dashboardStats
If you see "ERR" for a statistic it is an indicator the formula is incorrect. Check that that appropriate breaks have been configured in Flex.
If you see "ERR FMT" for a statistic it means the value of the statistic could not be converted into the appropriate format. Check the statistic definition, specifically the "format" value.
Original concept by Eli Kennedy, ported to NextJS and Twilio paste by C.Connolly

