The metrics_generator is the server code that generates metrics as well
as demos rust instrumentation for prometheus. Use cargo run inside it
to start the server. Uses port 8443, which is changeable in the code.
The collector_py contains a bare minimum prometheus custom collector
implementation. Build a venv and install the requirements.txt entries
before running python3 main.py to start the custom exporter. Uses
changeable port 9000.
Collector_go contains a bare minimum prometheus Client implementation
for Go. Use go run ./ inside the directory to start the exporter. Uses
changeable port 9001.
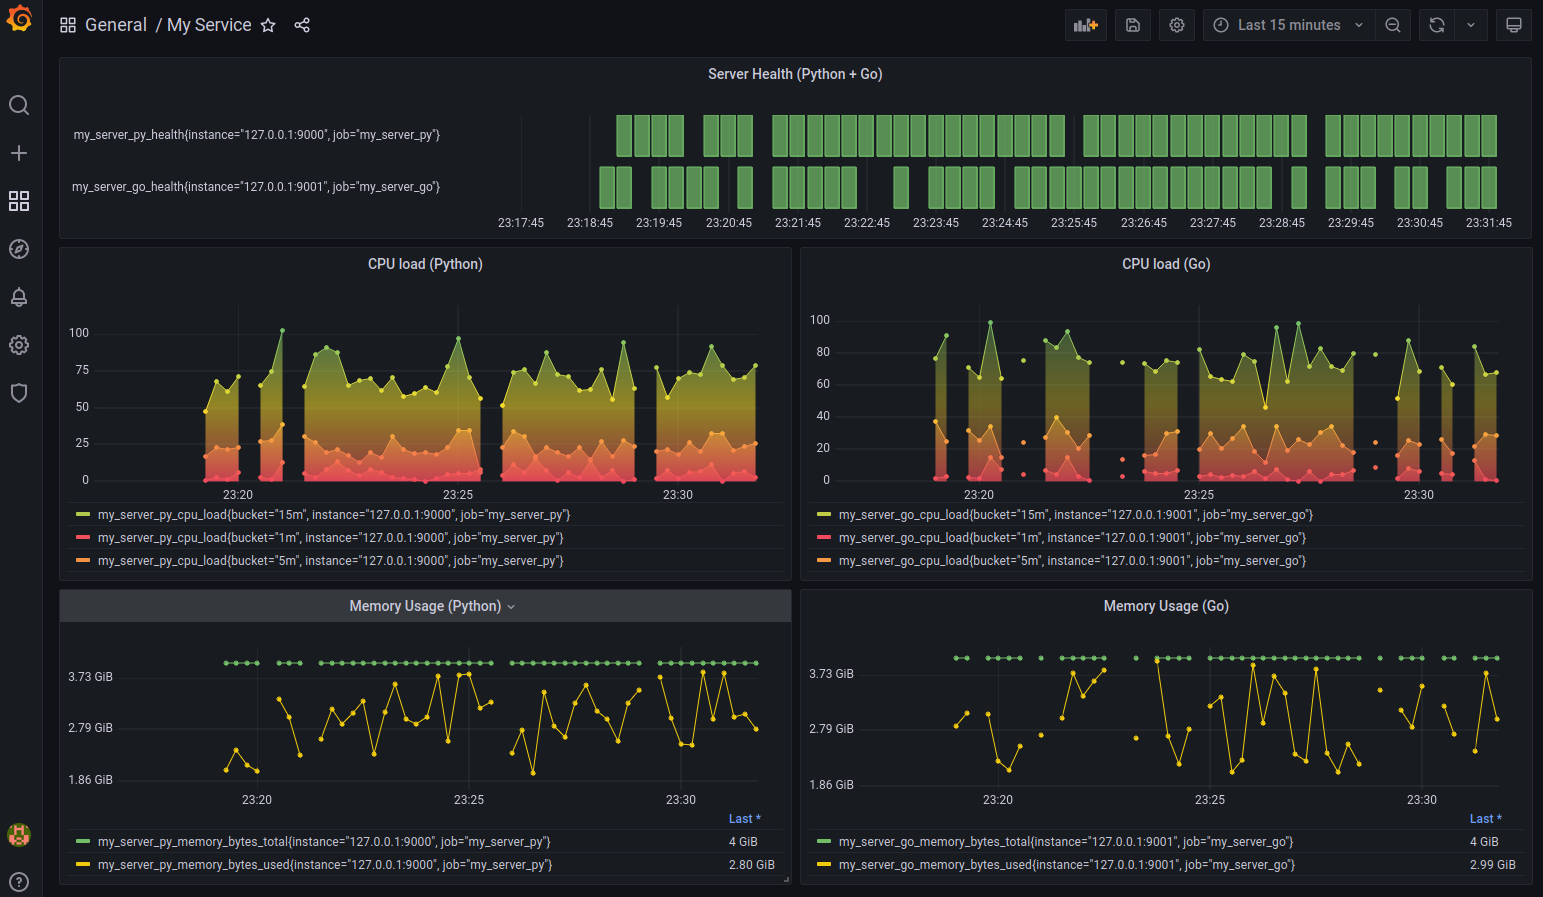
Additionally a prometheus server with matching scrape config to demo
metrics collection along with a grafana dashboard to spice the demo up
is also included. Prometheus port 9090 is mapped to host port 9090 and
Grafana port 3000 is mapped to host port 3000. Uses host networking to
keep things simple so that all can talk to each other without the need
for service discovery. Use docker compose up to start the services. Navigate
to http://127.0.0.1:3000 and import the grafana.json dashboard after
setting up the prometheus data source.
