Reimplmentation of Visualizing the Loss Landscape of Neural Nets with PyTorch 1.8
There are reasons for reproducing the existing code.
- Complexity of code
- Package dependencies of code (e.g., PyTorch 0.4)
The purpose of this repository is to simply use the visualization methods introduced in the paper using pytorch 1.8.0
It can be applied to metirc or loss used in your study by simply modifying this repository.
- torch==1.8.0 torchvision 0.9.0 with cuda 11.1
- numpy
- scipy
- h5py
- matplotlib
- seaborn
pip install -r requirements.txtThe configurations to visualize the loss landscape of ResNet56 on the CIFAR-10 dataset described in the paper are set as default.
sh train.shWhen the above code is executed, the 2D-visualization results and vtp file for 3D rendering are saved in (./result) path
How to visualize a 3D loss surface by opening a vtp file via paraview is well described in the original repository.
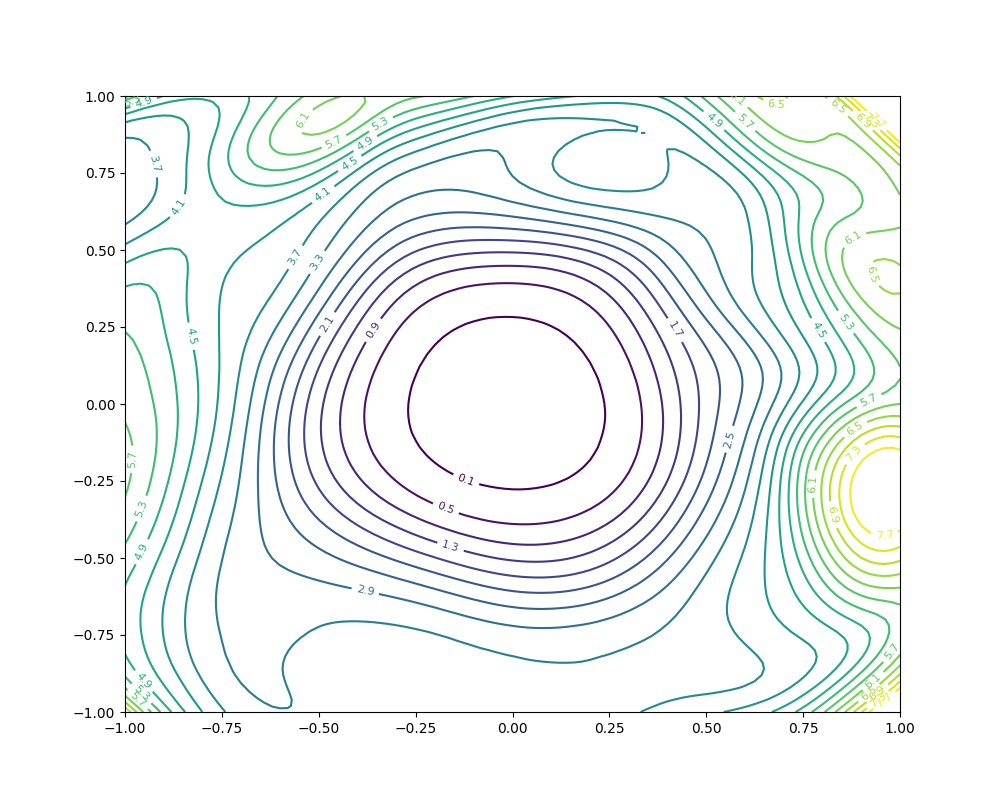
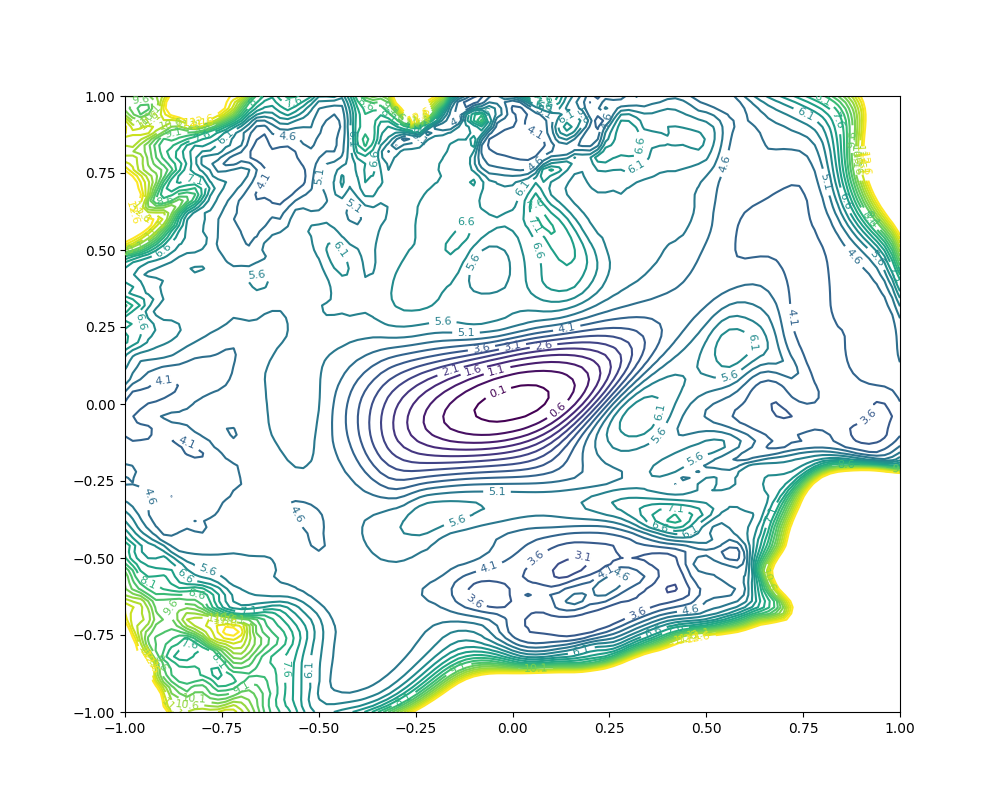
The following Contour Plots are 2D loss surfaces for ResNet56 and ResNet56-no short obtained with default configurations.
 |
Loss surface of ResNet56, Test error : 11.03% |
 |
Loss surface of ResNet56-NS, Test error : 18.09% |
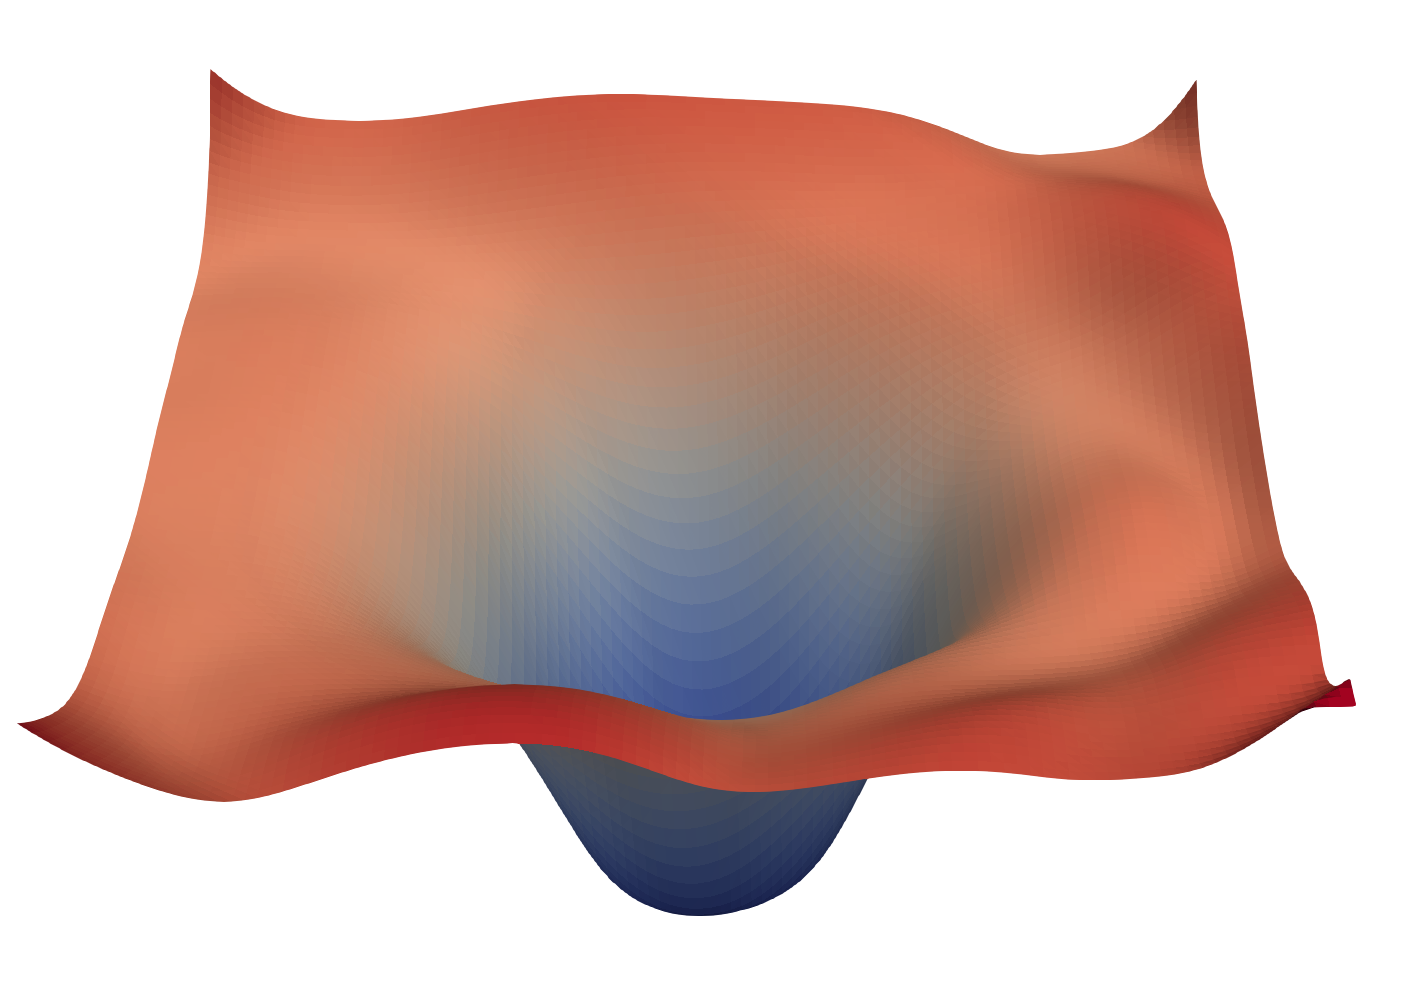
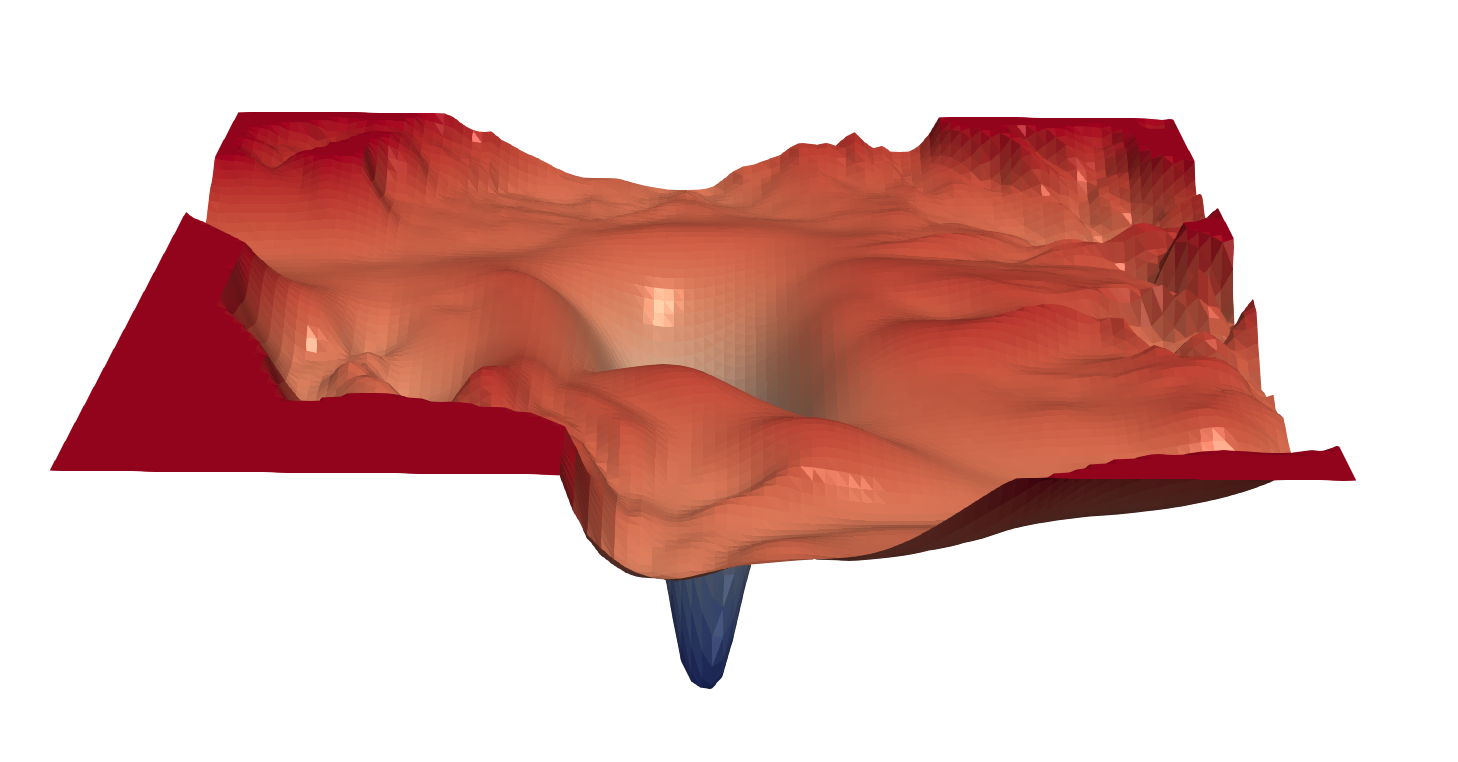
This is a 3D version of the same loss surface as above. If you set a high resolution, you can get visualization results similar to papers. (In the paper, 251 x 251, we have 51 x 51.)
 |
Loss surface of ResNet56, Test error : 11.03% |
 |
Loss surface of ResNet56-NS, Test error : 18.09% |