Link : https://caswellorr.github.io/Cryptocurrency-Dashboard/
The CryptoCurrency Dashboard web application allows a user to search a crypto coin (by its abbreviation) in the search bar and see a candlestick graph that displays the market price changes from the past 10 days.
The user may also view a marquee of the top cryptocurrencies and read a news article or two below the graph.
This application uses two cryptocurrency APIs:
The first API fetches data from Poloniex to be displayed on a candlestick graph.
The second API fetches news articles on cryptocurrency from a news API.
-
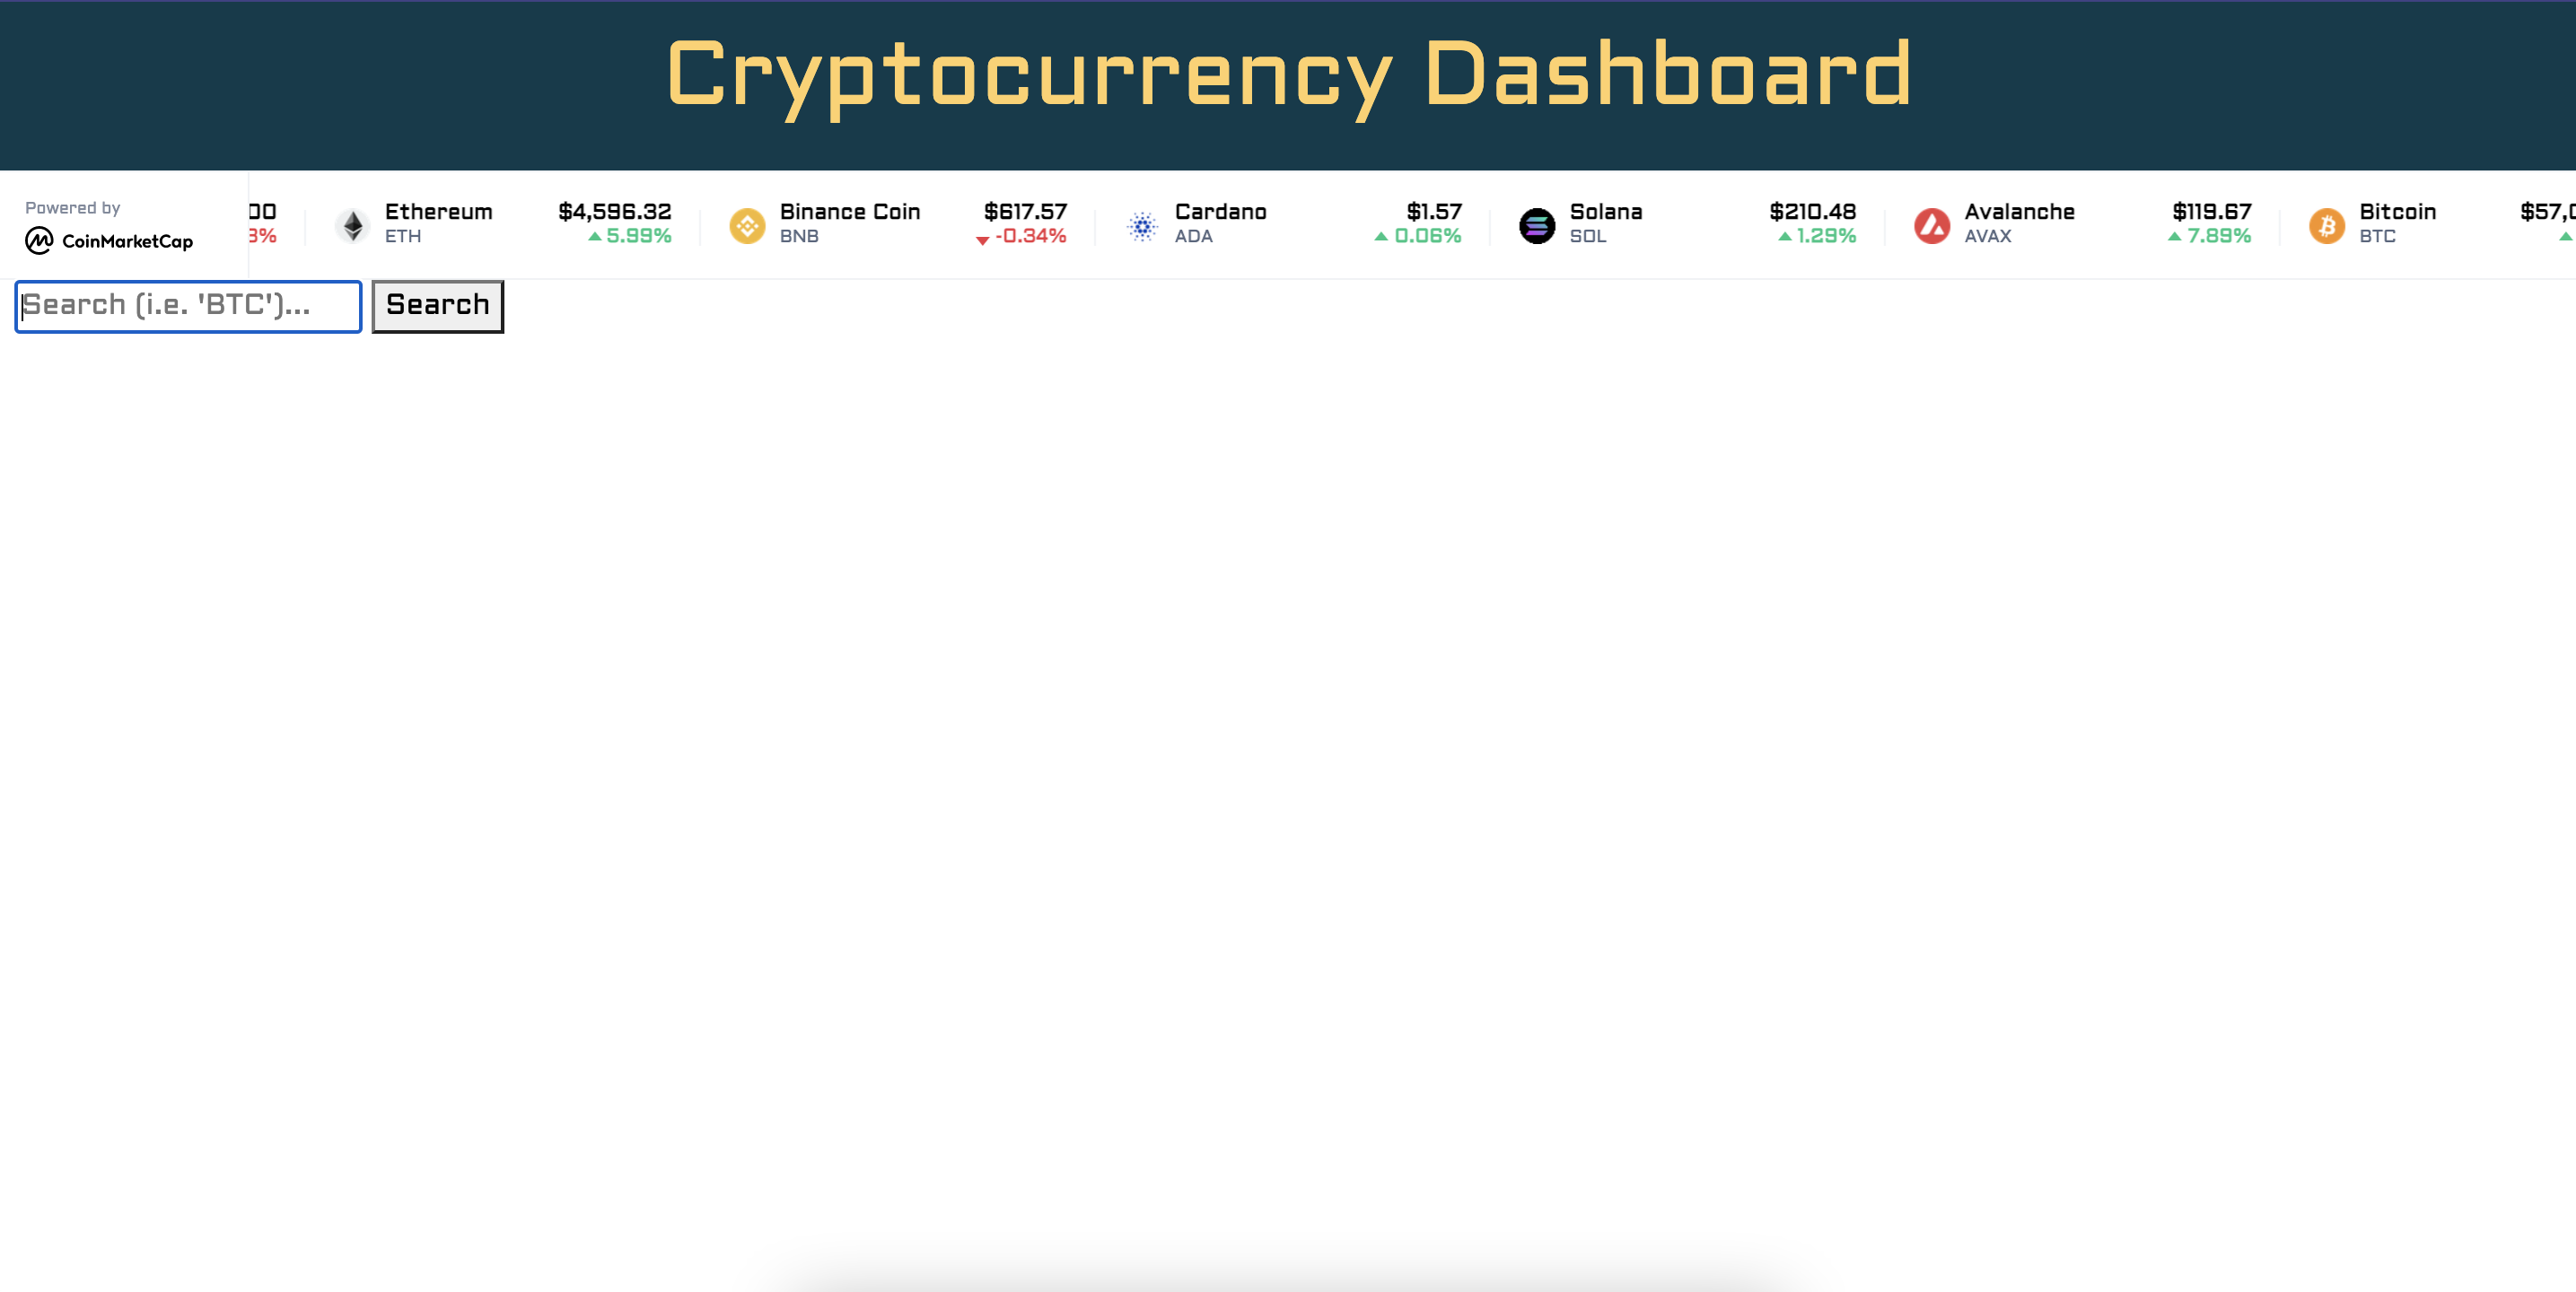
When first opening the dashboard, it should look like this:
-
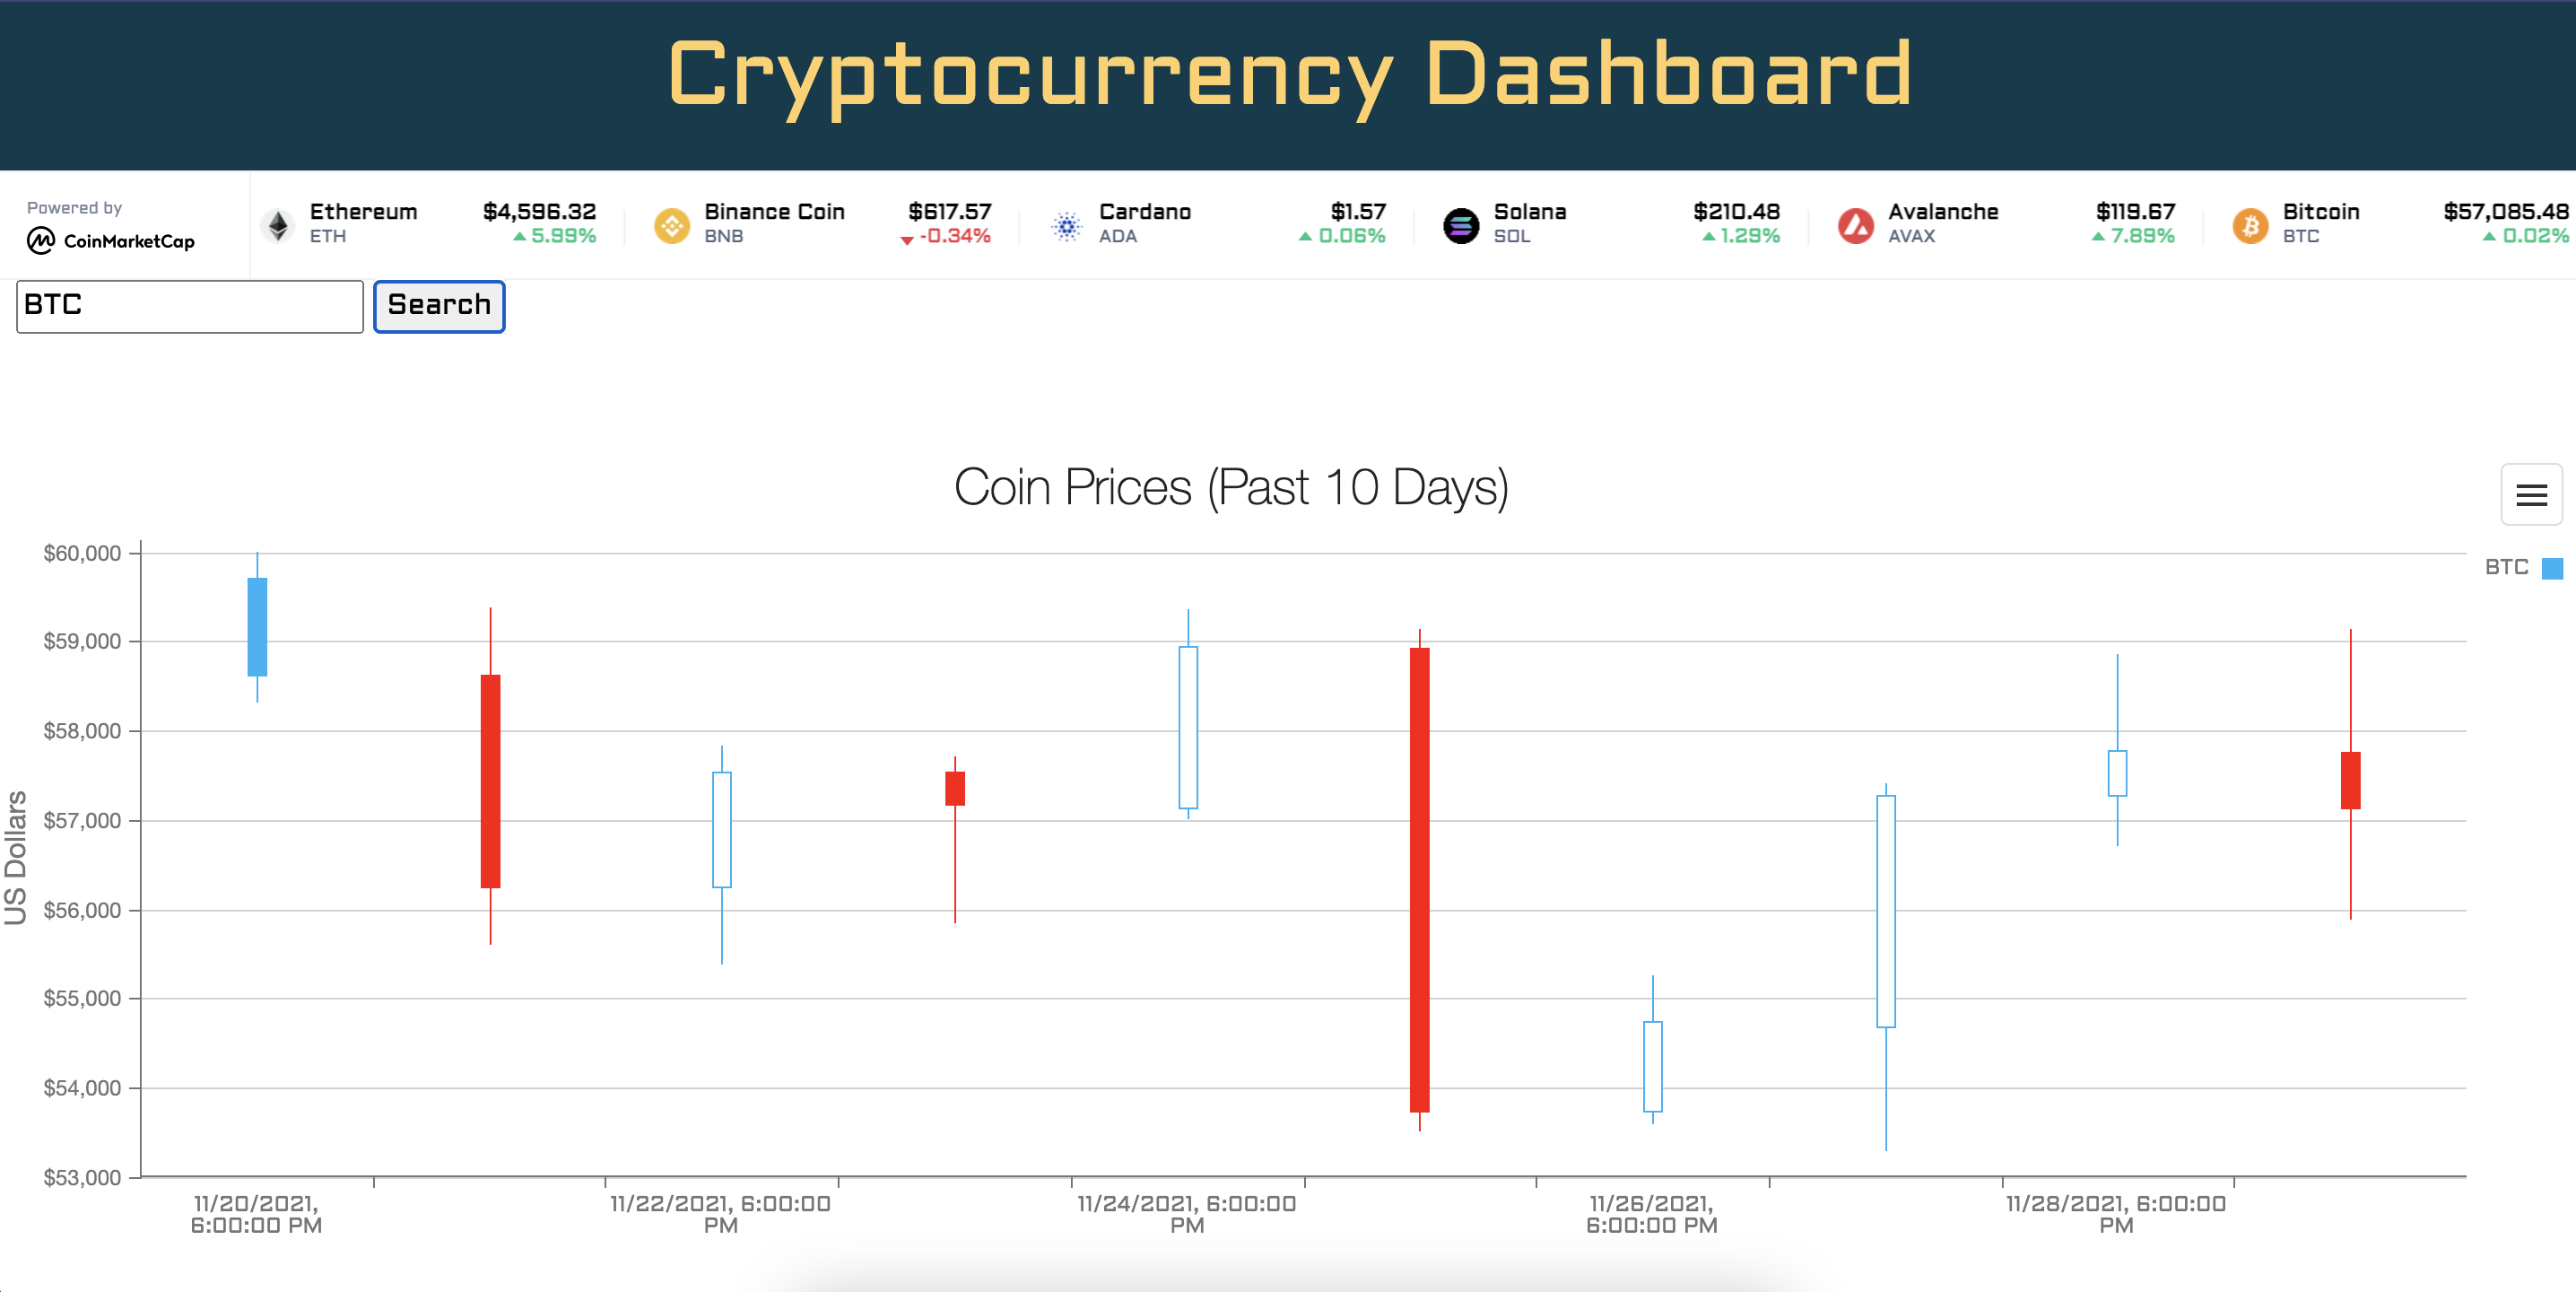
After searching a coin, the dashboard should display a graph like this:
-
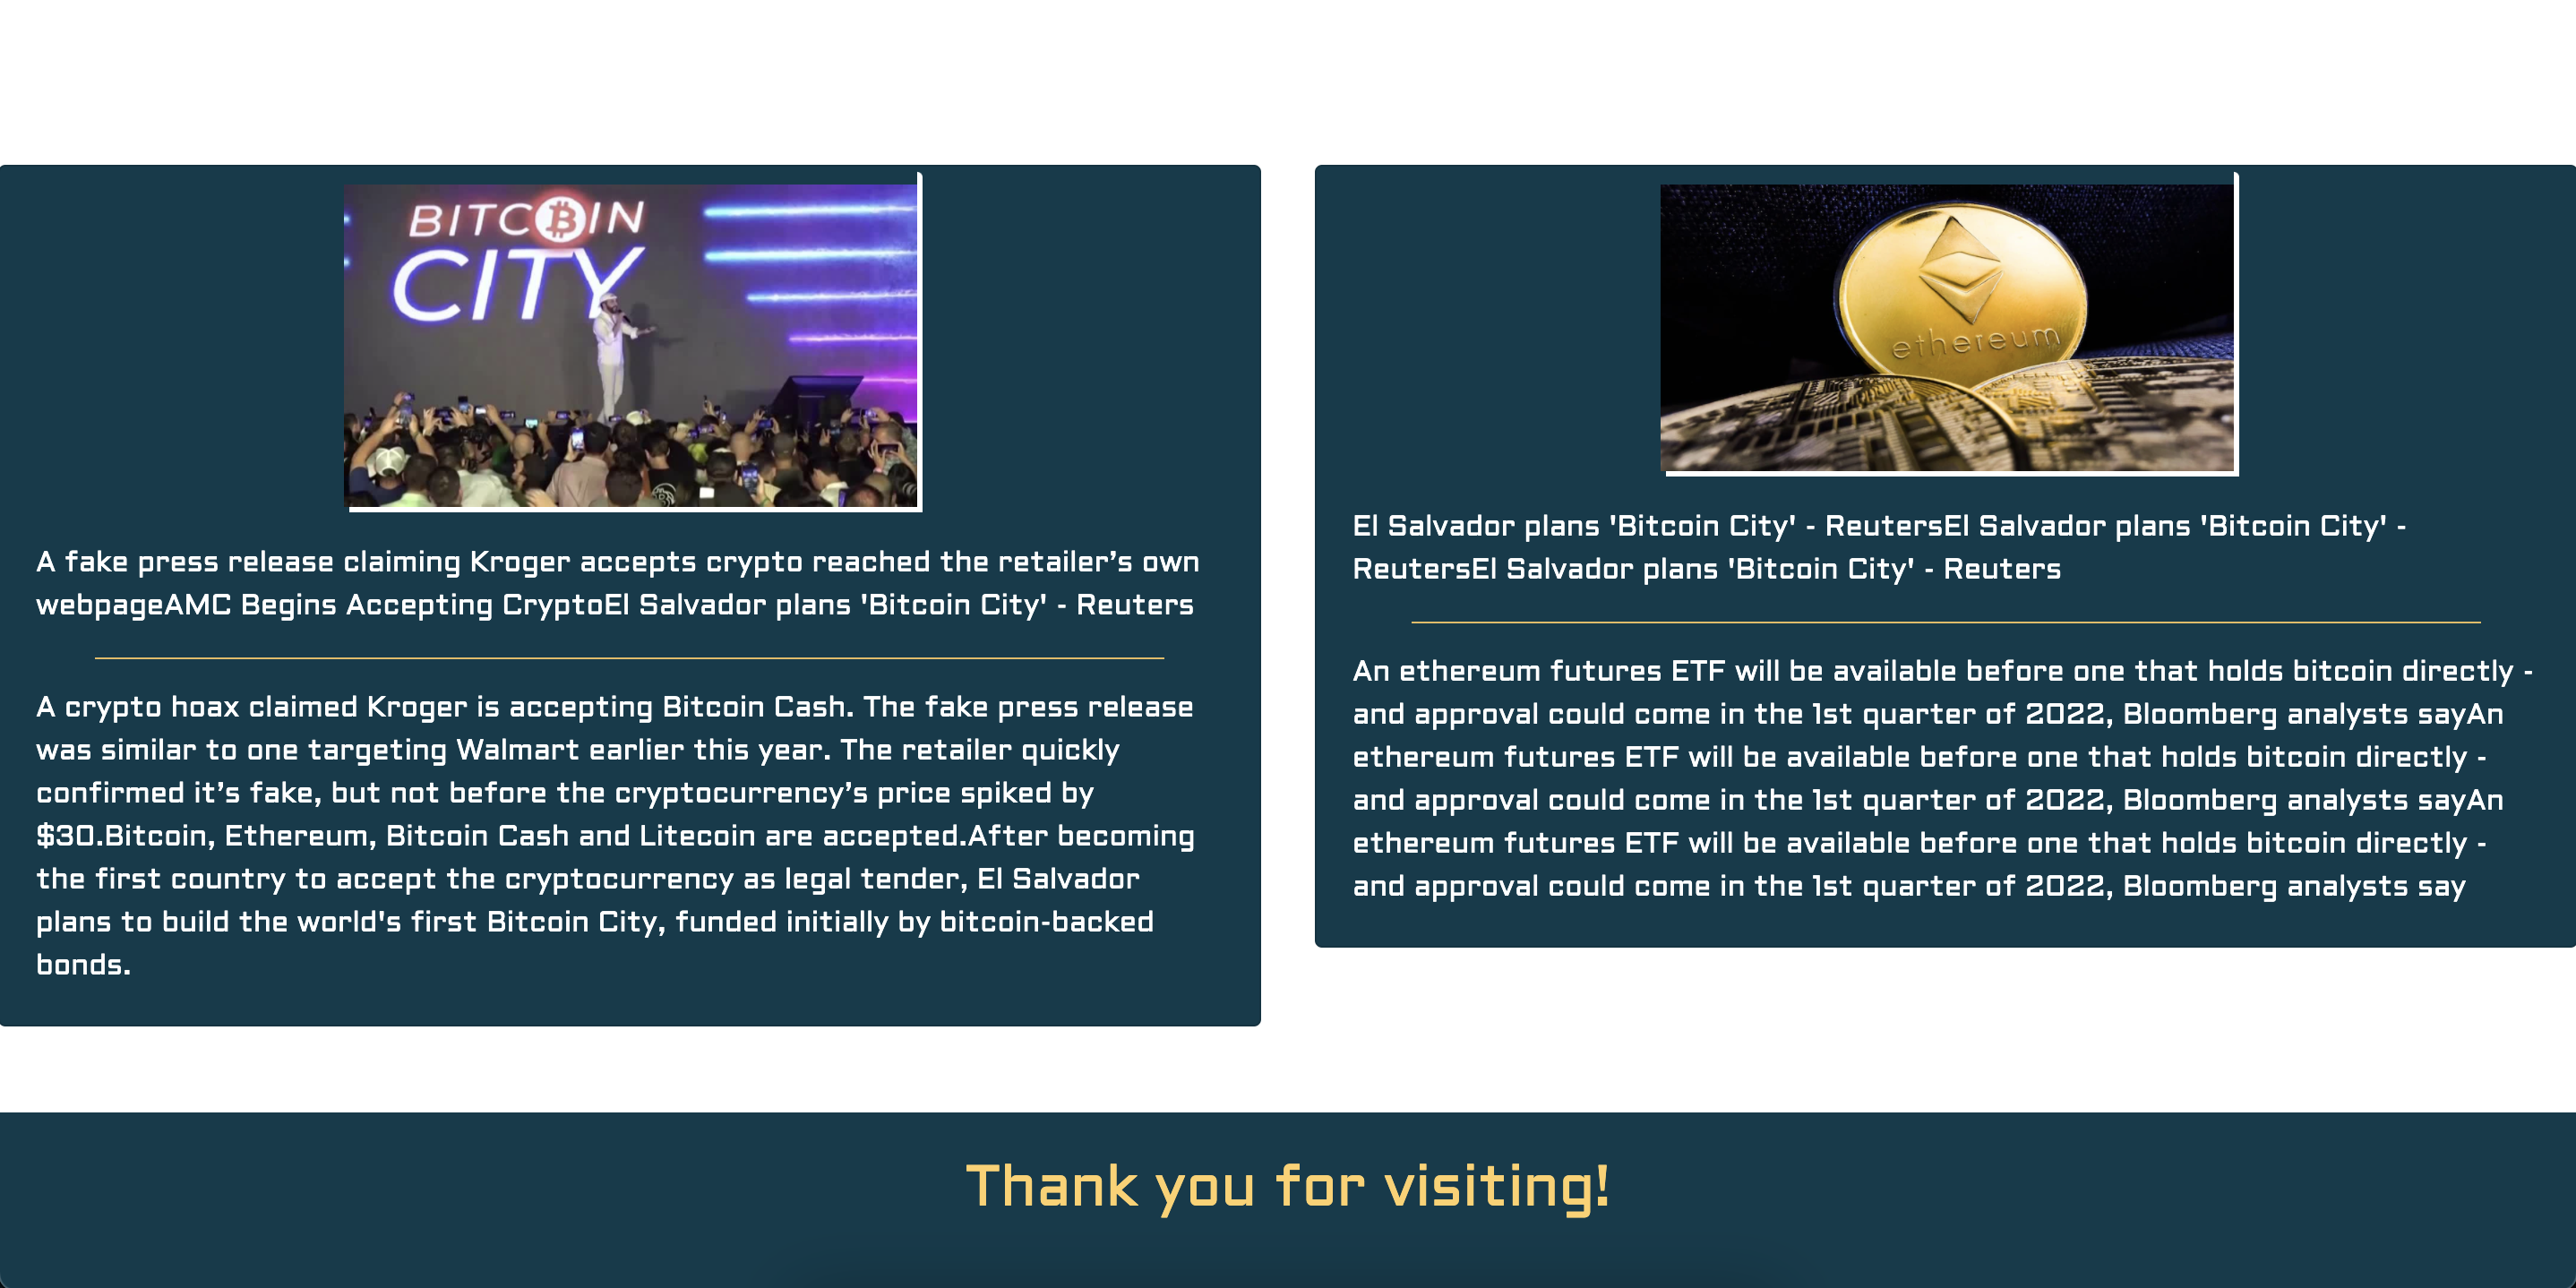
If the user scrolls down, the user should see the articles displayed like this:


We learned how to manipulate data fetched from an API to fit into our vision of a cryptocurrency dashboard: A graph and news articles.
Perhaps we will link the graph and news APIs by connecting them both to the search bar. That way the coin that is searched will display on the graph while the news API displays news articles specific to what is searched as well.
© 2021 Brian Turner, Luis Santiago, Caswell Orr. Confidential and Proprietary. All Rights Reserved.