The project is no longer maintained. Some files are not able to fetch from source due to some reaseons
Is it feasible for you to estimate the standard of living or energy consumption of a site based night-time satellite imagery? This means whether we can do the satellite imagery processing for socioeconomic analysis?
Let's find out in this project!!!
- Download satellite night lights images from NOAA
- Download DHS data for Rwanda
- Test whether night lights data can predict wealth, as observed in DHS
- Download daytime satellite imagery from Google Maps
- Test whether basic features of daytime imagery can predict wealth
- Extract features from daytime imagery using deep learning libraries
- Replicate final model and results of Jean et al (2016)
- Construct maps showing the predicted distribution of wealth in Rwanda

- RESULT:
F182010.v4d_web.stable_lights.avg_vis.tif: Single image file giving nightlights intensity around the world
Go to the DMSP-OLS website and download the satellite nighttime luminosity data (roughly 400MB). Here we are using the file F182010.v4d_web.stable_lights.avg_vis.tif.
- FILE INPUT:
rwanda_clusters_location.csv: Coordinates of the centroid of each cluster
- RESULT:
rwanda_cluster_avg_asset_2010.csv: Comma-delimited file indicated average wealth of each cluster
Demographic and Health Surveys (DHS) are nationally-representative household surveys that provide data for a wide range of monitoring and impact evaluation indicators in the areas of population, health, and nutrition. For this assignment, you will need to download the 2010 Rwandan DHS data. This requires registration Do not forget to request for the GPS dataset.
The immediate goal is to take the raw survey data, covering 12,540 households, and compute the average household wealth for each survey cluster (think of a cluster as a village). Refer to the file Recode6_DHS_22March2013_DHSG4.pdf for information on these data.
Saved output is rwanda_cluster_avg_asset_2010.csv.
NOTES:
Household Recodecontains all the attributes of each household. It provides datasets with different formats. We useRWHR61FL.DATfile in Flat ASCII data (.dat) format.RWHR61FL.DCFdescribes the attributes and the location of each attribute.- Geographic Datasets:
rwge61fl.zipcontains the location of each cluster in Rwanda. It is in the format of shapefile, which needs QGIS or other GIS softwares to open. For those who are not familiar with GIS tools or who want a shortcut, you can also sue the filerwanda_clusters_location.csvprovided.
the cluster locations, overlaid on the nightlights data, are shown in the figure below.

- INPUT:
F182010.v4d_web.stable_lights.avg_vis.tif: Nightlights data, from Step 1rwanda_cluster_avg_asset_2010.csv: DHS cluster averages, from Step 2- OUTPUT: Merged datasets
DHS_nightlights.csv: Merged dataset with 492 rows, and 6 columns (one indicates average cluster wealth, 5 nightlights features)- Scatterplot of nightlights vs. DHS wealth
NOTES:
- The resolution of each pixel in the nightlight image is about 1km. Use 10 pixels X 10 pixels to average the luminosity of each cluster.
- Start by just taking the Mean of the luminosity in the 100 pixels and comparing this to cluster average wealth. I also compute other luminosity characteristics of each cluster, such as the Max, Min, Standard Deviation of the 100 pixel values, but this step is not required. Note that the file we provide (
DHS_nightlights.csv) has these added features. - To read the raw raster (nightlights) files, we recommend using the GDAL library. Use
conda install gdalto install the GDAL library.

- INPUT:
- Google Maps API key
Sector_Boundary_2012.shp: Rwandan shapefile- OUTPUT:
- Thousands of satellite images (store in directory
google_image/)
We will use the Google Static Maps API to download satellite images. Refer Google Static Maps introduction and Google Static Maps API Usage Limits. You must apply for an API key before downloading.
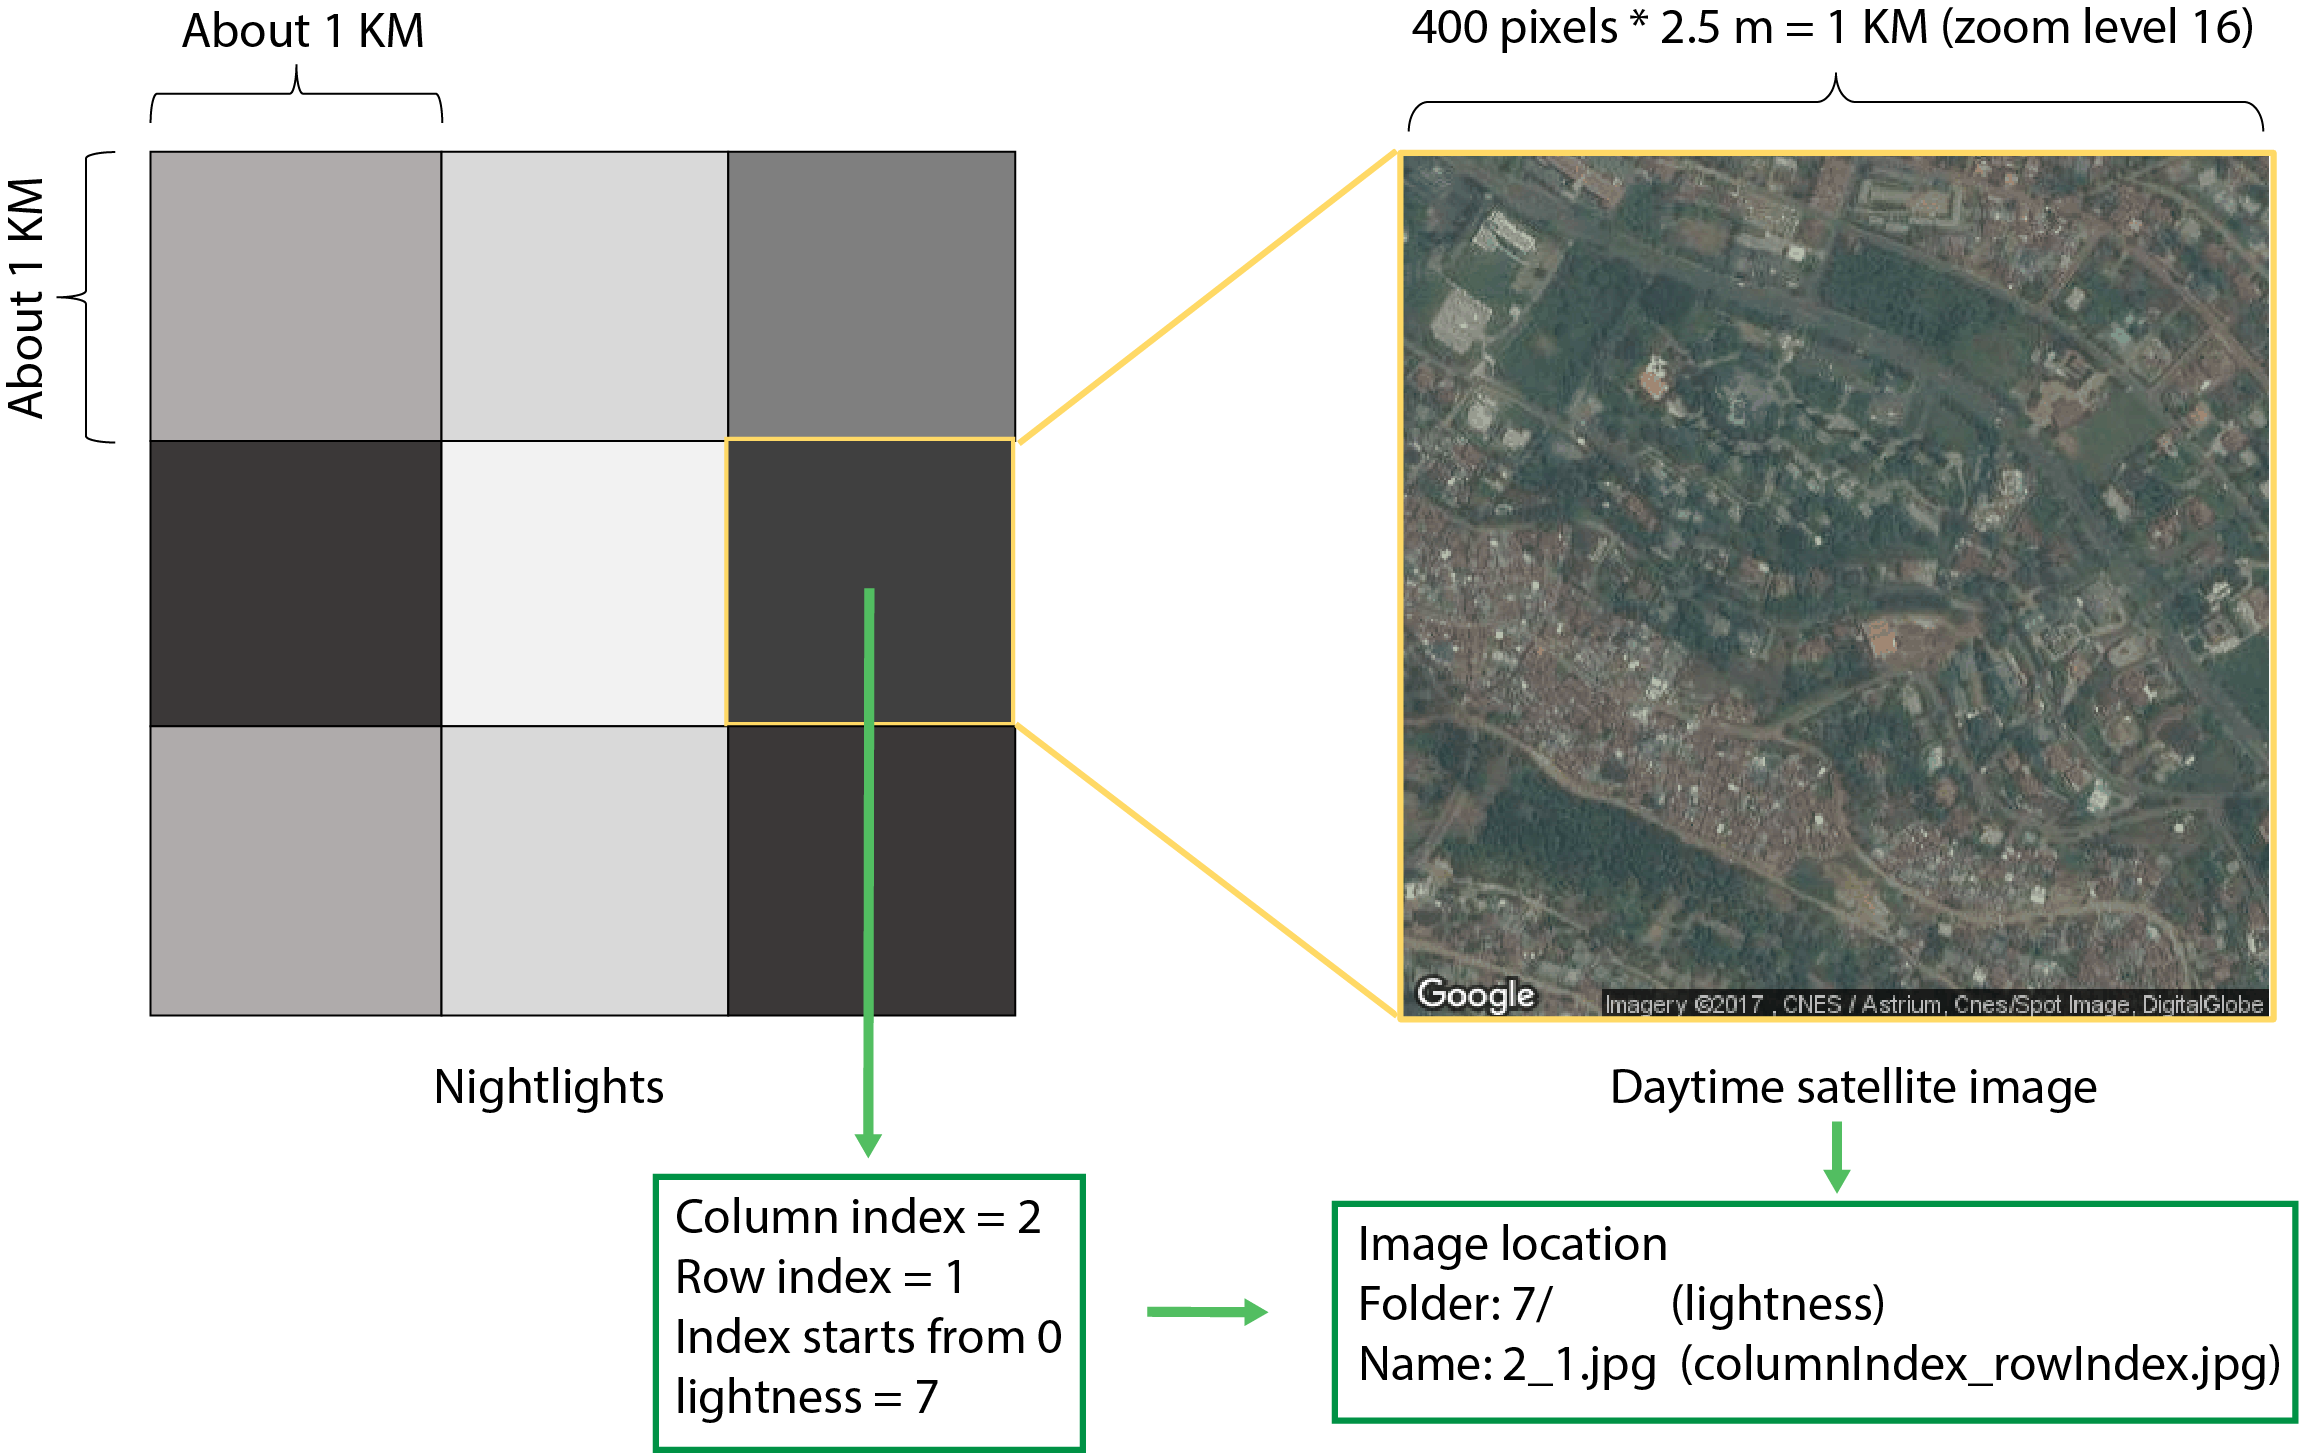
Download the images from Google at zoom level 16 (pixel resolution is about 2.5m). Set the image size to be 400 pixels X 400 pixels, so that each image you download will cover 1 square kilometer. In this way, each daytime image you download will correspond to a single pixel from the nighttime imagery from Step 1 above.
NOTES:
- You will need to tell Google the locations for which you wish to download images. One way to do this is to use a shapefiles that specifies the borders of Rwanda. We have provided this shapefile (
Sector_Boundary_2012.shp) as well as a helper function to read in the shapefile. - The function we provide below does not limit the maximum number of images downloaded per day. Note that if you attempt to download more than the daily limit, Google will return blank images instead of an error.
- You can organize the files however you like. However, for later analysis (Steps 6 and beyond), it may help if you organize these daytime images into 64 folders, with one folder indicating the nightlight intensity of the pixel corresponding to the daytime image. In other words, if you download a daytime image for which the corresponding nighttime pixel has value 32, store that daytime image in a folder labeled '32'. This way, all the satellite images within each folder will have the same nightlight intensity. The file name is columnIndex_rowIndex.jpg, in which row index and column index are the index in the nightlight image (See the diagram below).

- INPUT:
- Model, image features (data/model/features_all_predictimage_location.csv)
- OUTPUT:
- Map ('poverty_mapping.tiff')
Use this model to calculate the predicted wealth of every one of your original images. Create a heatmap showing the distribution of predicted wealth in Rwanda.
