
ServiceNow is a cloud based enterprise tool to manage services. It offers a vast many templates for various services and has many good features. I don’t want to discuss the features here, but, would wish to highlight a possibility that we could crack in one of our project related works. I am overwhelmed to share this story, as it gave the nerve of challenge, which I liked.
I work for an engineering team that creates automated solutions to the SQL Server database management. One of our latest work was to create a workflow for automated SQL Server Database patching. Our plan was to make this available as a subscription service, similar to any magazine subscription. So, the owners of the databases can subscribe their servers for patching on some predefined schedules. For all this, we wanted to leverage ServiceNow as its used by everybody and many other teams offer services through this channel.
One of the important components of this project was to provide report functionality that gives a visual scene of entire infrastructure patch status from service providers(Us) perspective, or the Infrastructure owners’ perspective. Our workflow that we defined in ServiceNow, used our own SQL Server database instance, to capture the meta data about the patch details, subscriptions, schedules etc.. The reporting feature will thus have to use the data available on the foreign data source, SQL Server database in our instance. This was a crucial element and that offered a hard block, as I mentioned before.
ServiceNow, as a tool, is fantastic and offers a lot many features. It has builtin family of reporting options that are awesome in their collection. However, it wasn’t flexible for us. I wanted to report over the SQL Server data. The reporting on the ServiceNow had options to choose a data source from either a table that is internal to ServiceNow or an excel/csv import. Both the options were very week deciders for us to leverage this functionality. In our research, we could find there was an option to import external data from other database sources. However, this data should be copied to ServiceNow instance and maintained for the reporting. Its mostly stale or old data, as it will be on certain schedules that you could import. We wanted a more straight functionality that provided right in time data from SQL database on ServiceNow while the reports are rendered. Being just a user of Servicenow, not knowing what the tool had to offer, it was a tough task to decide and get this thing to work.
As the order of the world defines Faith, Keep the faith. The most amazing things in life tend to happen right at the moment you’re about to give up hope. It works as a magic. We discovered that the ServiceNow had an option to create Pages as Service Portal Pages, which can be customized by adding widgets.

So, two main components that helped us are Service Portal Pages and Widgets. Lets see how it can be achieved now.
ServiceNow Pages (Service Portal Pages): ServiceNow has a component called Pages. They can be created from Service Portal Configuration link.
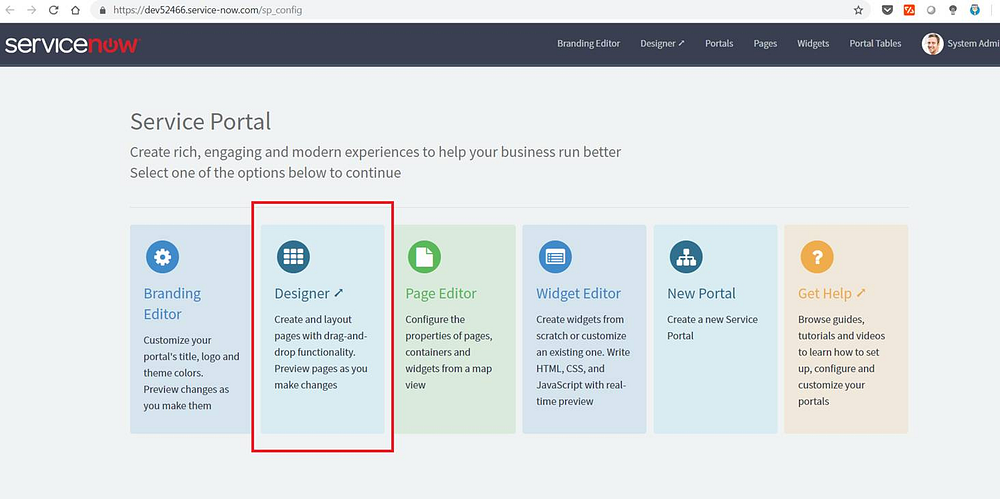
On home page of servicenow, search for Service Portal, and select Service Portal Configuration as shown below.

This opens another page in a new tab, and has below options. Select Designer.
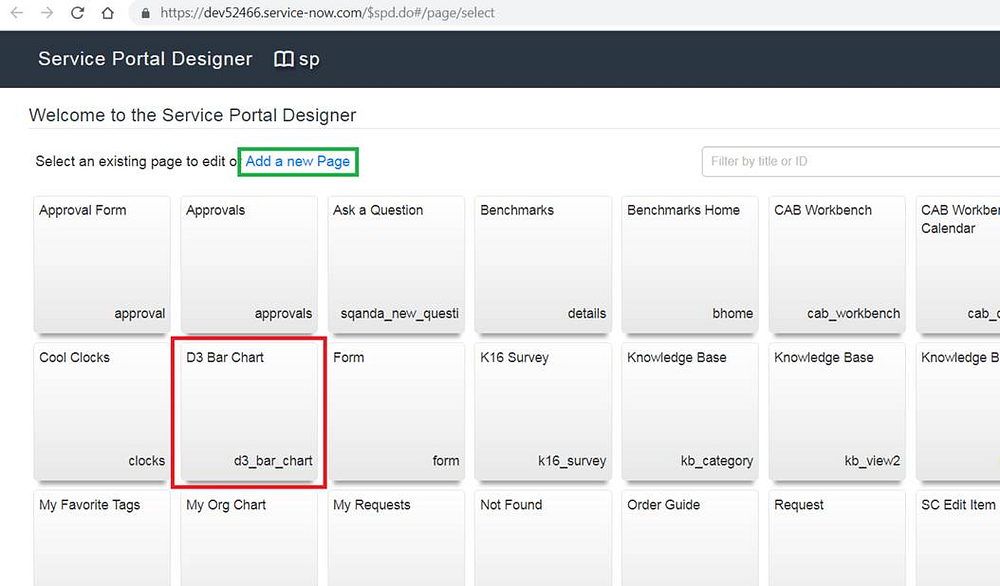
The designer lists all available pages on the Service Portal as below. I already have the page created and its listed below. Else, there is a link to create a new page Add a new page.
A new tab opens up the page designer as below. There is an empty canvas and some containers and widgets to the left that could be dragged into from the left. I have 2 containers and 1 column of size 12 in each.

We will have to create the widgets now that can display the reports for us by dragging them to the page above. However, our SQL Server database should be exposed so that we can use the data to plot.
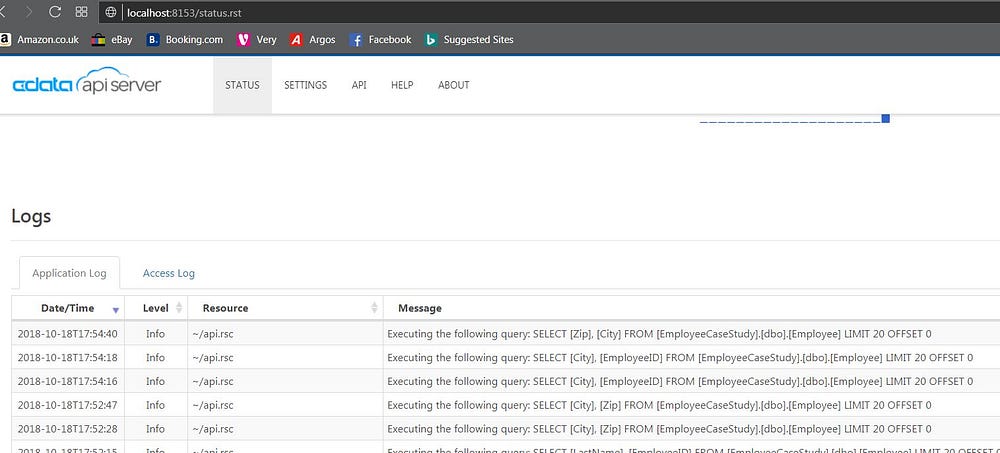
To expose SQL Server for servicenow to use the data, I chose to create an API that pointed to my database. I could achieve this, by a ready API Server, CData. You can download it from here. Its straight forward to use and setup. To configure the Database connectivity, you can check the article here. After doing this, I ensured that the GET API calls work. Once we are ready with API, we can start to create our ServiceNow widgets.
I could create widgets searching for that option under service portal. I created a new Widget by selecting New.

A widget has following options: Name, Access Control, HTML, CSS, Client Script, Server Scripts. Also, we will have to define dependencies of the Javascript libraries (have added d3js as a dependency).
Since we are creating 2 widgets, we will have to create 2 new widgets. I have named them D3 Bar Chart, which creates report on hard-coded data, and another with the name D3_db_bar.

Below, I have added d3.js as a dependency to the widget. Also, there is a link to the widget designer.

The below snippet is for the widget D3_db_bar opened in the widget designer, showing the HTML, CSS and Client Scripts.
HTML is to render drop downs for second report
CSS is a simple style definition
Client Script is the Javascript that uses d3 library to render a bar chart

Once the widget is ready, save it.
We can search for the widget on search bar to the top left on page designer, in the 4th image, drag and drop them into the 12 inch columns in respective containers.

We are ready to review the page now. You can try Preview in the green highlighted link in the above picture. You can see the static bar chart rendered already. The dynamic chart that calls Database hasn’t been rendered yet.
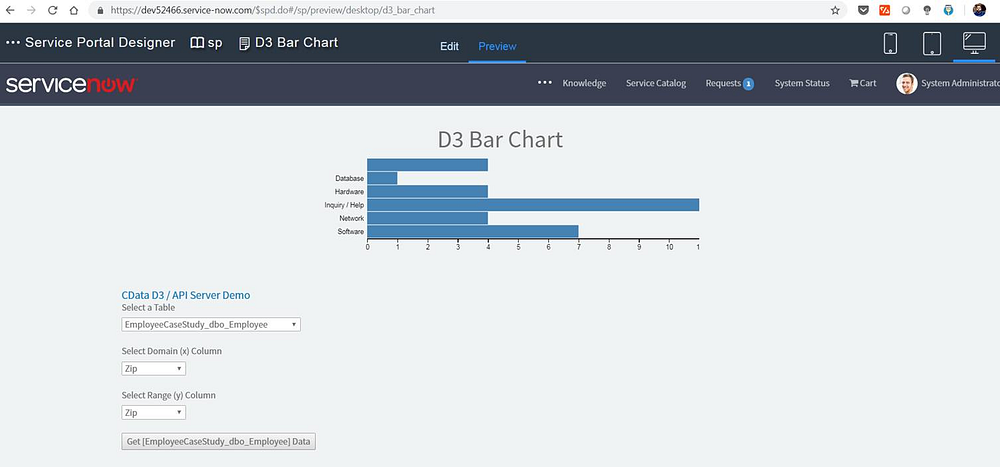
On the button click, the bar chart is rendered.

Also, The pages can be directly accessed using the URL. In this case, it was https://dev52466.service-now.com/cab/?id=d3_bar_chart. Where, d3_bar_chart, is the page name, and dev52466.service-now.com represents my instance.
This is all, a feet that opened up possibilities to generate reports on ServiceNow. As you might already know, D3 is a popular visualization library, and has awesome charts for usage.
Please let me know if you liked it or not and do provide any feedback that you might have.