A lock-free, real-time flight recorder for your C or C++ programs
- Records information about your program continuously while it's
running using simple
printf-like statements - Classify recorded data in different categories to preserve both old important events and recent, rapidly-firing events
- Dump recorded data on demand, notably in response to signals or from debugger
- Can trace specific categories of records, i.e. print them as they happen
- Can export specific data to shared memory channels for external visualization
- A simple Qt5.9-based visualization tool shows content of data channels in real-time

The flight recorder is designed to help you debug complex, real-time,
multi-CPU programs. It lets you instrument their execution with
non-intrusive printf-like record statements, that capture what is
happening in your program. Here is what a RECORD statement looks like:
RECORD(main, "Program %s started with %d arguments", argv[0], argc);
In that example, main is the name of the recorder holding the
data. We can declare it to hold 32 entries with a declaration like:
RECORDER(main, 32, "This is 'main', used in the example above");
These RECORD statements are very inexpensive (less than 0.1
microsecond on a modern PC), so you can leave them in your code all
the time, even for optimized code. See Performance considerations at
end of this document for details.
The RECORD can also be written in lowercase, as record, if you
don't want macros standing out in your regular code. Having two
spellings makes it possible to #undef either RECORD or record in
case of conflict with existing names in your source code.
record(main, "Program %s started with %d arguments", argv[0], argc);
When something bad happens or from within a debugger, you can
dump the recorder by calling the recorder_dump() function. This
gives you a very detailed account of recent events, helping you figure
out how you came there. The recorder dump also contains highly
detailed ordering and timing information, which can be very precious
in multi-CPU systems.
Multiple recorders can be active simultaneously, for example to capture events from different subsystems. When a recorder dump occurs, events from different recorders are sorted so that you get a picture of how the systems interacted. Different recorders can have different size and different refresh rates, but a very fast recorder will not push away data from a slower one. This ensures that you can record important, but slow, events, as well as much more frequent ones.
Here is what a recorder dump can look like (lines omitted for brevity):
recorder.c:518: [0 0.000000] signals: Activating dump for signal mask 0xE3001C58
recorder_test.c:126: [1 0.000008] MAIN: Launching 16 normal recorder threads
recorder_test.c:128: [2 0.000045] MAIN: Starting normal speed test for 10s with 16 threads
recorder_test.c:137: [2392 0.000230] MAIN: Normal recorder testing in progress, please wait about 10s
recorder_test.c:141: [198750457 9.999914] MAIN: Normal recorder testing completed, stopping threads
recorder_test.c:98: [198750757 9.999929] SpeedTest: [thread 3] Recording 12448096
recorder_test.c:98: [198750760 9.999955] SpeedTest: [thread 7] Recording 12527067
recorder_test.c:147: [198750785 9.999930] Pauses: Waiting for recorder threads to stop, 16 remaining
recorder_test.c:89: [198750787 9.999946] Pauses: Pausing #0 2401.618us
recorder_test.c:98: [198750789 10.000008] SpeedTest: [thread 11] Recording 12385726
recorder_test.c:98: [198750763 9.999929] SpeedTest: [thread 3] Recording 12448097
recorder_test.c:98: [198750788 9.999971] SpeedTest: [thread 12] Recording 12356775
recorder_test.c:98: [198750790 10.000029] SpeedTest: [thread 4] Recording 12412805
recorder_test.c:151: [198750791 10.003075] MAIN: Normal test: all threads have stopped, 198750784 iterations
recorder_test.c:165: [198750792 10.003117] MAIN: Recorder test complete (Normal version), 16 threads.
recorder_test.c:166: [198750793 10.003119] MAIN:   Iterations      =  198750784
recorder_test.c:167: [198750794 10.003121] MAIN:   Iterations / ms =      19875
recorder_test.c:169: [198750795 10.003122] MAIN:   Record cost     =         50ns
Lines begin with the source code location in the program where the
record was taken. This is optional, and is under control of a recorder
tweak called recorder_location. Another tweak, recorder_functions,
selects whether that location includes the function name.
The number following the source location is the order of records, a
global sequence number that helps relate records made in different
recorders or from different threads. The display of the order can be
configured using the recorder_order tweak.
The order is followed by a timestamp, which counds the number of
seconds since the start of the program. On 32-bit machines, the
timestamp is precise to the ms. On 64-bit machines, it is precise to
the microsecond. The time stamp can be displayed as absolute time
since midnight using the recorder_abstime tweak. The relative
time can be disabled by setting recorder_reltime tweak to 0.
With recorder_abstime=1 recorder_reltime=0, the recorder dump will
look as follows:
 [11 09:06:16.718056] recorder: Activating tweak 'recorder_abstime' (0x10cba0910)
 [12 09:06:16.718062] recorder: Activating 'MAIN' (0x10cb84148)
 [13 09:06:16.718062] recorder: Activating 'Pauses' (0x10cb851b8)
 [14 09:06:16.718063] recorder: Activating 'Special' (0x10cb89228)
 [15 09:06:16.718063] recorder: Activating 'SpeedTest' (0x10cb8a298)
Finally, the rest of the record is a printout of what was recorded.
The recorder dump is generally sorted according to order and should show time stamps in increasing order. However, as the example above shows, this may not always be the case. See Multithreading considerations below for an explanation of what this means.
See this blog article for a more extensive description of the design and rationale.
To build and test the recorder library on your system, type:
make test
This should build the library itself, which really consists of two
headers (recorder.h and recorder_ring.h) and corresponding C files
(recorder.c and recorder_ring.c). After building, it will run a
few simple tests that perform some operations and record what is
happening while they do so.
In order to add recorders to your own C project, you need to integrate four source files:
-
The
recorder.hfile is the header, which is designed to work for either C programs. That header relies on a supportingrecorder_ring.hheader to implement ring buffers. -
The
recorder.cfile is the implementation file, which provides support for C programs. Therecorder_ring.cfile implements functions implementing dynamic ring buffers.
To define recorders, you use RECORDER statements, which takes
three arguments: the name of the recorder, the number of entries to
keep, and a description. You can look at the hanoi_test.c file for
an example of use. This example defines for example a recorder called
MOVES with 1024 entries, declared as follows:
RECORDER(MOVES, 1024, "Moving pieces around")
It is also possible to declare recorders in a header file using the
RECORDER_DECLARE statement that takes the name of the recorder.
RECORDER_DECLARE(MOVES)
This makes it possible to share a recorder across multiple C source
files. In short, you would typically put RECORDER lines in C source
files, and RECORDER_DECLARE statements in C header files.
To record events in C, you use a printf-like RECORD statement,
which begins with the name of the recorder as declared with
RECORDER_DECLARE or defined with RECORDER. The RECORD statement
works mostly like printf, but takes a first argument specifying the
name of the recorder:
record(MOVES, "Move disk from %s to %s\n", name[left], name[right]);
The trailing \n in the format string is optional. At recorder dump
time, separate records will always be printed on separate lines.
While a RECORD behaves mostly like printf, there are important
caveats and limitations to be aware of, as well as interesting format string
extensions relative to printf. Notably:
-
The
%+sformat indicates a string that is safe to print even at dump time, for example a static string constant. -
You can define custom formats such as
%t. -
Putting a
>,<or=sign as the first character of the format string will indent, unindent or reset the indent. The character is not printed. This is useful to keep track of nested algorithms.
Each RECORD statement can have only up to 12 arguments.
Each individual record can store up to 4 arguments, but the RECORD
macro can generate 1, 2 or 3 recorder entries depending on the number
of arguments. If you need more, the changes to the code should be
somewhat straightforward.
You can pass integer values, floating-point values (limited to float
on 32-bit machines for size reasons), pointers or strings as RECORD
argument.
However, unlike printf, the rendering of the final message is done
at the time of the dump. This is not a problem for integer,
characters, pointer or floating-point values, but for strings (the
%s format of printf), this could cause a crash. Therefore, a
string is printed as a pointer at dump time, unless you add the +
modifier to the printf format, e.g. "%+s". If you know that the
string is a compiler constant, you can use this flag safely.
// OK if 0 <= i and i < 5, can use the '%+s' format
const char *array[5] = { "ONE", "TWO", "THREE", "FOUR", "FIVE" };
record(Main, "Looking at %+s", array[i]);

// Not OK because the value of the string has been freed at dump time
char *tempStr = strdup("Hello");
record(Main, "You will see a pointer at dump time here: %s", tempStr);
free(tempStr); // At dump time, the string no longer exists
Note that if tracing is enabled for a given recorder, the string will be printed. If the string is not valid at that time, a crash is possible during tracing.
The RECORD macro automatically converts floating point values
to uintptr_t based on their type, i.e. 32-bit or 64-bit floating-point.
The value of the current indent can be read using recorder_indent(), but only
during tracing or dumping. This can be useful if you want to indent the output
of your own extended tracing.
To dump recorded events, you use the recorder_dump function. This
dumps all the recorders:
recorder_dump();
This can be used in a number of situations, in particular from a
debugger. In gdb for example, you could run the following command to
dump the recorder during a debugging session:
p recorder_dump()
If you want to dump specific recorders, you can use
recorder_dump_for, which matches the recorder names against the
regular expression given as an argument:
recorder_dump_for(".*TIMING.*"); // Dumps "TIMING", but also "MY_TIMING_2"
During a dump, events are sorted according to the global event order. Note that sorting only happens across recorders. Within a single recorder, events may be out of order, see Multithreading considerations below.
The function recorder_background_dump(pattern) launches a background
thread that dumps the recorders selected by pattern at regular
interval. The sleep time in milliseconds between recorder dumps is
configured by a recorder tweak named recorder_dump_sleep, which
defaults to 100 ms. The background dump can be stopped by calling the
recorder_background_stop function.
Recorder output normally goes to standard error stderr, although it
is possible to redirect the output using one of the following methods:
-
By using the
@outputcommand, for example from theRECORDER_TRACESenvironment variable if your applciation supports it, -
By passing a
FILE *torecorder_configure_outputin your application, -
By replacing the output function entirely using
recorder_configure_show, in which case this function is free to interpret the recorder output pointer in any way you wish. Note that doing so disables the@outputcommand.
The recorder output can be configured with a number of tweaks, including:
- Set
recorder_locationto show the location in the source code (file, line) - Set
recorder_functionto show the name of the function - Set
recorder_orderto show the order of each recorder entry - Set
recorder_abstimeto show the absolute time since start of program - Set
recorder_reltimeto show the relative time between two entries - Set
recorder_indentto the maximum indent to use when dumping the recorder
In some cases, it is useful to print specific information as you go instead of after the fact. In this flight recorder, this is called tracing, and can be enabled for each recorder individually.
When tracing for a given recorder is enabled, the trace entries for
that recorder are dumped immediately after being recorded. They are
still stored in the flight recorder for later replay by
recorder_dump.
Tracing can be activated by the recorder_trace_set function, which
takes a string specifying which traces to activate. The specification
is a colon or space separated list of trace settings, each of them
specifying a regular expression to match recorder names, optionally
followed by an = sign and a numerical value.
If no numerical value is given, then the value 1 is assumed by default, which
enables tracing. If the trace name begins with -, then the value 0 is
assumed by default, which disables tracing, but preserves recording.
If the trace name begins wiht /, then the value -1 is assumed by default,
which disables even recording.
For example, the trace specification foo:bar=0:b[a-z]z.*=3:-glop sets the
recorder trace for foo to value 1 (enabling tracing for that recorder), sets
the recorder trace for bar and glop to 0, and sets all recorders with a
name matching regular expression b[a-z]z.* to value 3, for example boz and
bbz.
The following names in a trace specification denote command which perform specific actions.
-
The
listandhelpcommands will print the list of available recorders onstderr. -
The
allvalue will be turned into the catch-all.*regular expression. -
The
outputcommand will select a file as output for the recorder, and theoutput_appendvariant will append to the given file. For example, you can write to/my/fileusingoutput=/my/file. -
The
sharevalue can be used to set the file name used for sharing information in real-time between a recorder appplication and an application using that data. Note that another way to achieve the same objective is to use theRECORDER_SHAREenvironment variable. -
THe
dumpcommand causes a recorder dump. This is mostly useful over a remote control session, seerecorder_scopebelow.
If the name of a command conflicts with the name of a recorder, the
recorder will be selected, and you can force the selection of the
command by prefixing it with @. For example, if a recorder is called
output, you can still output to a file with @output=/my/file.
If your application calls recorder_dump_on_common_signals (see below),
then traces will be activated or deactivated according to the
RECORDER_TRACES environment variable, and background dump can be
activated according to the RECORDER_DUMP environment variable.
Your application can define traces from another application-specific environment variable with code like:
recorder_trace_set(getenv("MY_APP_TRACES"));
If the specification of the trace is non-numerical, then it defines a
comma-separated list of names of exported channels. Data from
exported channels is made available to an external application,
e.g. for real-time display using the recorder_scope application.
For example, consider the following RECORD statement, taken from the
recorder_test.c example:
record(SpeedInfo, "Iterations per millisecond: %lu (%f ns)",
       k - last_k, 1e6 / (k - last_k));
This RECORD statements stores two data elements in the SpeedInfo
recorder each time it is executed, a long unsigned value, and a
floating-point value.
It is then possible to cause to export two data channels holding the
values being recorded, under then names iter and duration, by
using a trace specification such as SpeedInfo=iter,duration. For
exampe, you could run the recorder_test program as follows (the
KEEP_RUNNING environment variable being used to keep the program
running for a long time):
export KEEP_RUNNING=1
export RECORDER_TRACES='SpeedInfo=iter,duration'
export RECORDER_SHARE=/tmp/recorder_share
./build/objects/linux/opt/recorder_test 1 1
The data is exported in file /tmp/recorder_share. Another program
can be used to display the data exported in that file in
real-time. The recorder_scope program in subdirectory scope is an
example of such a program. You would run it as follows:
export RECORDER_SHARE=/tmp/recorder_share
./recorder_scope iter duration
The result should be something like the picture below:

While multiple RECORD statements can write to the same recorder, if
you intend to export data to channels, the data being exported must
be positionally consistent between record statements, both in terms of
the data type (e.g. integer, floating-point) and in what it
represents. Otherwise, the graphs will not make sense. The data type
for the graphs is taken from the format string for the first RECORD
statement exporting data to that channel.
The RECORDER_TRACE(name) macro lets you test if the recorder trace
for name is activated. The associated value is an intptr_t.
Any non-zero value activates tracing for that recorder.
You may set the value for RECORDER_TRACE to any value that fits in
an intptr_t with recorder_trace_set. This can be used for example
to activate special, possibly expensive instrumentation.
For example, to measure the duration and average of a function over N iterations, you could use code like the following:
if (RECORDER_TRACE(foo_loops))
{
    intptr_t loops = RECORDER_TRACE(foo_loops);
    record(foo_loops, "Testing foo() duration");
    uintptr_t start = recorder_tick();
    double sum = 0.0;
    for (int i = 0; i < loops; i++)
        sum += foo();
    uintptr_t duration = recorder_tick() - start;
    record(foo_loops, "Average duration %.3f us, average value %f",
           1e6 * duration / RECORDER_HZ / loops,
           sum / loops);
}
While this is less-often useful, it is also possible to assign to a recorder trace value, for example:
RECORDER_TRACE(foo_loops) = 1000;
A given instrumentation or program behavior may require multiple
configurable options, or tweaks. The RECORDER_TWEAK_DEFINE defines
a tweak adn its initial value. The RECORDER_TWEAK macro accesses the
value of a tweak (at a cost comparable to accessing a global
variable).
RECORDER_TWEAK_DEFINE(foo_loop, 600, "Number of foo iterations");
for (int i = 0; i < RECORDER_TWEAK(foo_loops); i++) { foo(); }
Often, you may have your own custom data types in your program. The
flight recorder has provision for enabling specific format characters
to callback your own code for specific rendering. For example, if
you have a person structure defined as:
typedef struct person { const char *name; unsigned age; } person_t;
You can make it so that the 'P' character denotes a person pointer,
and render it as a 'person'. This would be done by adding a rendering
function of type recorder_type_fn for character P as follows:
recorder_configure_type('P', render_person);
where the function render_person could be defined as follows:
size_t render_person(intptr_t tracing,
                     const char *fmt, char *buf, size_t len, uintptr_t data)
{
    person_t *p = (person_t *) data;
    return tracing
        ? snprintf(buf, len, "person(%s,%u)", p->name, p->age)
        : snprintf(buf, len, "person(%p)", p);
}
Beware that this will overwrite any regular behaviour 'P' might have
in a printf format, so be careful to use characters that are either
unused by regular printf, or at least not used by your own program
(e.g. %v, %E).
The tracing flag contains the trace value for that recorder.
Like for strings, it may be safe to print more information during
tracing than at dump time, as shown in the example above. The lower
bit of the tracing flag will also be set if the + modifier was
passed in the format. So if you know that you are passing the address
of a global person_t variable, you may use the "%+P" format.
It is often desirable to dump the recorder when some specific signal is
received. To detect crashes, for example, you can dump the recorder
when receiving SIGBUS, SIGSEGV, SIGILL, SIGABRT, etc. To do
this, call the function record_dump_on_signal
recorder_dump_on_signal(SIGBUS);
When running BSD or macOS, you can have your program dump the current
state of the recorder by adding a signal handler for SIGINFO. You
can then dump the recorder at any time by pressing a key (typically
Control-T) in the terminal.
In order to dump the recorder on common signals, the call
recorder_dump_on_common_signals (0,0) will install handlers for the
following signals if they exist on the platform:
SIGQUITSIGILLSIGABRTSIGBUSSIGSEGVSIGSYSSIGXCPUSIGXFSZSIGINFOSIGUSR1SIGUSR2SIGSTKFLTSIGPWR
The two arguments are bitmask that you can use to add or remove
signals. For instance, if you want to get a recorder dump on SIGINT
but none on SIGSEGV or SIGBUS, you can use:
unsigned enable = 1U << SIGINT;
unsigned disable = (1U << SIGSEGV) | (1U << SIGBUS);
recorder_dump_on_common_signals(enable, disable);
The flight recorder RECORD statement is designed to cost so little
that you should be able to use it practically anywhere, and in
practically any context, including in signal handlers, interrupt
handlers, etc.
As shown in the data below, a RECORD call is faster than a
corresponding call tosnprintf, because text formatting is only done
at dump time. It is comparable to the cost of a best-case malloc
(directly from the free list), and faster than the cost of a typical
malloc (with random size).
Most of the cost is actually from keeping track of time, i.e. updating
the timestamp field. If you need to instrument the tightest loops in
your code, the RECORD_FAST variant can be about twice as fast by
reusing the last time that was recorded in that recorder.
The following figures can help you compare RECORD to
various low-cost operations. In all cases, the message being recorded
or printed was the same, "Speed test %u", i:
| Function | Xeon | Mac | Pi | Pi-2 |
|---|---|---|---|---|
record_fast |
20ns | 20ns | 129ns | 124ns |
record |
35ns | 64ns | 1070ns | 726ns |
gettimeofday |
16ns | 36ns | 913ns | 675ns |
memcpy (512 bytes) |
26ns | 15ns | 1669ns | 499ns |
malloc (512 bytes) |
40ns | 61ns | 603ns | 499ns |
snprintf |
64ns | 98ns | 2530ns | 1071ns |
fprintf |
64ns | 14ns | 4840ns | 2318ns |
Flushed fprintf |
751ns | 1334ns | 4509ns | 14730ns |
malloc (512-4K jigsaw) |
508ns | 483 | 3690ns | 5466ns |
| Hanoi 20 (printing piped to wc) | 320ms | 180ms | 19337ms | 7110ms |
| Hanoi 20 (recording) | 60ms | 60ms | 1203ms | 834ms |
| Hanoi 20 (fast recording) | 23ms | 24ms | 262ms | 175ms |
Scalability depending on number of threads
| Function | Xeon | Mac | Pi | Pi-2 |
|---|---|---|---|---|
record_fast * 1 |
20ns | 21ns | 137ns | 133ns |
record_fast * 2 |
92ns | 86ns | 137ns | 110ns |
record_fast * 4 |
94ns | 76ns | 137ns | 152ns |
record_fast * 8 |
57ns | 55ns | 137ns | 152ns |
record_fast * 16 |
52ns | 52ns | 137ns | 152ns |
record_fast * 32 |
52ns | 54ns | 137ns | 152ns |
record * 1 |
37ns | 60ns | 1315ns | 742ns |
record * 2 |
97ns | 93ns | 1076ns | 412ns |
record * 4 |
95ns | 71ns | 1080ns | 224ns |
record * 8 |
59ns | 54ns | 1083ns | 224ns |
record * 16 |
54ns | 50ns | 1084ns | 224ns |
record * 32 |
54ns | 53ns | 1372ns | 224ns |
The platforms that were tested are:
-
Xeon: a 6-CPU (12-thread) Intel(R) Xeon(R) CPU E5-1650 v4 @ 3.60GHz running Fedora 26 Linux kernel, GCC 7.1.1
-
Mac: a 4-CPU (8-thread) 2.5GHz Intel Core i7 MacBook Pro (15' Retina, mid 2015), Xcode 8.1.0 clang
-
Pi: First generation Raspberry Pi, ARMv6 CPU, running Raspbian Linux with kernel 4.4.50, GCC 4.9.2
-
Pi-2: Second generation Raspberry Pi, 4-way ARMv7 CPU, running Raspbian Linux with kernel 4.4.50, GCC 4.9.2
It is possible to disable even recording entirely by setting the trace value to
-1, or using the / prefix in a trace specification. When recording is
disable, the cost of the associated record entries has been measured to be
about 3ns on the Mac test platform.
The example of recorder dump given at the beginning of this document shows record entries that are printed out of order, and with non-monotonic time stamps.
Here is an example of non-monotonic timestamp (notice that time for thread 7 is ahead of time for thread 3 and thread 15):
recorder_test.c:98: [198750757 9.999929] SpeedTest: [thread 3] Recording 12448096
recorder_test.c:98: [198750760 9.999955] SpeedTest: [thread 7] Recording 12527067
recorder_test.c:98: [198750758 9.999929] SpeedTest: [thread 15] Recording 12379912
Here is an example of the entries being out of order (notice that the order ending in 80 is between those ending in 78 and 79):
recorder_test.c:98: [198750778 9.990261] SpeedTest: [thread 2] Recording 12374034
recorder_test.c:98: [198750780 9.999930] SpeedTest: [thread 8] Recording 12446849
recorder_test.c:98: [198750779 9.999930] SpeedTest: [thread 15] Recording 12379916
This is normal behaviour under heavy load, but requires an
explanation. The record statements can be performed simultaneously
from multiple threads. If there is "contention", i.e. if multiple CPUs
are attempting to write at the same time, one CPU may acquire its
order and timestamp before another CPU, but may end up writing the
record after that other CPU. The same thing may also happen if the
operating system suspends a thread while it is writing the record, in
which case a timestamp discrepancy of several milliseconds may appear
between nearby records.
In general, this should have a minimal impact on the understanding of what is happening, and may help you pinpoint risks of race condition in your code.
The recorder scope application, recorder_scope, shows real-time graphs
of selected record statements in your program.
The recorder_scope application is not built by default. In order to
build it, you need Qt5 and Qt5 Charts. You can then build it using
make scope from the top-level.
The recorder_scope application uses the recorder API to remotely access
a program being monitored. This communication happens over shared memory,
using a file specified in the RECORDER_SHARE environment variable.
That value needs to be the same for both the program being monitored and
the matching recorder_scope program. By default, the file name is
/tmp/recorder_share.
The recorder_scope application takes the following command-line arguments:
-
A channel-regexp to match exported channels. Each channel-regexp builds a new graph, and graphs show stacked in a single window. If you want multiple windows for the same channel, you can run multiple instances of
recorder_scope. -
-c configsends the given recorder configuration to the program being monitored. It is equivalent to adding the given configuration commands to theRECORDER_TRACESenvironment variable. -
-s name=init:min:maxcreates a slider with a value that can be set betweenminandmaxand starts atinit. This slider then sends configuration commands to thenametweak. This can be used to adjust parameters in the monitored program on the fly. -
-d delaysets the number of seconds that can be shown at once on screen. This is useful for example if the sampling rate for the events is not regular. -
-w samplessets the number of samples that can be displayed. The default is 0, which corresponds to the width of the window. Using a larger value makes it possible to show more data, but at the expense of performance and, in some cases, readability of the data. -
-ttoggles the display of a time graph for the following graphs. The time graph is an additional graph showing timing information about the event being recorded. It is drawn on a microseconds scale that shows on the right of the graph.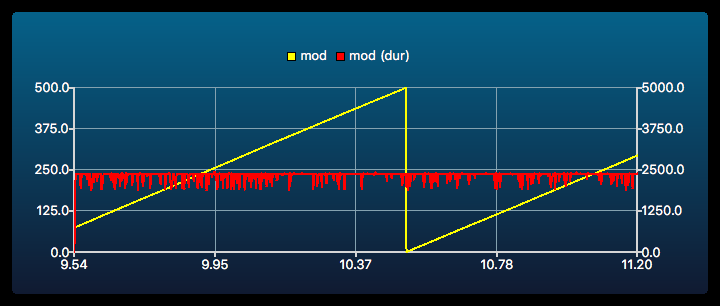
-
-mtoggles the display of a min/max values graph for the following graphs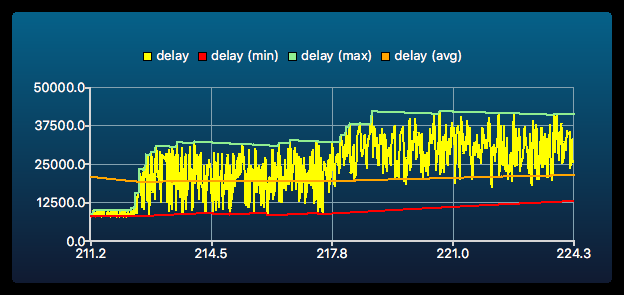
-
-atoggles the display of the average value for the following graphs -
-ntoggles the display of the normal value for the following graphs, which is useful if you want to remove it from display for clarity. -
-r ratiosets the rolling average ratio used for-mand-aoptions. It is a percentage, and should be set relatively high. The default is-r 99, which means that a new sample changes the average by 1% only. -
-s basenamesets the basename when saving data. The default isrecorder_scope_data-. Hitting theikey saves an image of the current graph (i.e. the graph with the focus). Hitting theckey saves a CSV file with the currently displayed values. Hitting the space bar saves both a file and CSV data. Files are numbered incrementally so as to not overwrite an existing file. When hitting the space bar, the same number will be used for both the image and CSV file. -
-g WxHsets the window geometry to WxH pixels. -
-g WxH@XxYsets the window geometry to WxH pixels and the window position to X,Y.


In the recorder scope window, hitting the t, a, n or m key
toggles the corresponding setting (timing, average, normal and min/max views).
For example, run the recorder_test program with:
RECORDER_TRACES='SpeedTest=tid,value,mod,delay' ./recorder_test_test 1 1000
THen run the recorder_scope with:
recorder_scope                      \
    -s sleep_time=0:0:100000        \
    -s sleep_time_delta=0:0:100000  \
    -t mod                          \
    -m -a -t delay
This will open a window that looks like the following:

You can then adjust the waiting time for the program being run
dynamically using the two sliders. They will update the values of the
two recorder tweaks defined in recorder_test.c as follows:
RECORDER_TWEAK_DEFINE(sleep_time, 0, "Sleep time between records");
RECORDER_TWEAK_DEFINE(sleep_time_delta, 0, "Variations in sleep time between records");
In that specific case, the tweaks adjust the wait time in the
following code in recorder_test.c:
if (RECORDER_TWEAK(sleep_time)) { struct timespec tm; uint64_t wait_time = (uint64_t) (RECORDER_TWEAK(sleep_time) + drand48()*RECORDER_TWEAK(sleep_time_delta)); tm.tv_sec = 0; tm.tv_nsec = wait_time * 1000; nanosleep(&tm, NULL); }
The RECORDER_TRACES has indicated that you want to share the
SpeedTest record as four columns, named tid, value, mod and
delay. These corresponds to the four arguments in the following
record in the recorder_test.c program:
record(SpeedTest, "[thread %u] Recording %u, mod %u after
%ld", tid, i, i % 500, current_time - last_time);
The recorder_scope will then graph the mod and delay columns in
two separate graphs. Since we have activated timing before mod,
the recorder_scoope will show timing information in the mod graph.
Similaryl, since we have activated min/max and average, and then
toggled timing off by using -t a second time, the delay graph will
show min, max and average value, but not timing.