This is just a merge of the truenas forum post and the truenas-influxdb-grafana, make sure to appreciate the original authors.
- prometheus server with configured service discovery
- grafana instance configured to use the prometheus as datasource
- clone the repo:
git clone git@github.com:mazay/truenas-grafana.git && cd truenas-grafana
- deploy the
graphite-exporter, mind theloadBalancerIPthat's where TrueNAS should push metrics to, multiple instance should be able to use that but you might need to bump theresources:kubectl apply -f truenas-graphite-exporter.yaml
- configure TrueNAS for pushing metrics to the
graphite-exporterendpoint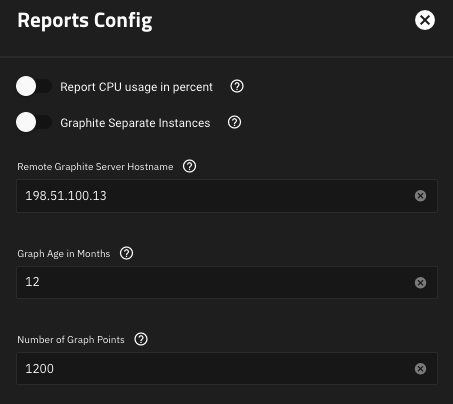
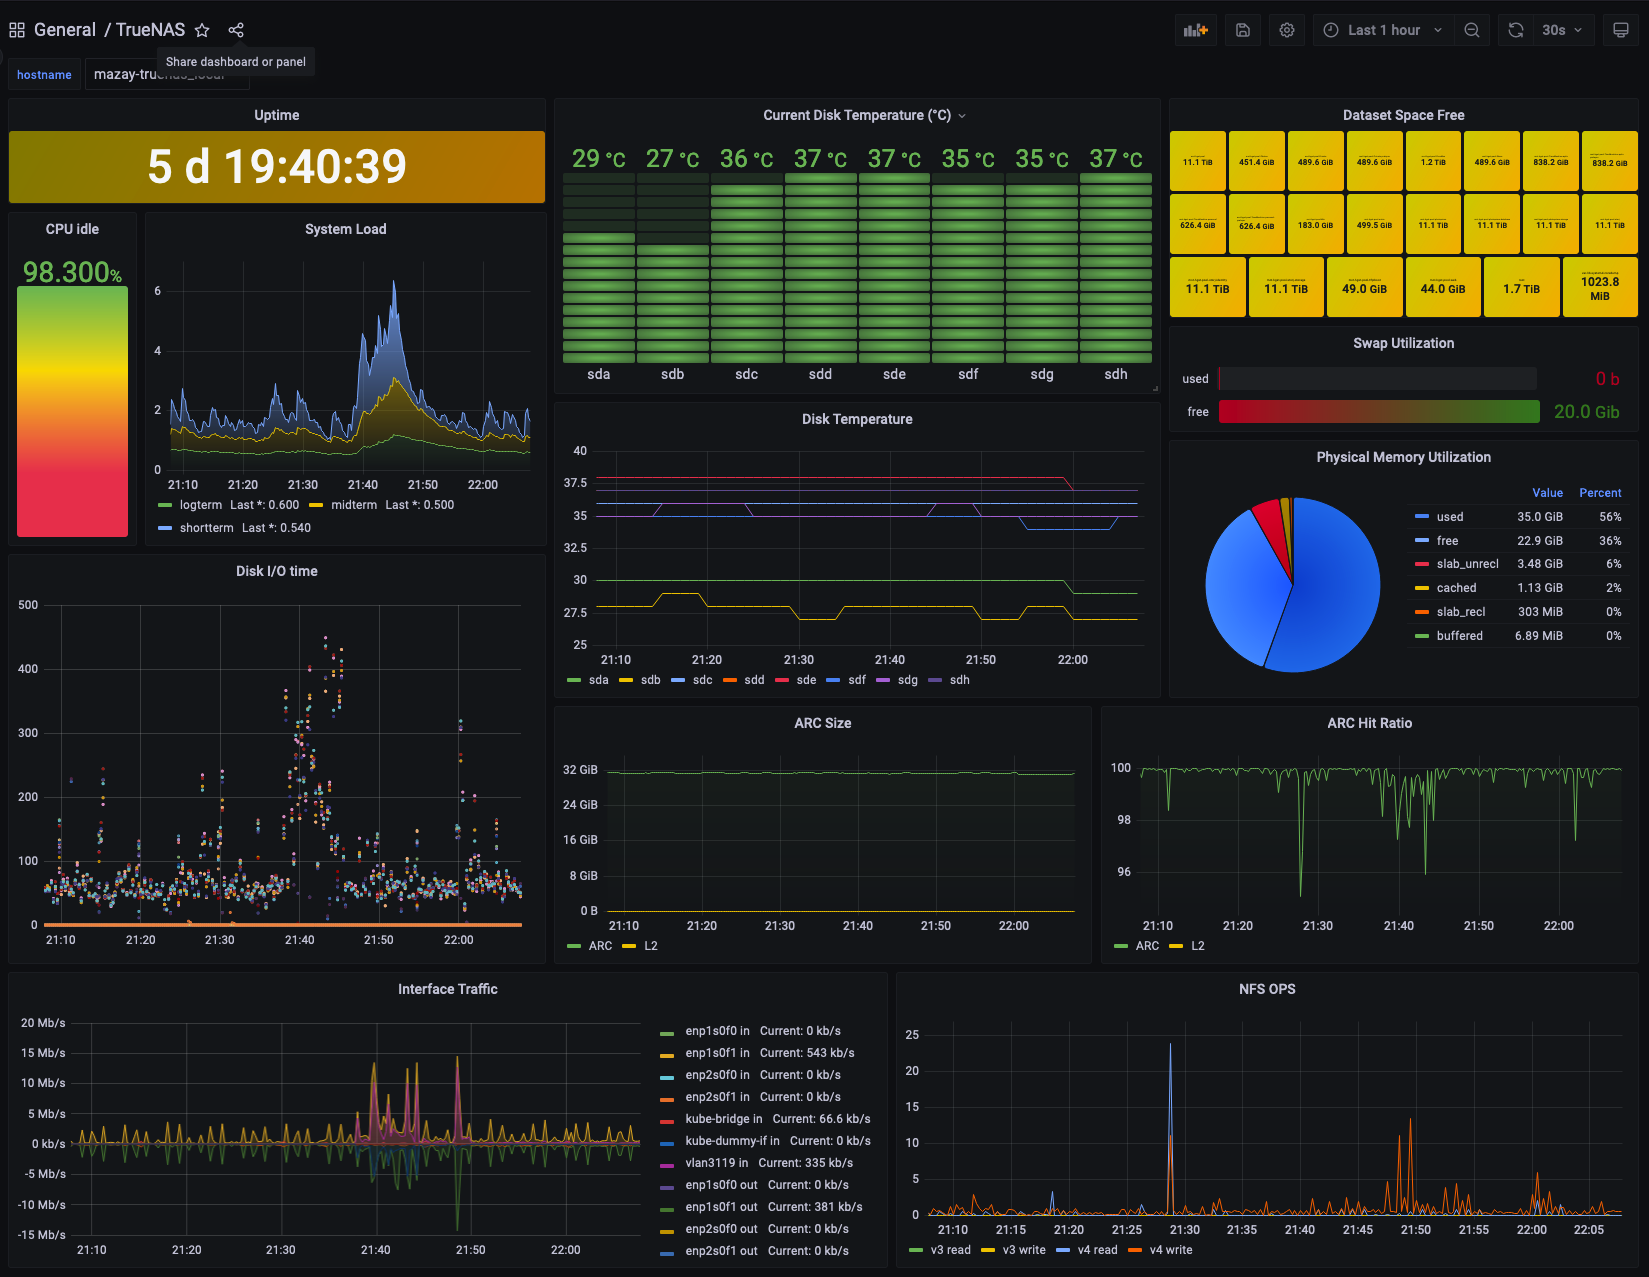
- import the dashboard from
TrueNAS-dashboard.json - profitų


- The
graphite-exportermappings aren't great and might need some love but they work for me as is. - Not particularly happy about the
Dataset Space Freepanel but it's minor.