false_colour_index_spectrogram
Generate a false colour index spectrogram to nicely visualise long duration soundscape recordings - based on Towsey et. al. 2014
Scripts
"main_calc_fci_spectrogram.py" calculates the indices for the false colour index spectrogram
"plot_index_distributions.py" used to look at the distribution of values for each of the three indices
"plot_fci_spectrogram" to show false colour index spectrogram (without recalculating indices)
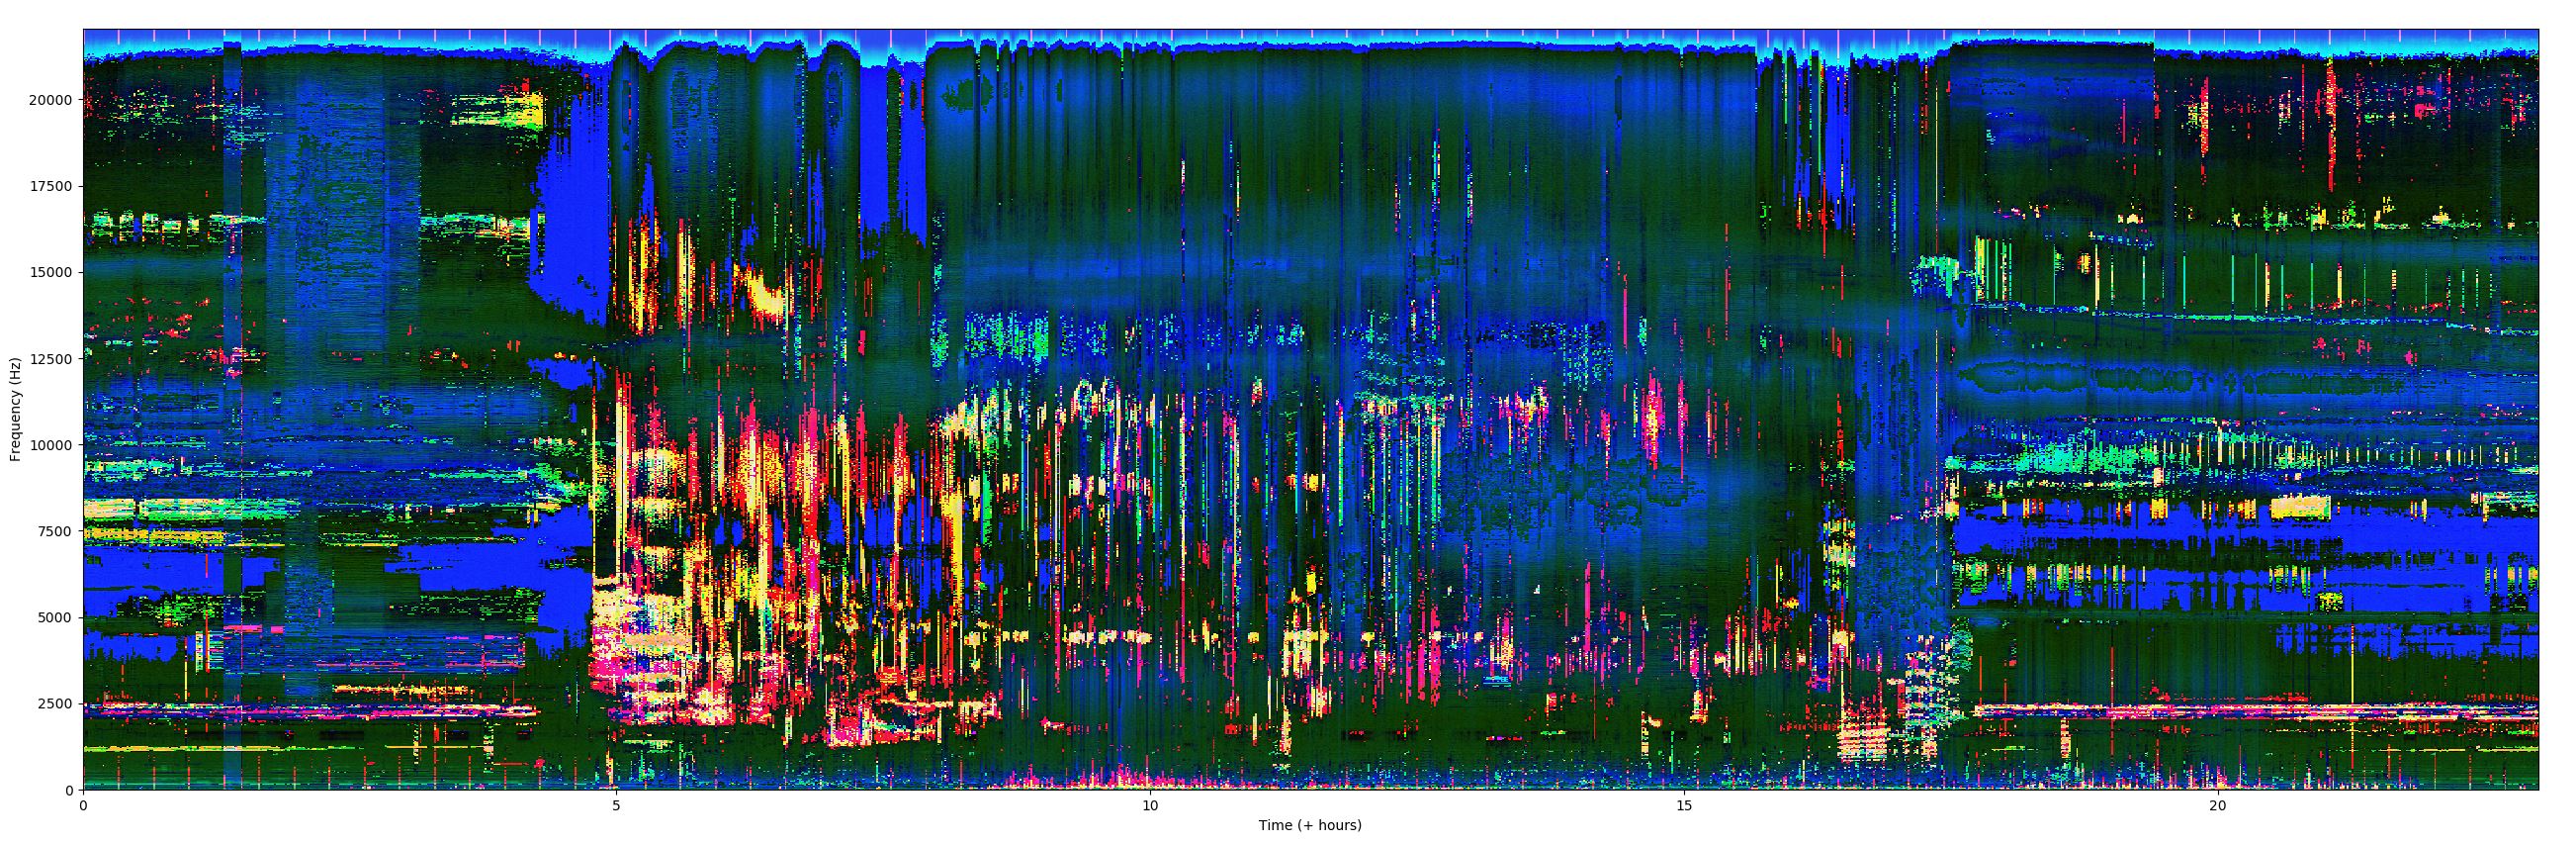
Example output plot:
24 hours recorded from a tropical rainforest in Sabah, Borneo. Dawn and dusk choruses are clearly visible with different patterns of calling during the day and night time
Input / output data format
It is assumed that a series of 1 minute files are stored in ./input_audio/ dir
If you have long duration recordings, to split into individual files use ffmpeg:
ffmpeg -i long_input_file.wav -f segment -segment_time 60 -c copy short_output_file_%06d.wav
then transfer these one minute files to ./input_audio/ and you're ready to go
Numpy ndarrays storing individual index spectrograms are stored in ./output_spectrograms/ dir
Authors
Sarab Sethi (Imperial College London)
Based on code from Dan Stowell (Queen Mary University of London)