#Traffic Sign Recognition
##Writeup Template
###You can use this file as a template for your writeup if you want to submit it as a markdown file, but feel free to use some other method and submit a pdf if you prefer.
Build a Traffic Sign Recognition Project
The goals / steps of this project are the following:
- Load the data set (see below for links to the project data set)
- Explore, summarize and visualize the data set
- Design, train and test a model architecture
- Use the model to make predictions on new images
- Analyze the softmax probabilities of the new images
- Summarize the results with a written report
###Here I will consider the rubric points individually and describe how I addressed each point in my implementation.
1. Provide a Writeup / README that includes all the rubric points and how you addressed each one. You can submit your writeup as markdown or pdf. You can use this template as a guide for writing the report. The submission includes the project code.
You're reading it! and here is a link to my project code
1. Provide a basic summary of the data set and identify where in your code the summary was done. In the code, the analysis should be done using python, numpy and/or pandas methods rather than hardcoding results manually.
The code for this step is contained in the second code cell of the IPython notebook.
I used the pandas library to calculate summary statistics of the traffic signs data set:
- The size of training set is 34799
- The size of test set is 12630
- The shape of a traffic sign image is (32, 32, 3)
- The number of unique classes/labels in the data set is 43
2. Include an exploratory visualization of the dataset and identify where the code is in your code file.
The code for this step is begins in the third code cell of the IPython notebook.
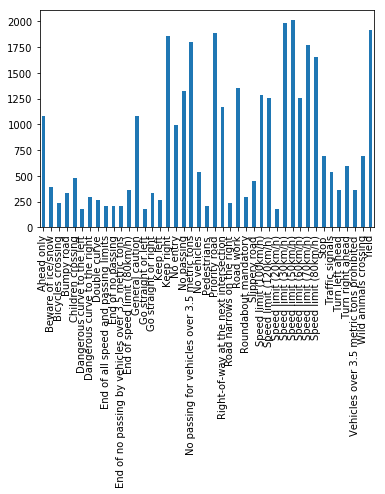
Here is an exploratory visualization of the data set. It is a bar chart showing how the data is distributed by type of sign. The most common type of signs are speed limit and yield signs.
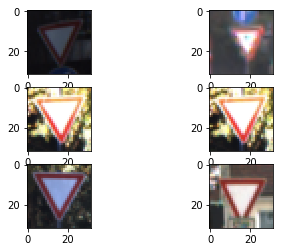
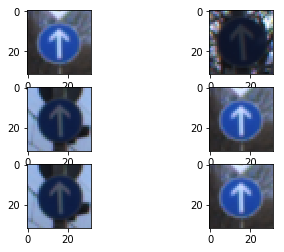
I have also included sample images by sign type:
Yield Signs
Ahead Only Signs
1. Describe how, and identify where in your code, you preprocessed the image data. What tecniques were chosen and why did you choose these techniques? Consider including images showing the output of each preprocessing technique. Pre-processing refers to techniques such as converting to grayscale, normalization, etc.
The code for this step is contained in the eigth code cell of the IPython notebook.
I initially tried to use min-max normalization to limit the range of values
between -1 and 1. However, I only got 85% validation accuracy. So then I used
scikit-learn's scikit.preprocessing.StandardScaler function to normalize my
data. It is similar to min-max normalization, but also makes the data have
stddev=1. This improved my validation accuracy by 8% to 93%.
I did not use grayscaling because it made my validation accuracy slightly lower. Displaying images from different sign types (see images shown in previous question) show that different types of images tend to have similar colors. I think that grayscaling doesn't allow the model to use this color information in its classification which may be why it hurt accuracy.
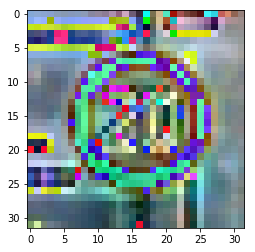
Here is an example of a traffic sign image before and after my preprocessing:
2. Describe how, and identify where in your code, you set up training, validation and testing data. How much data was in each set? Explain what techniques were used to split the data into these sets. (OPTIONAL: As described in the "Stand Out Suggestions" part of the rubric, if you generated additional data for training, describe why you decided to generate additional data, how you generated the data, identify where in your code, and provide example images of the additional data)
The code for splitting the data into training and validation sets is contained in the first code cell of the IPython notebook.
The validation and test sets were already done for me in the template code so I did not do anything in addition.
3. Describe, and identify where in your code, what your final model architecture looks like including model type, layers, layer sizes, connectivity, etc.) Consider including a diagram and/or table describing the final model.
The code for my final model is located in the 31st cell of the ipython notebook.
My final model consisted of the following layers:
| Layer | Description |
|---|---|
| Input | 32x32x3 RGB image |
| Convolution 5x5 | 1x1 stride, same padding, outputs 28x28x32 |
| RELU | |
| Max pooling | 2x2 stride, outputs 14x14x32 |
| Convolution 5x5 | 1x1 stride, same padding, outputs 14x14x32 |
| RELU | |
| Convolution 5x5 | 1x1 stride, same padding, outputs 10x10x64 |
| RELU | |
| Max pooling | 2x2 stride, outputs 5x5x64 |
| Fully connected | Input=5x5x64=1600, Output=1028 |
| Dropout | Keep Probability 0.5 |
| Fully connected | Input=1028, Output=512 |
| Dropout | Keep Probability 0.5 |
| Fully connected | Input=512, Output=256 |
| Fully connected | Input=256, Output=43 |
| Softmax | |
4. Describe how, and identify where in your code, you trained your model. The discussion can include the type of optimizer, the batch size, number of epochs and any hyperparameters such as learning rate.
The code for training the model is located in the 32nd cell of the ipython notebook.
To train the model, I used
- learning_rate = 0.001
- epochs = 10
- batch_size = 128
I found that gradient descent tended to converge by the 5th or 6th epoch so did not need to run more than 10 epochs. I found a bigger impact changing the model architecture and preprocessing techniques than changing the training hyperparameters so I used the default settings since they worked reasonably well.
####5. Describe the approach taken for finding a solution. Include in the discussion the results on the training, validation and test sets and where in the code these were calculated. Your approach may have been an iterative process, in which case, outline the steps you took to get to the final solution and why you chose those steps. Perhaps your solution involved an already well known implementation or architecture. In this case, discuss why you think the architecture is suitable for the current problem.
The code for calculating the accuracy of the model is located in the 40th cell of the Ipython notebook.
My final model results were:
- training set accuracy of 99.5%
- validation set accuracy of 93.1%
- test set accuracy of 93.4%
The first architecture I used was the LeNet architecture from the lab. It worked reasonably well with accuracy in the eighties. However, I found that by increasing the depth of my network I improved my accuracy a lot.
In particular, I increased the depth of convolutions going up to 64. I also added more convolution layers having 4 layers instead of 2. I also added more fully connected hidden layers. I was worried that deepenign my network so much would cause overfitting, but the more trial and error I did it seemed necessary to use more convolutions to detect patterns in the image.
Since my model architecture was so much deeper, I added a few dropout layers to prevent overfitting.
To be honest, designing the architecture for me was more trial and error and interative until my validation accuracy went up higher.
1. Choose five German traffic signs found on the web and provide them in the report. For each image, discuss what quality or qualities might be difficult to classify.
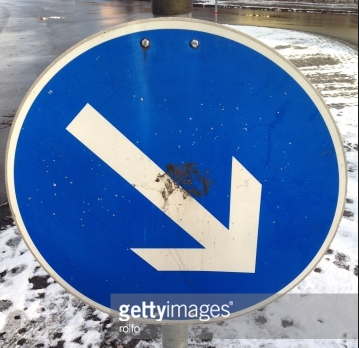
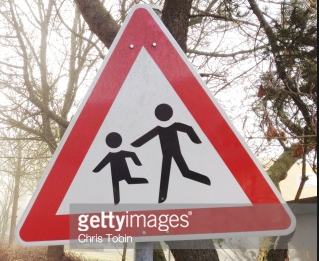
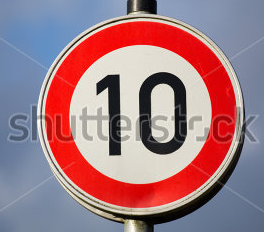
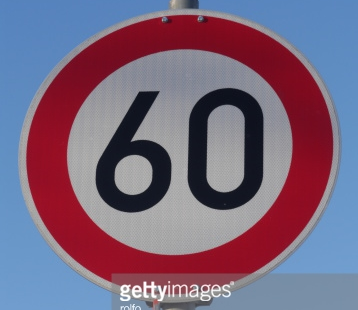
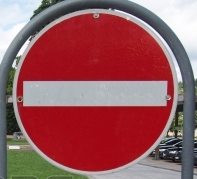
Here are five German traffic signs that I found on the web:
I expect the model to classify image 1 and 5 easily because there are many examples of speed limit signs in the training set. I think image 4 will be the hardest to classify because the direction of the arrow is
2. Discuss the model's predictions on these new traffic signs and compare the results to predicting on the test set. Identify where in your code predictions were made. At a minimum, discuss what the predictions were, the accuracy on these new predictions, and compare the accuracy to the accuracy on the test set (OPTIONAL: Discuss the results in more detail as described in the "Stand Out Suggestions" part of the rubric).
The code for making predictions on my final model is located in the tenth cell of the Ipython notebook.
Here are the results of the prediction:
| Image | Prediction |
|---|---|
| Speed limit (10km/h) | Speed limit (30km/h) |
| No entry | No entry |
| Children Crossing | Children Crossing |
| Keep right | Keep right |
| Speed limit (60km/h) | Speed limit (60km/h) |
The model was able to correctly guess 4 of the 5 traffic signs, which gives an accuracy of 80%. This compares favorably to the accuracy on the test set.
3. Describe how certain the model is when predicting on each of the five new images by looking at the softmax probabilities for each prediction and identify where in your code softmax probabilities were outputted. Provide the top 5 softmax probabilities for each image along with the sign type of each probability. (OPTIONAL: as described in the "Stand Out Suggestions" part of the rubric, visualizations can also be provided such as bar charts)
The code for making predictions on my final model is located in the 62nd cell of the Ipython notebook.
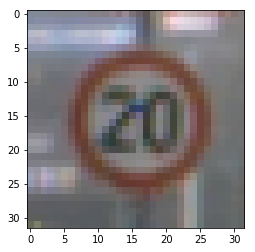
For the first image, the model incorrectly classifies it as a 10km/h speed limit sign as opposed to a 30km/h speed limit sign. However, the top 5 classes are different speed limit signs so it recognizes the shape and color, but it's not quite able to classify the text properly. The image has a watermark in the center of the image because I took it from Getty Images stock photos, which is why I think the classifier thinks its a 3 instead of a 10.
| Probability | Prediction |
|---|---|
| .99 | Speed limit (30km/h) |
| .00 | Speed limit (70km/h) |
| .00 | Speed limit (50km/h) |
| .00 | Speed limit (20km/h) |
| .00 | Speed limit (100km/h) |
For the second image it accurately classifies it as no entry.
| Probability | Prediction |
|---|---|
| 1.00 | No entry |
| .00 | Speed limit (20km/h) |
| .00 | Bumpy Road |
| .00 | Bicycles crossing |
| .00 | Speed limit (30km/h) |
For the third image the classifier accurately classifies it as children crossing.
| Probability | Prediction |
|---|---|
| .90 | Children Crossing |
| .08 | Bicycles Crossing |
| .00 | Wild animals crossing |
| .00 | Speed limit (30km/h) |
| .00 | Slippery road |
For the fourth image the classifier accurately classifies it as keep right. Interestingly, 3 of the 5 top classes are signs with arrows in them so it's able to distinguish that.
| Probability | Prediction |
|---|---|
| 1.00 | Keep right |
| .00 | Roundabout mandatory |
| .00 | Keep left |
| .00 | Turn left ahead |
| .00 | Speed limit (120km/h) |
For the fifth image it correctly classifies the speed limit sign unlike the first speed limit sign. Interstingly the top 4 out of 5 classes are speed limit signs so it's doing a good job distinguishing speed limit sign features.
| Probability | Prediction |
|---|---|
| .93 | Speed limit (60km/h) |
| .05 | Speed limit (50km/h) |
| .02 | Speed limit (80km/h) |
| .00 | Speed limit (30km/h) |
| .00 | Stop |
