English | Zh-CN
YOLOV5 optimization on Triton Inference Server
Deploy Yolov5 object detection service in Triton. The following optimizations have been made:
Pipelines are implemented through Ensemble and BLS respectively. The infer module in Pipelines is based on the optimized TensorRT Engine in item 1 above, and the Postprocess module is implemented through Python Backend. The workflow refers to How to deploy Triton Pipelines.
Environment
- CPU: 4cores 16GB
- GPU: Nvidia Tesla T4
- Cuda: 11.6
- TritonServer: 2.20.0
- TensorRT: 8.2.3
- Yolov5: v6.1
Benchmark
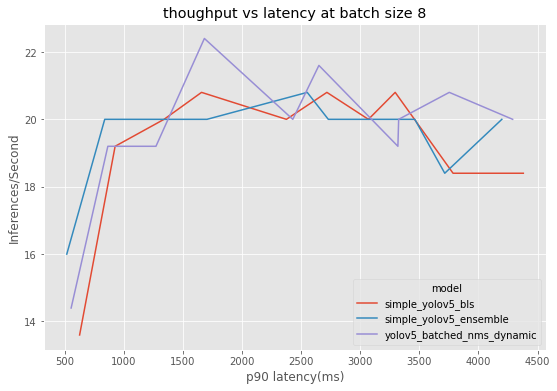
Triton Inference Server is deployed on one machine. Perf_analyzer is used to call the gRPC interface on another machine to compare the performance of BLS Pipelines, Ensemble Pipelines, and BatchedNMS under gradually increasing concurrency.
-
python generate_input.py --input_images <image_path> ----output_file <real_data>.json
-
Test with real data
perf_analyzer -m <triton_model_name> -b 8 --input-data <real_data>.json --concurrency-range 1:10 --measurement-interval 10000 -u <triton server endpoint> -i gRPC -f <triton_model_name>.csv
The data shows that BatchedNMS performs better overall, converging to optimal performance faster under high concurrency, and achieving higher throughput at lower latency. Ensemble Pipelines and BLS Pipelines perform better at lower concurrency, but performance degrades more as concurrency increases.
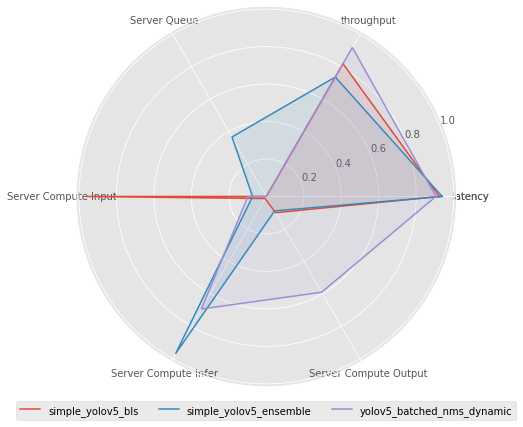
Six metrics are selected for comparison. Each metric is processed and normalized to the 0-1 interval. The original meaning of each metric is as follows:
- Server Queue: Data waiting time in Triton queue
- Server Compute Input: Triton input tensor processing time
- Server Compute Infer: Triton inference execution time
- Server Compute Output: Triton output tensor processing time
- latency: 90th percentile end-to-end latency
- throughput: throughput

