A page specific to France is here.
This page provides graphical representations of daily-updated data provided by JHU CSSE. It is in particular inspired by this New York Times article. See also the site at ourworldingdata.com with many data analyses.
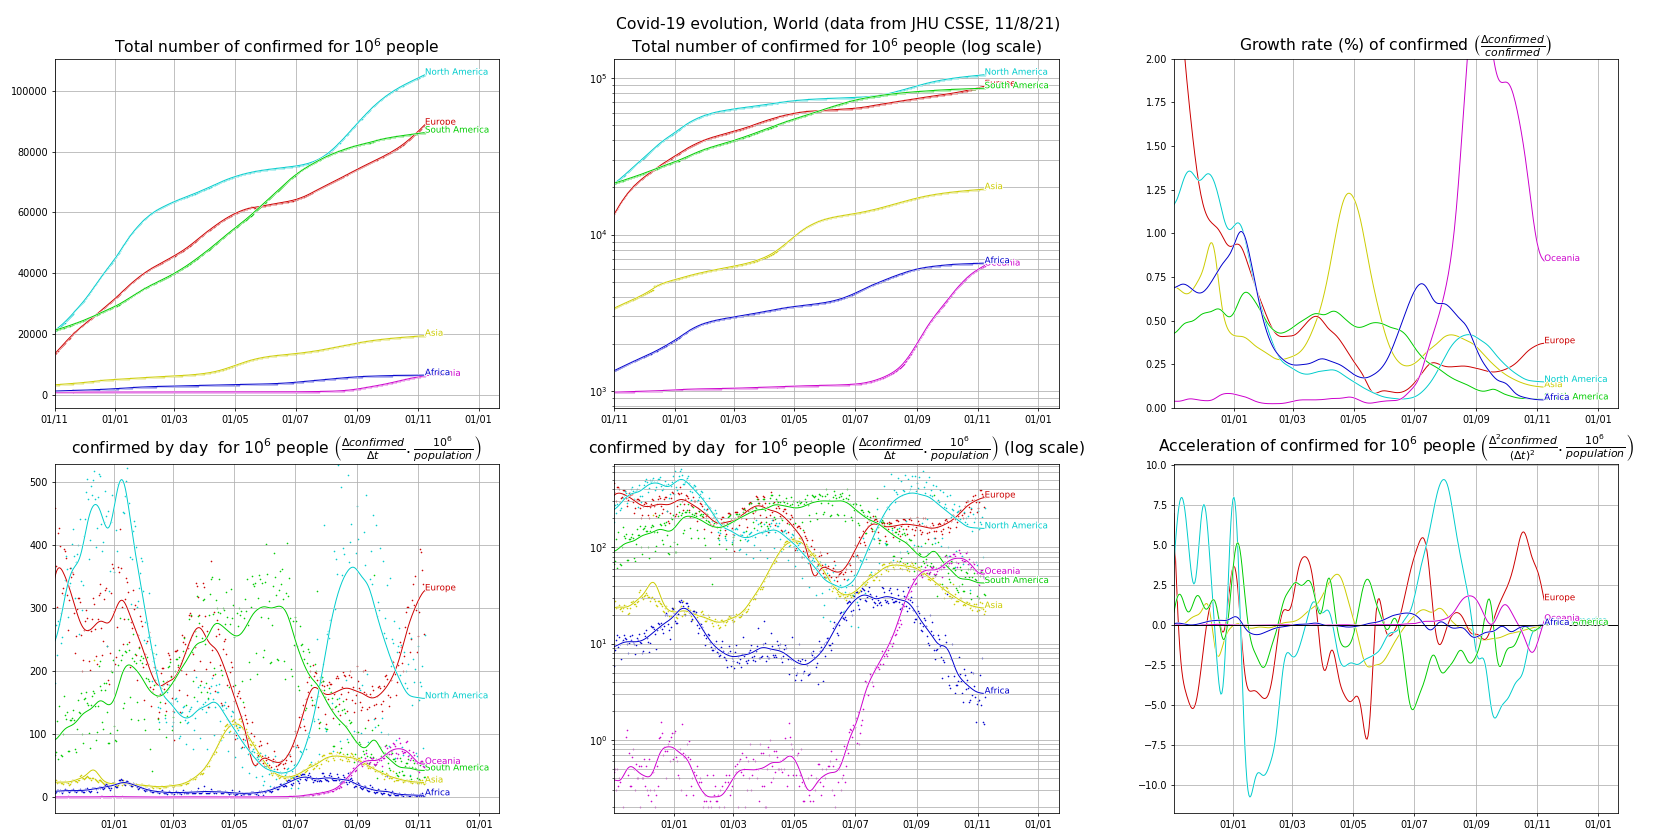
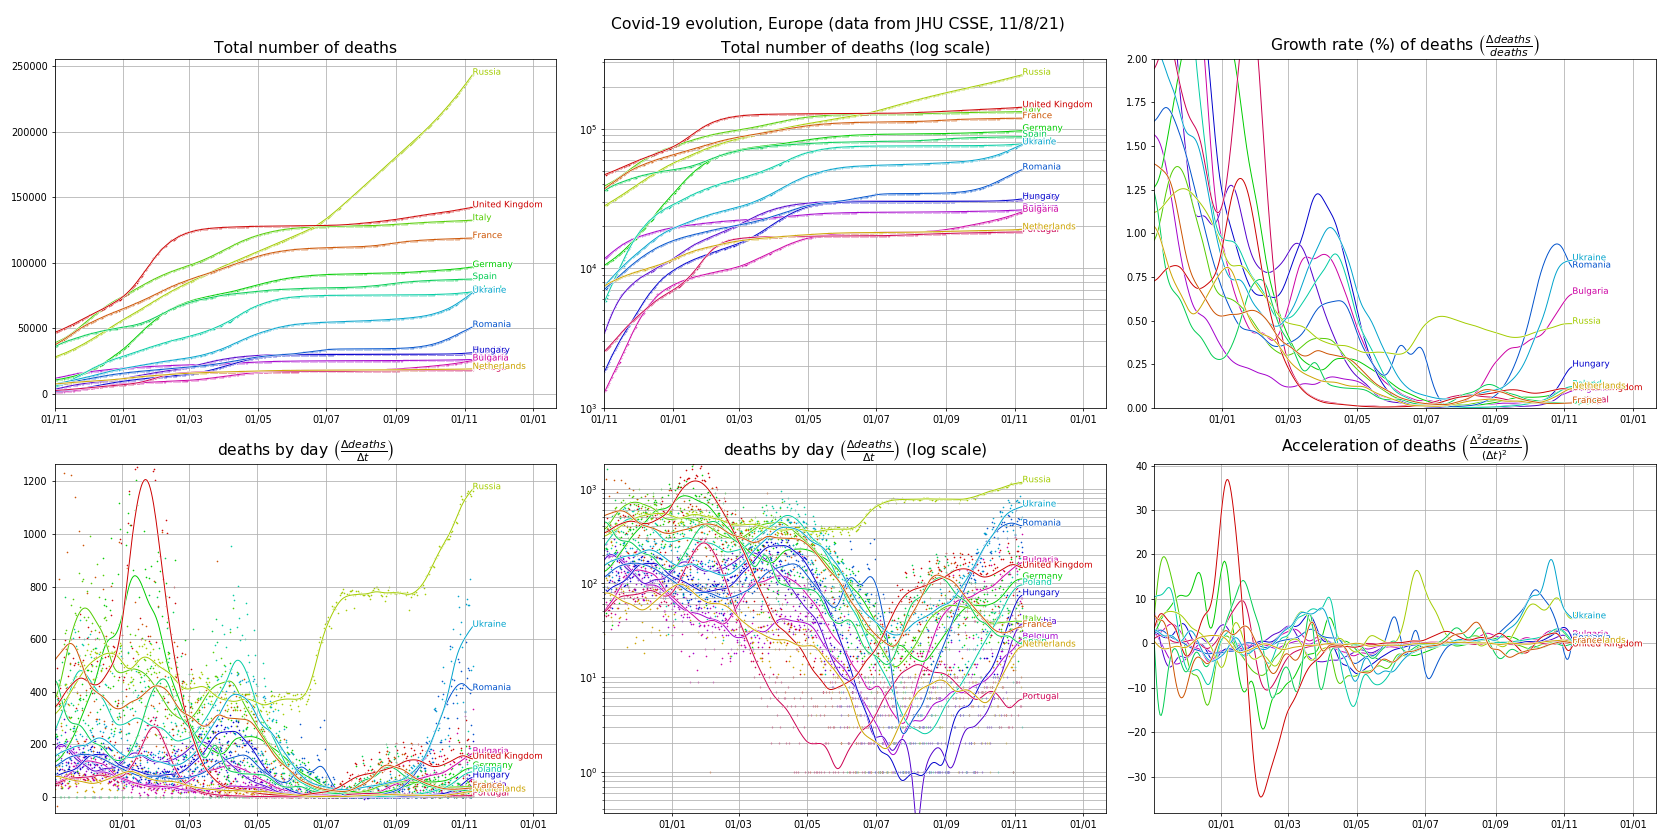
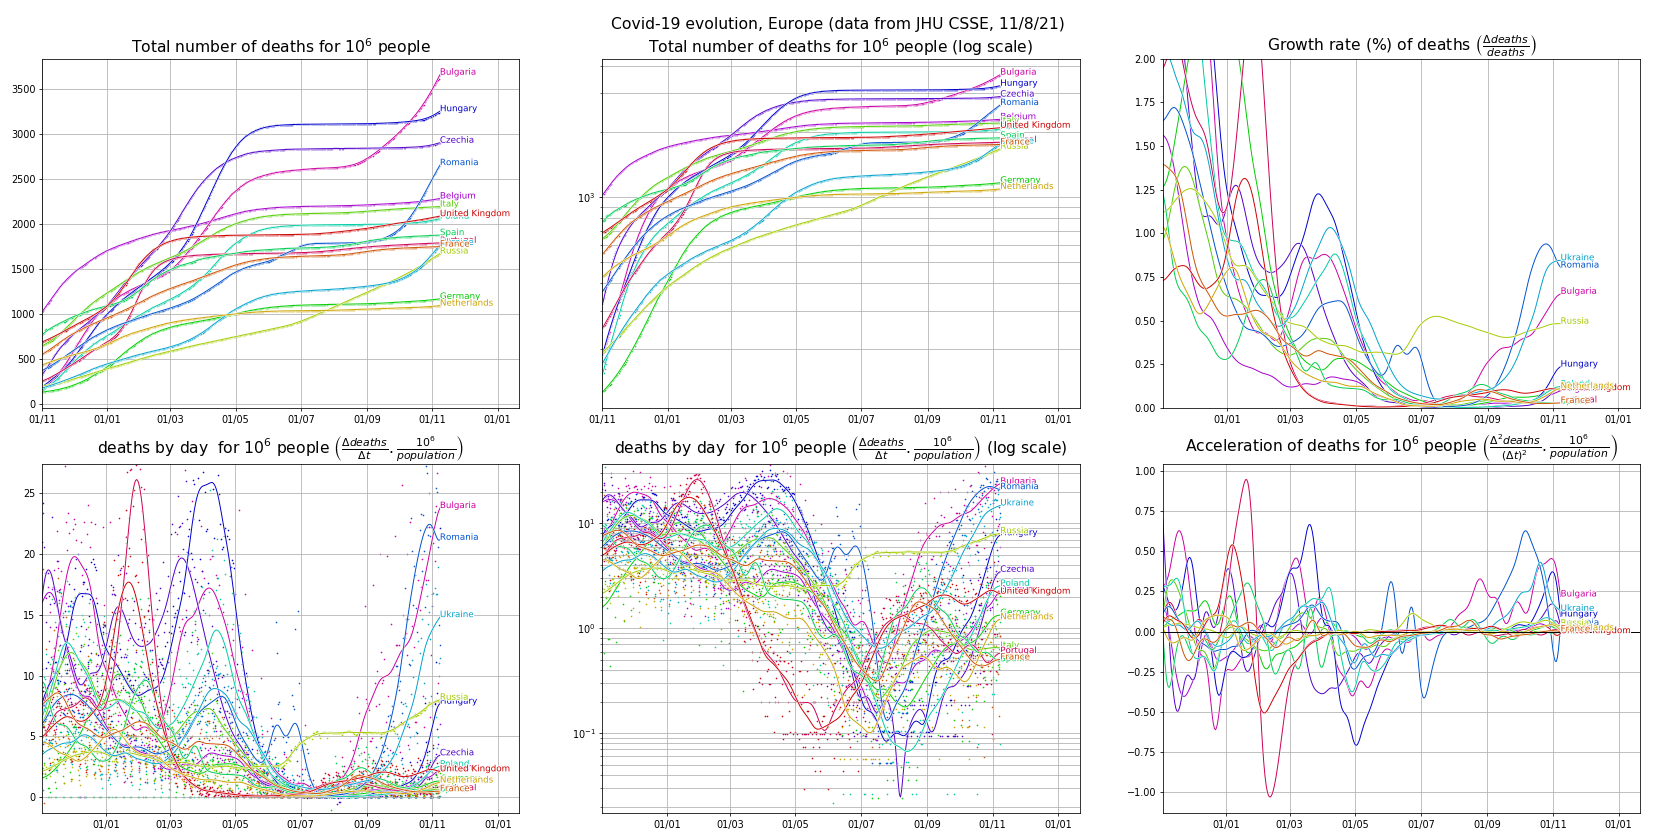
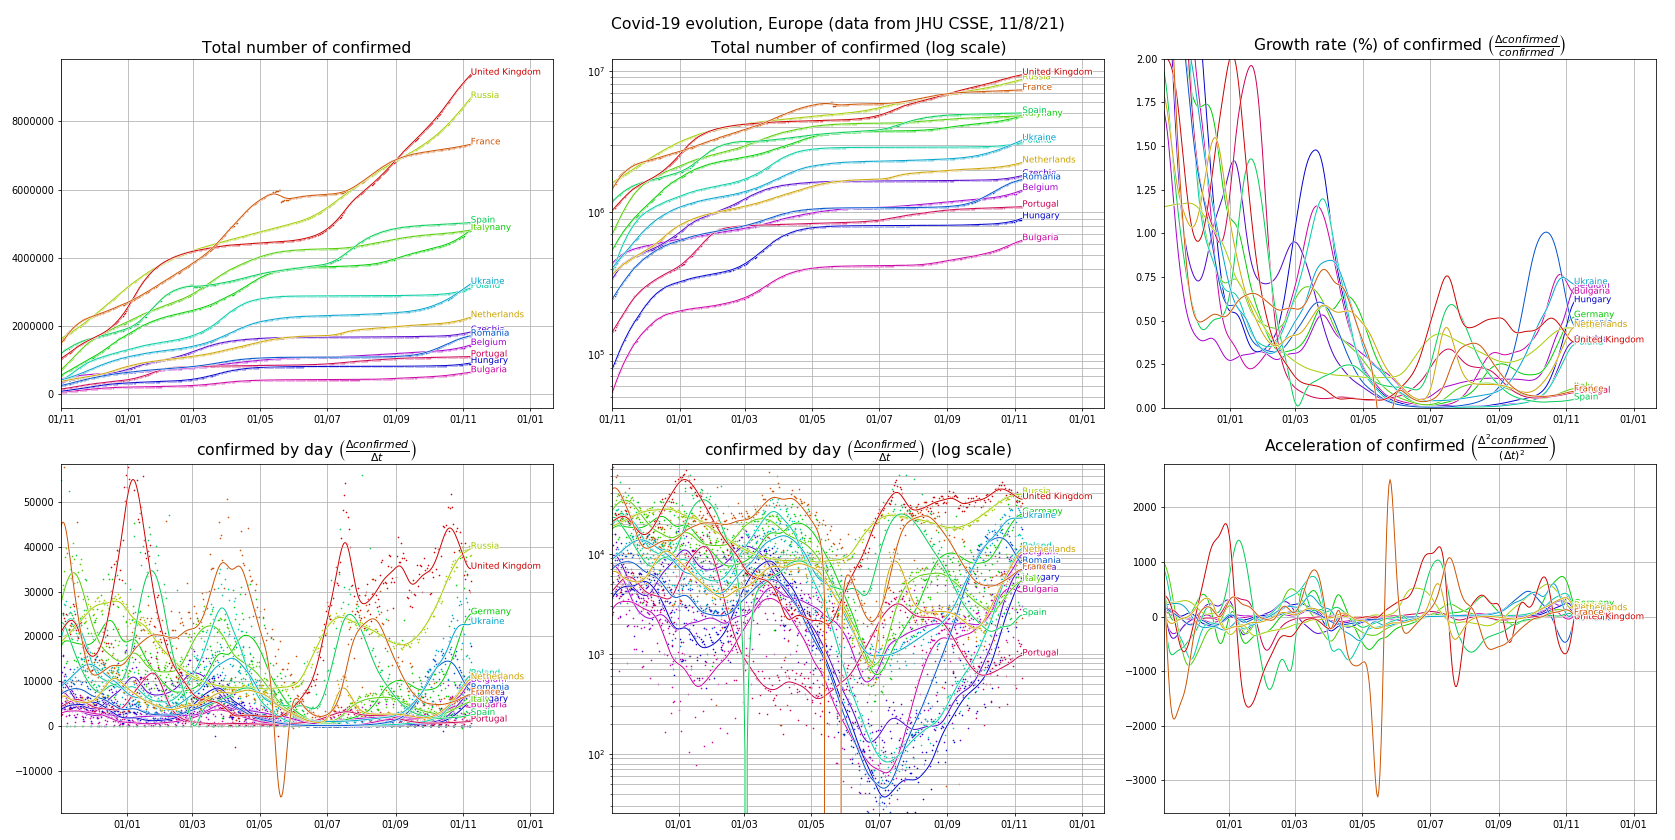
We consider the evolution of the number of deaths, confirmed cases and recovered cases.
For several groups of countries/regions, we provide graphs of the evolution of the cumulative value and the per-day value in linear and log scales. We also present evolution curves that are independent of the population size such as the growth rate.
High quality pdf files can be obtained by clicking on any graph. This page is generated automatically through a python script available on Github.
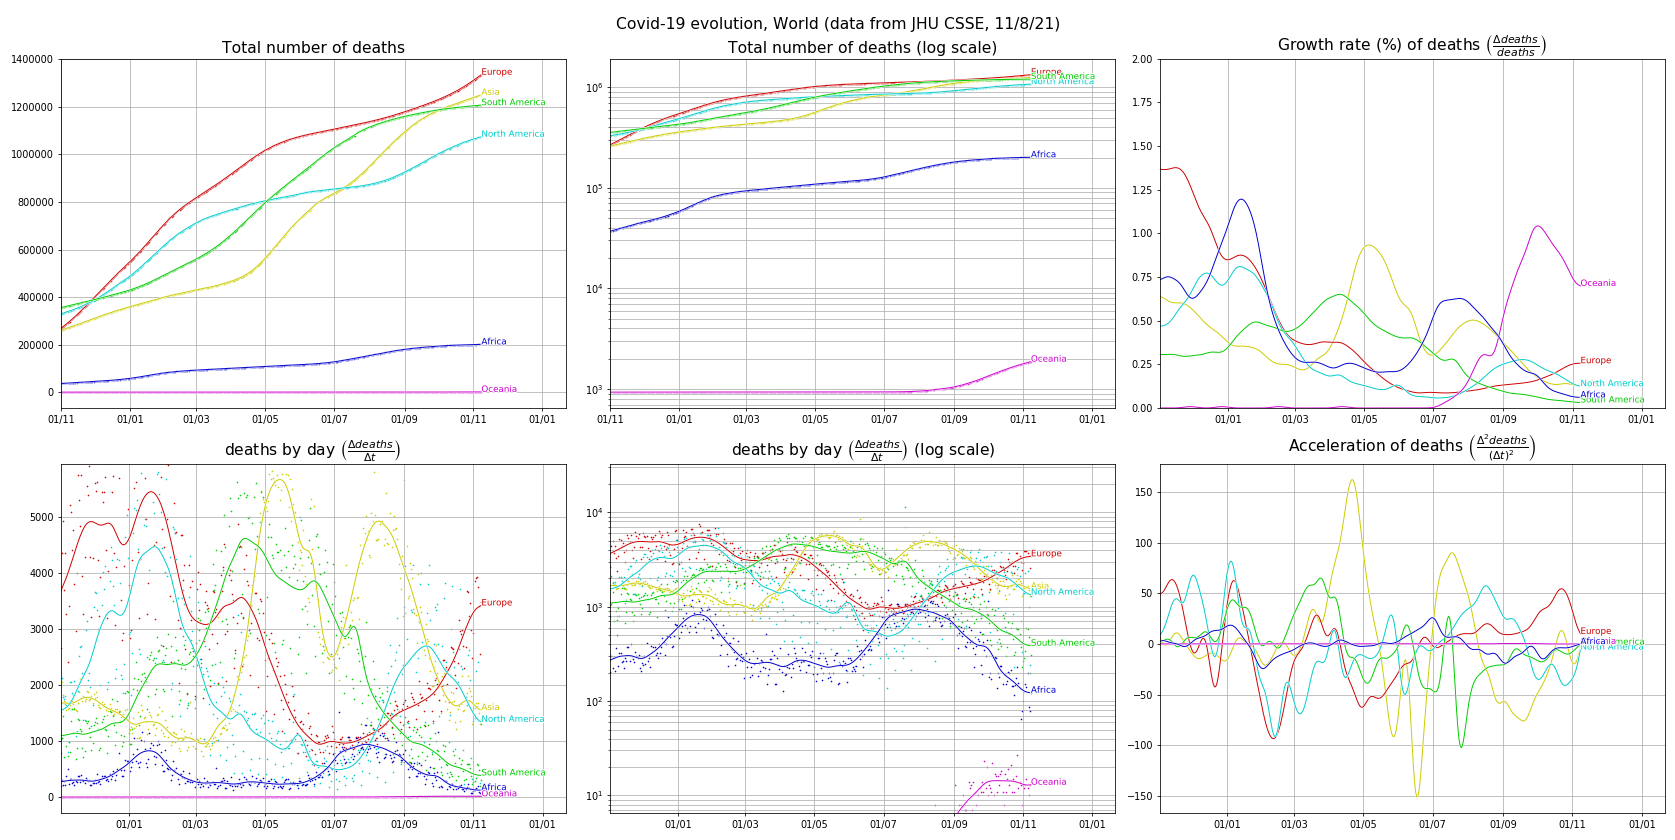
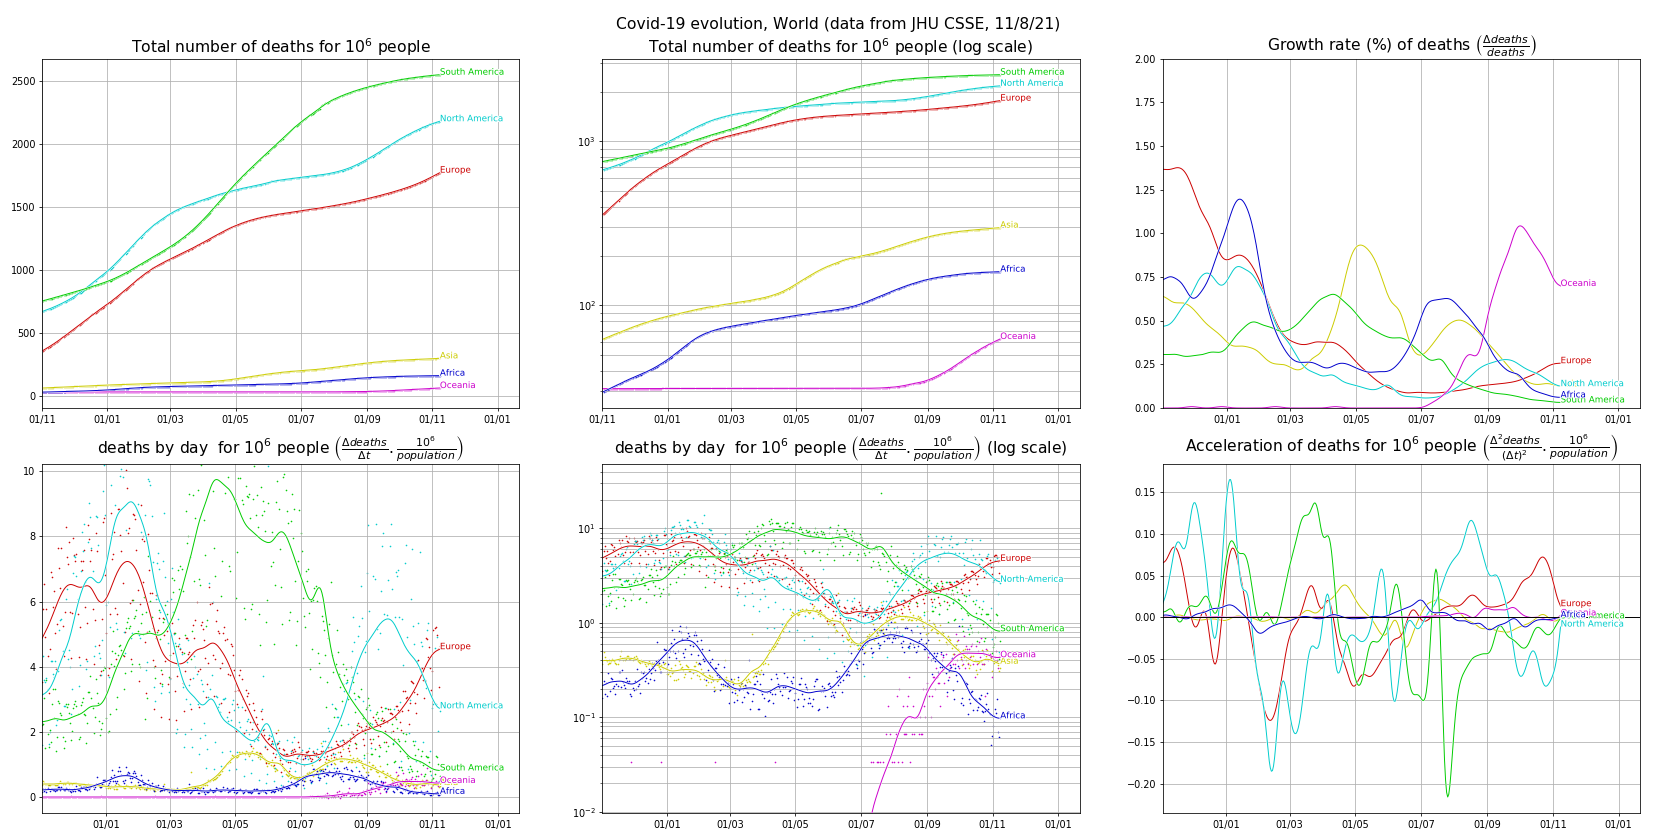
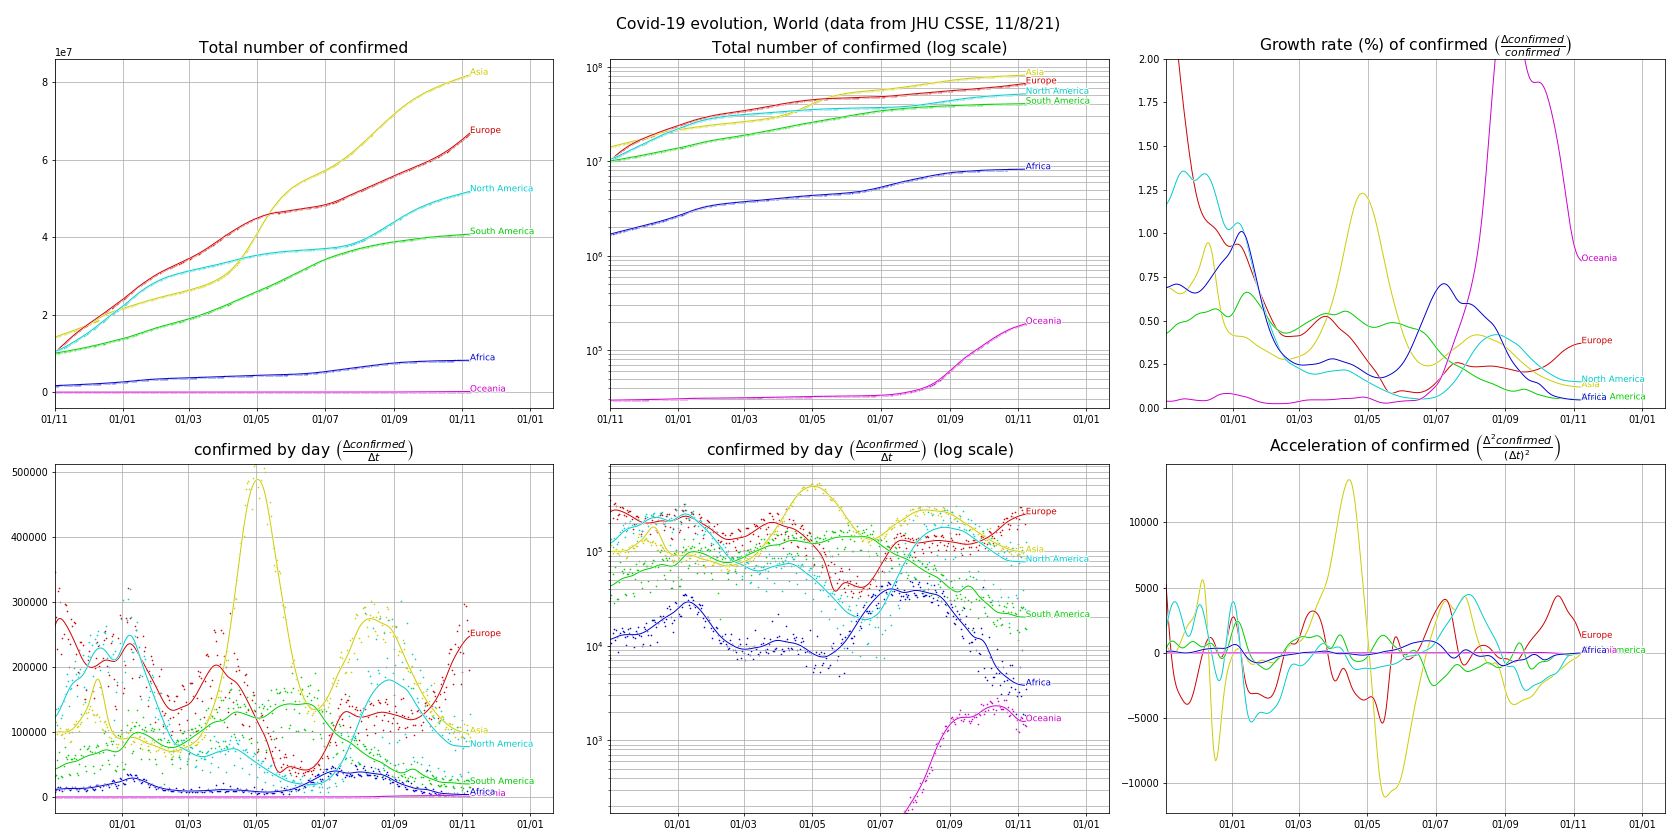
- World (by continents)
- Continents (by countries) :
World (table of contents)
- Deaths: absolute values, normalized by population size
- Confirmed cases: absolute values, normalized by population size
Deaths (absolute values) (table of contents)

Deaths (normalized by population size) (table of contents)
Confirmed cases (absolute values) (table of contents)
Confirmed cases (normalized by population size) (table of contents)
Europe (table of contents)
- Deaths: absolute values, normalized by population size
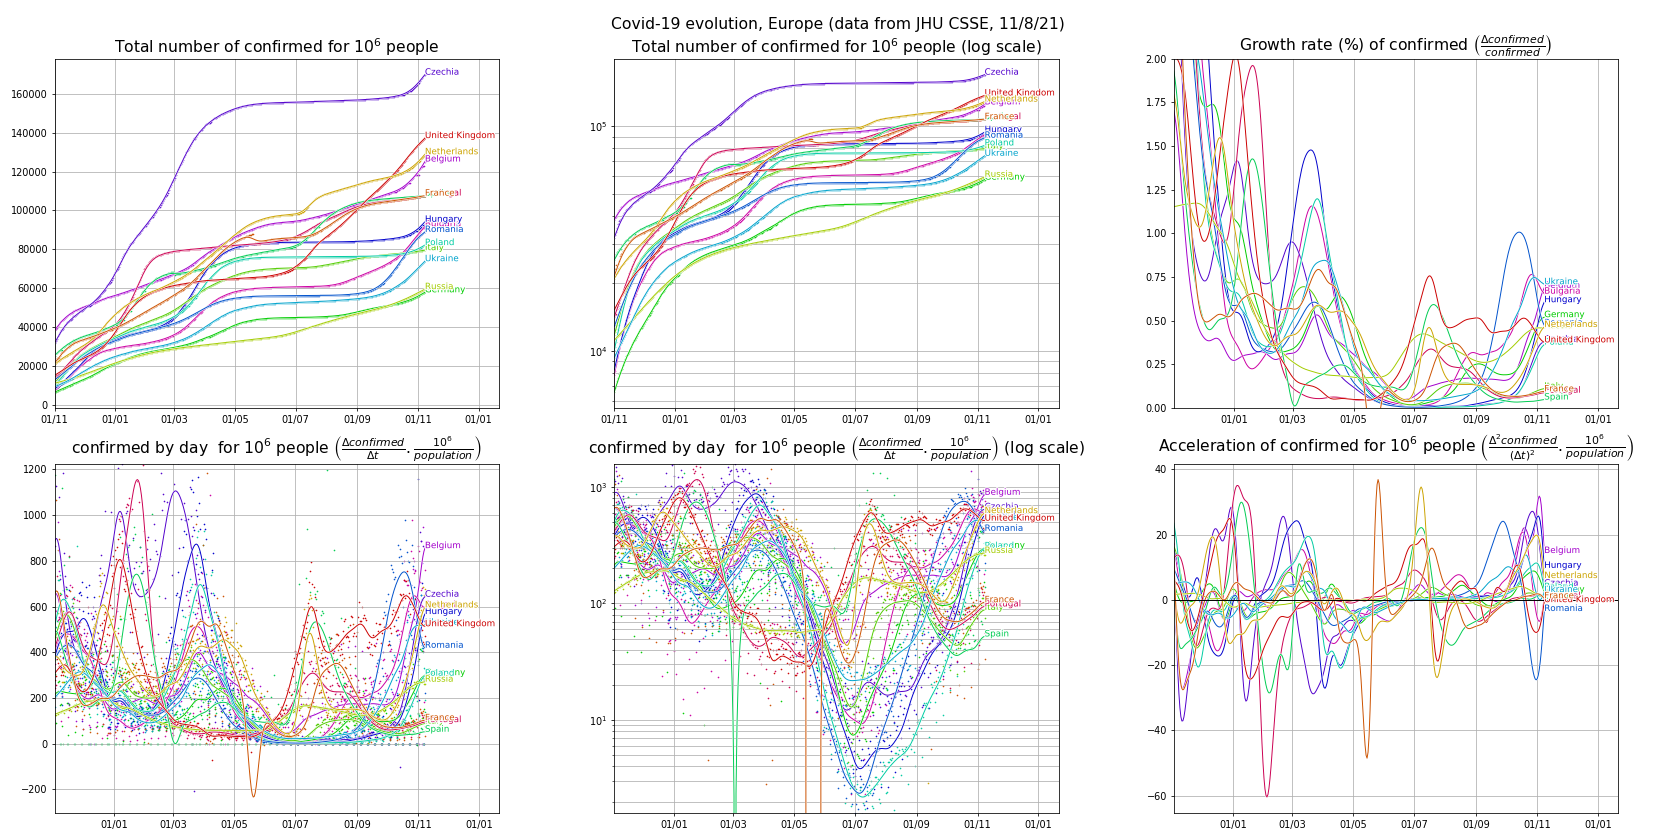
- Confirmed cases: absolute values, normalized by population size
Deaths (absolute values) (table of contents)

Deaths (normalized by population size) (table of contents)
Confirmed cases (absolute values) (table of contents)
Confirmed cases (normalized by population size) (table of contents)
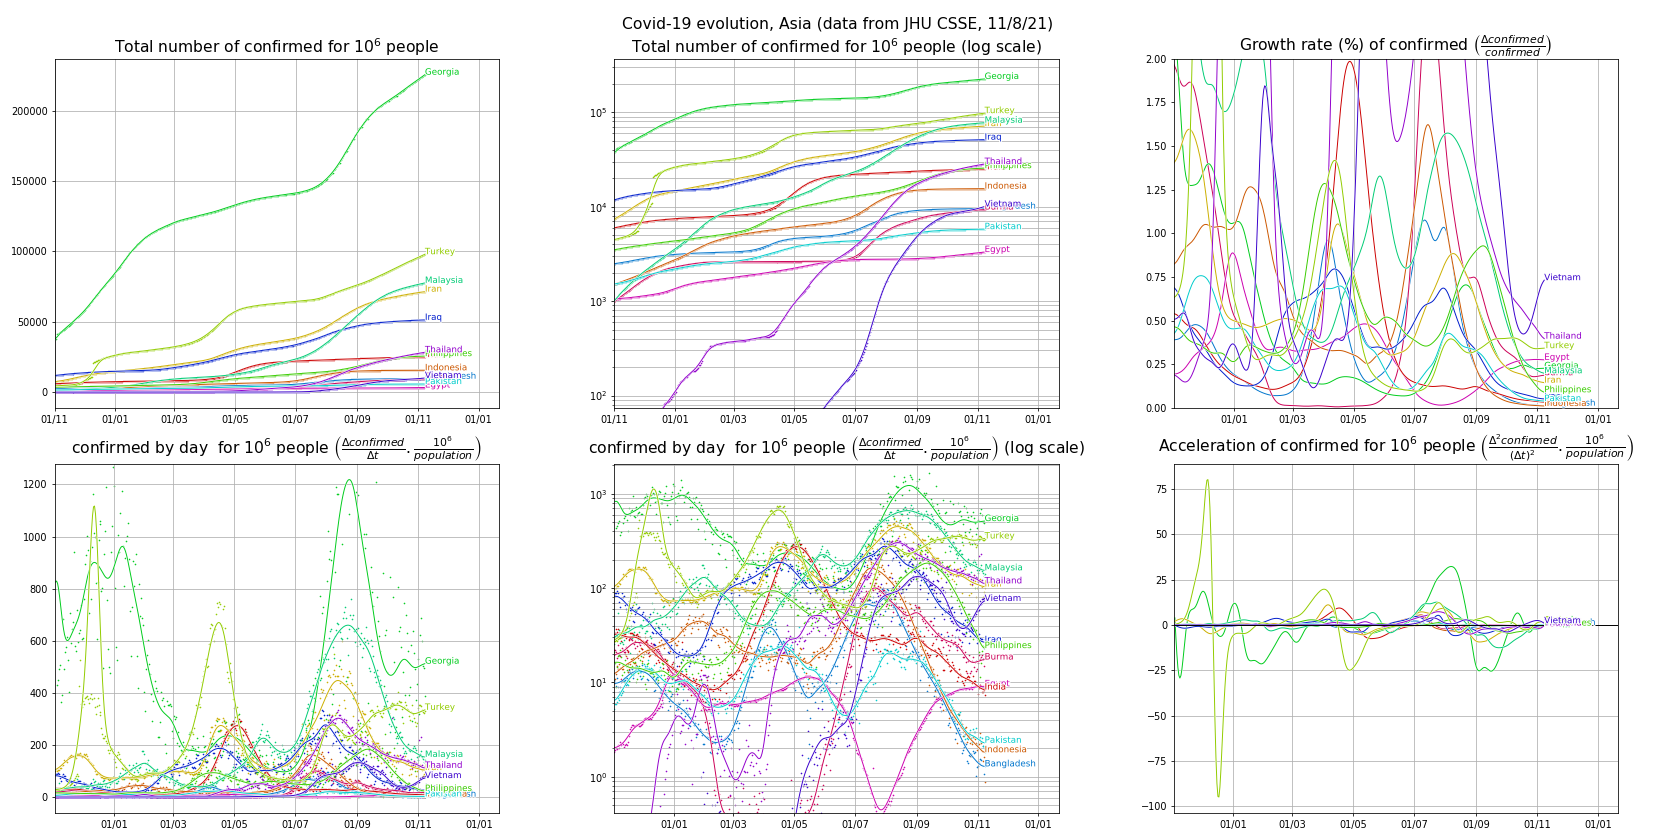
Asia (table of contents)
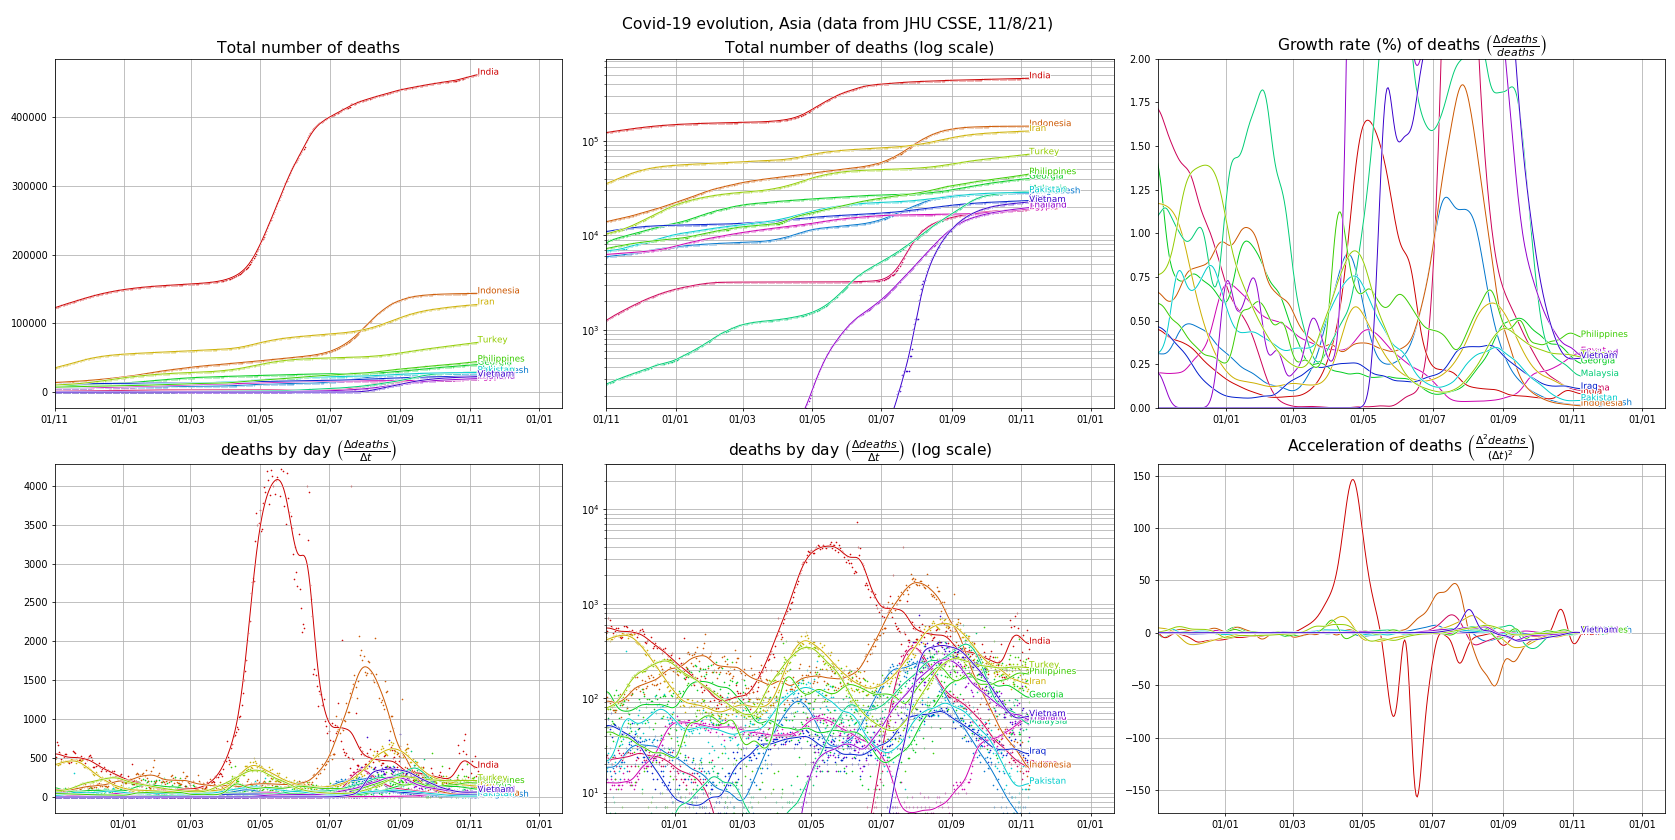
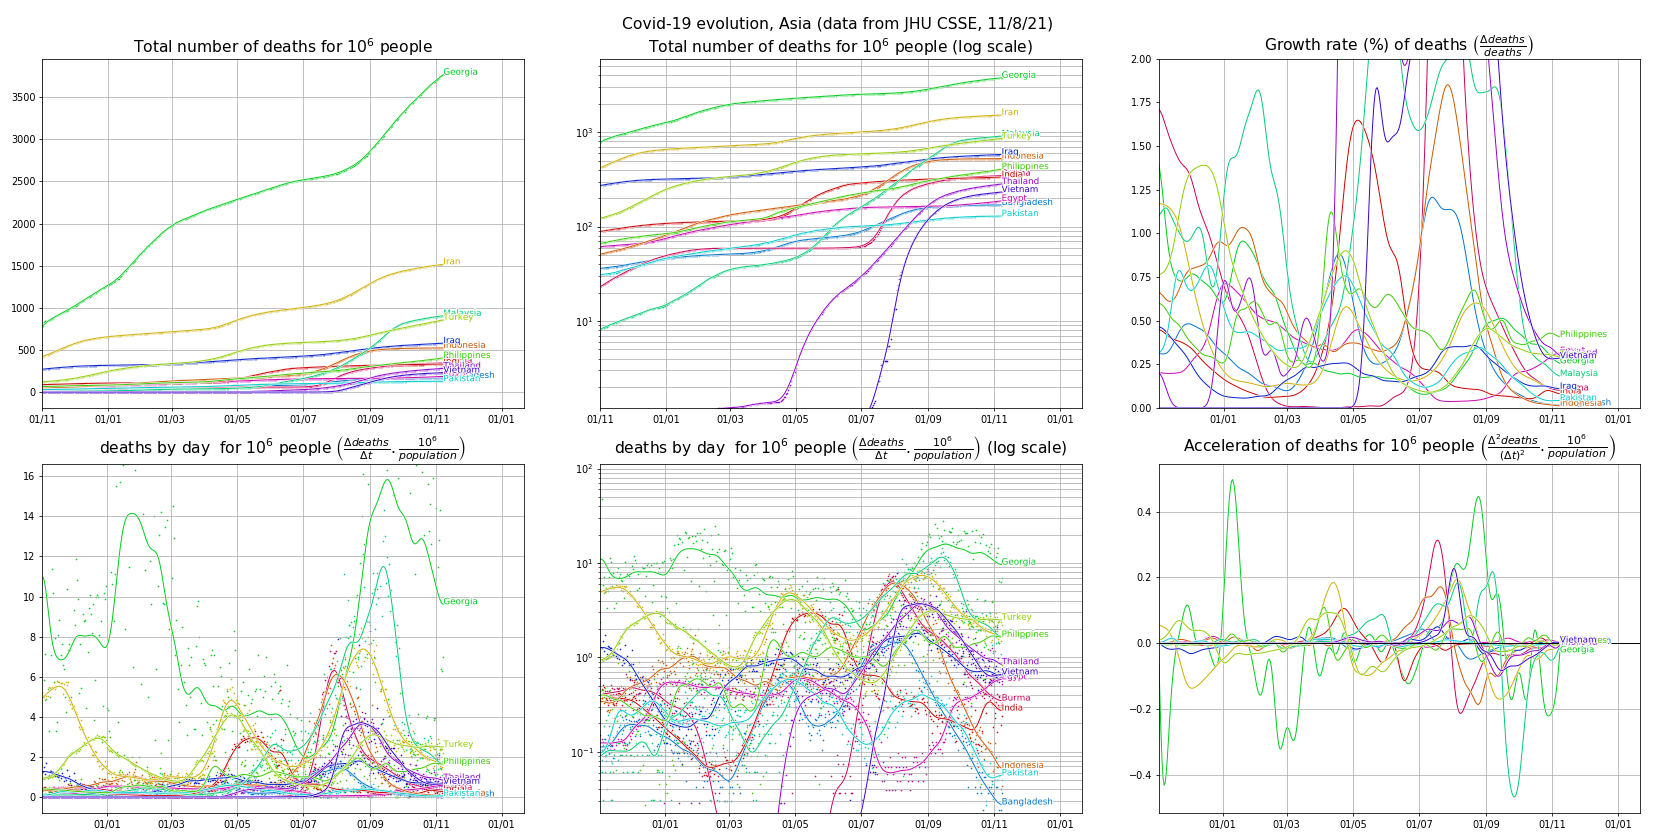
- Deaths: absolute values, normalized by population size
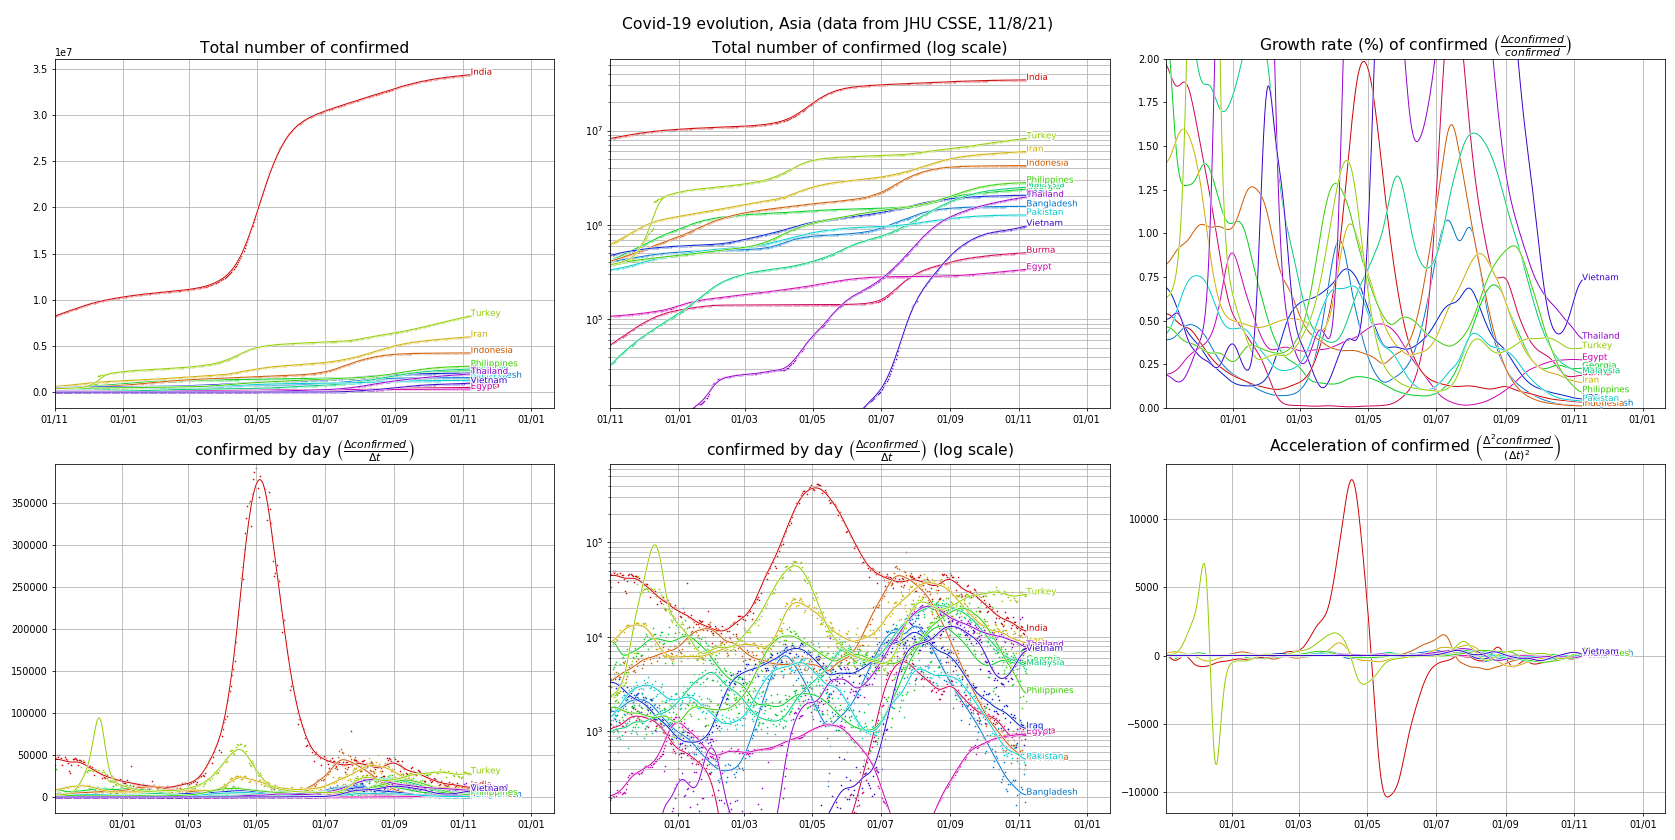
- Confirmed cases: absolute values, normalized by population size
Deaths (absolute values) (table of contents)

Deaths (normalized by population size) (table of contents)
Confirmed cases (absolute values) (table of contents)
Confirmed cases (normalized by population size) (table of contents)
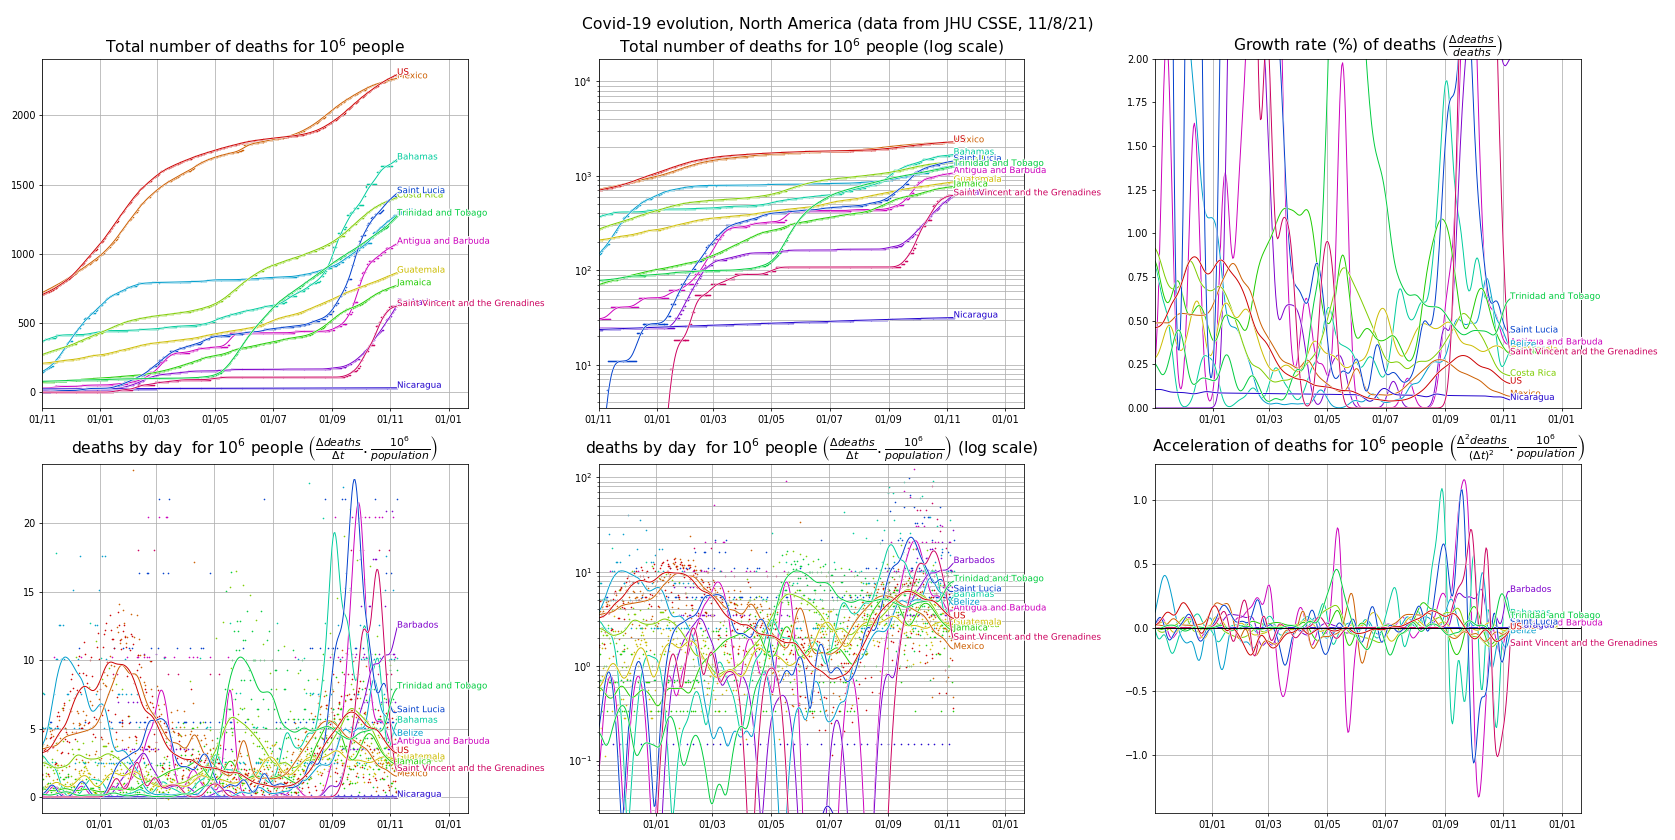
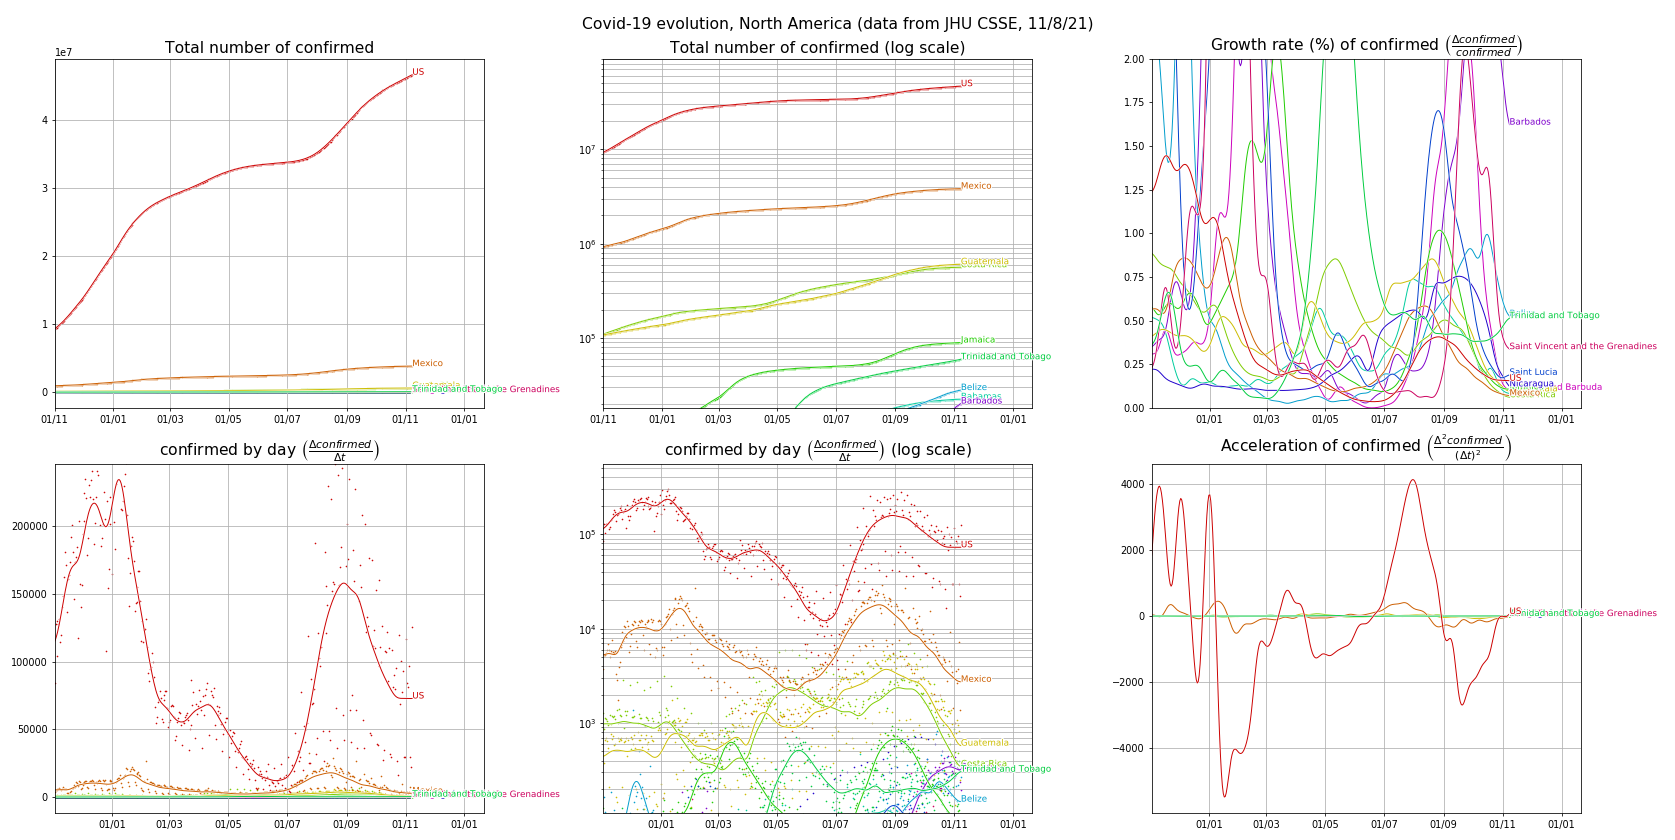
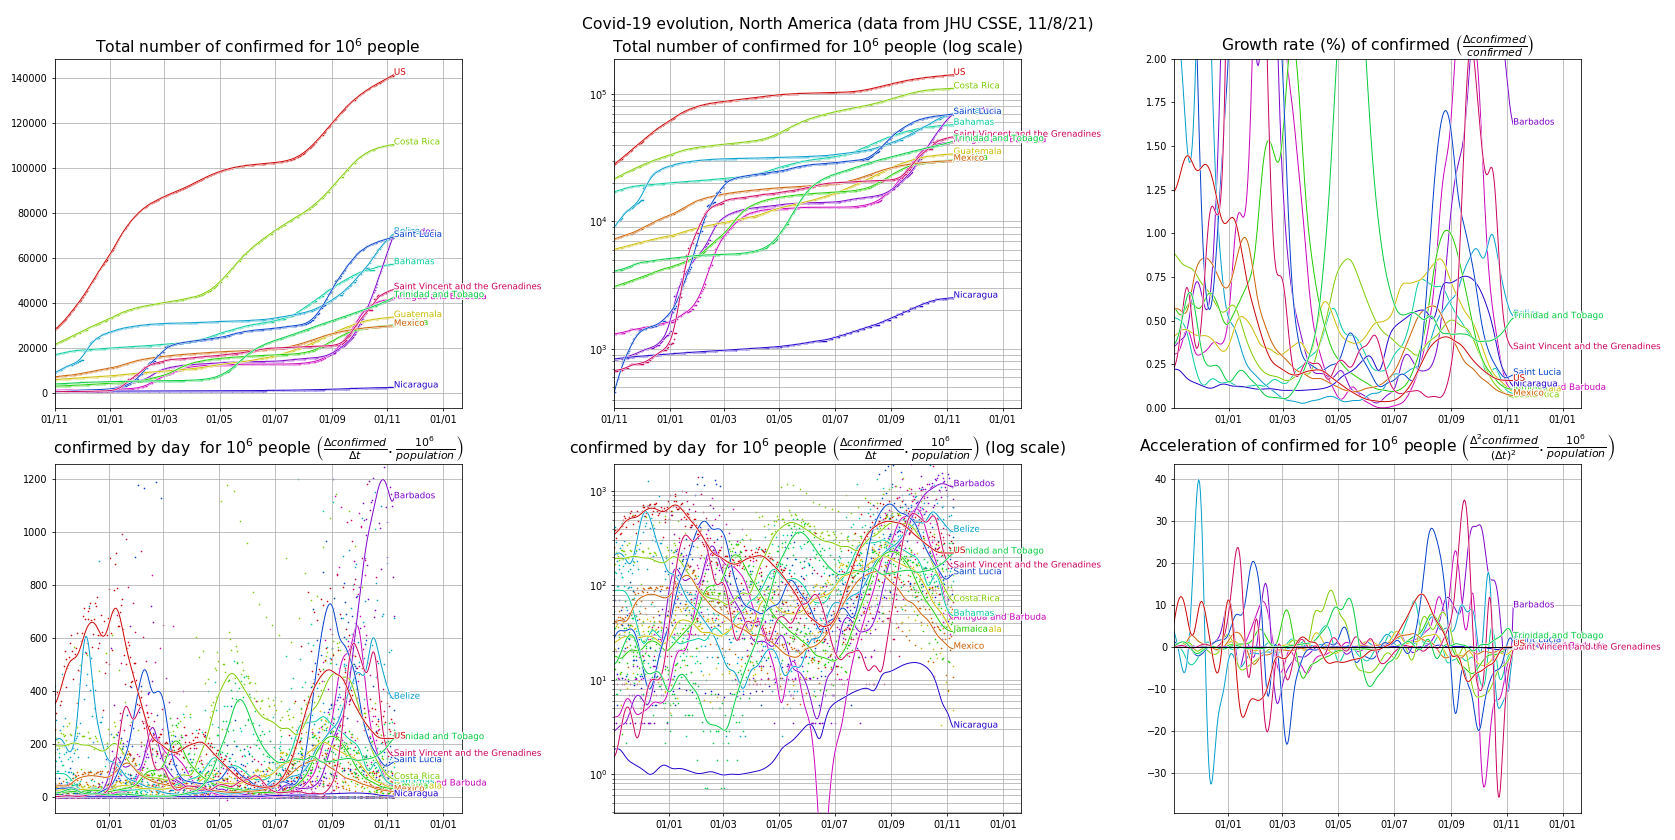
North America (table of contents)
- Deaths: absolute values, normalized by population size
- Confirmed cases: absolute values, normalized by population size
Deaths (absolute values) (table of contents)
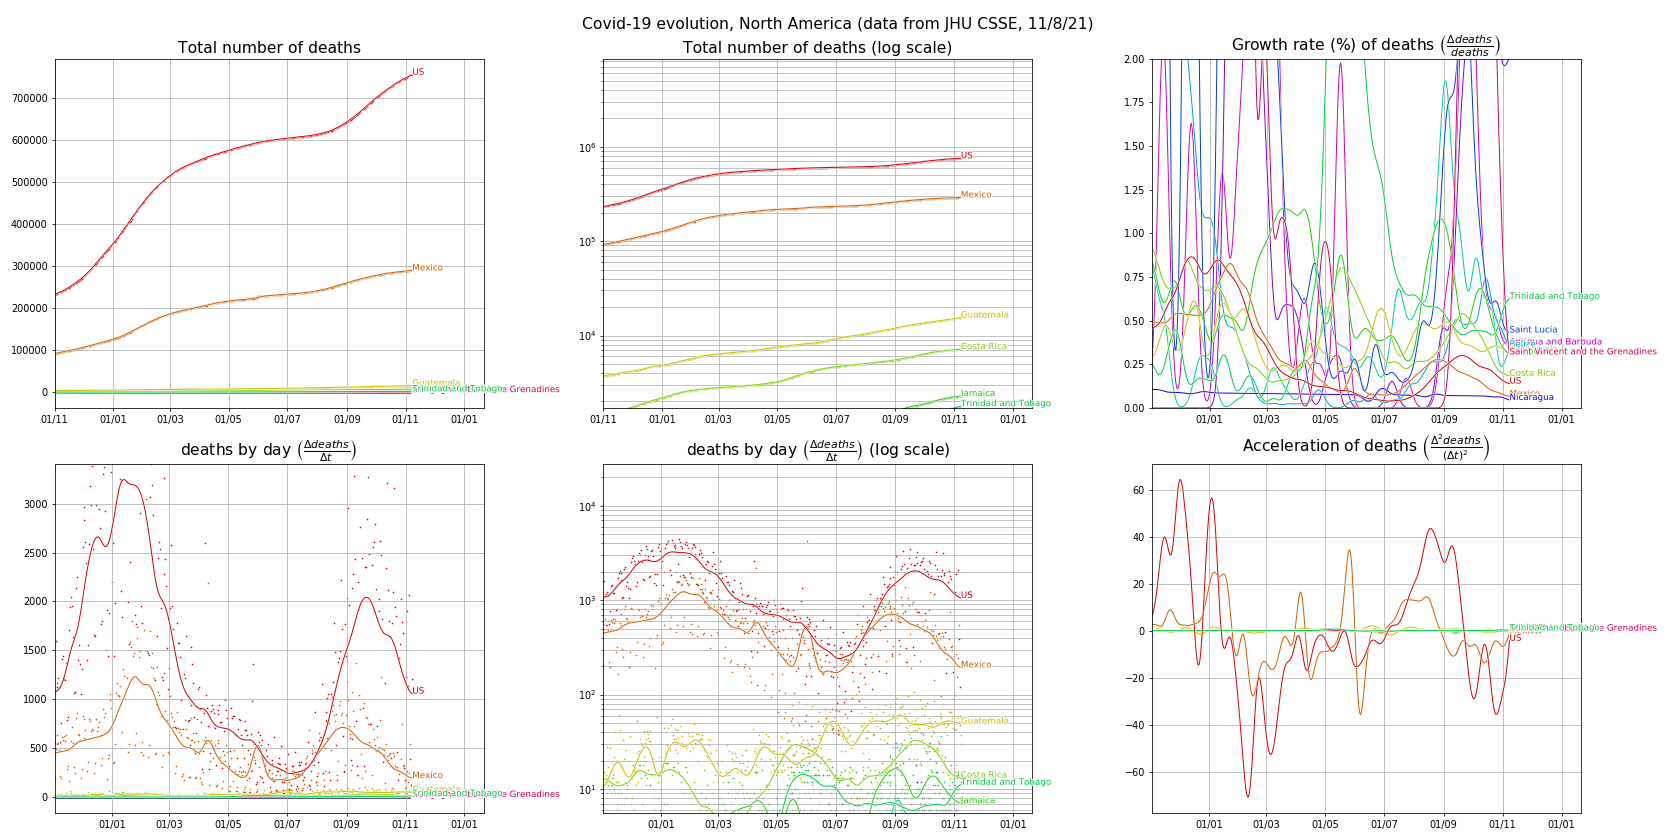

Deaths (normalized by population size) (table of contents)
Confirmed cases (absolute values) (table of contents)
Confirmed cases (normalized by population size) (table of contents)
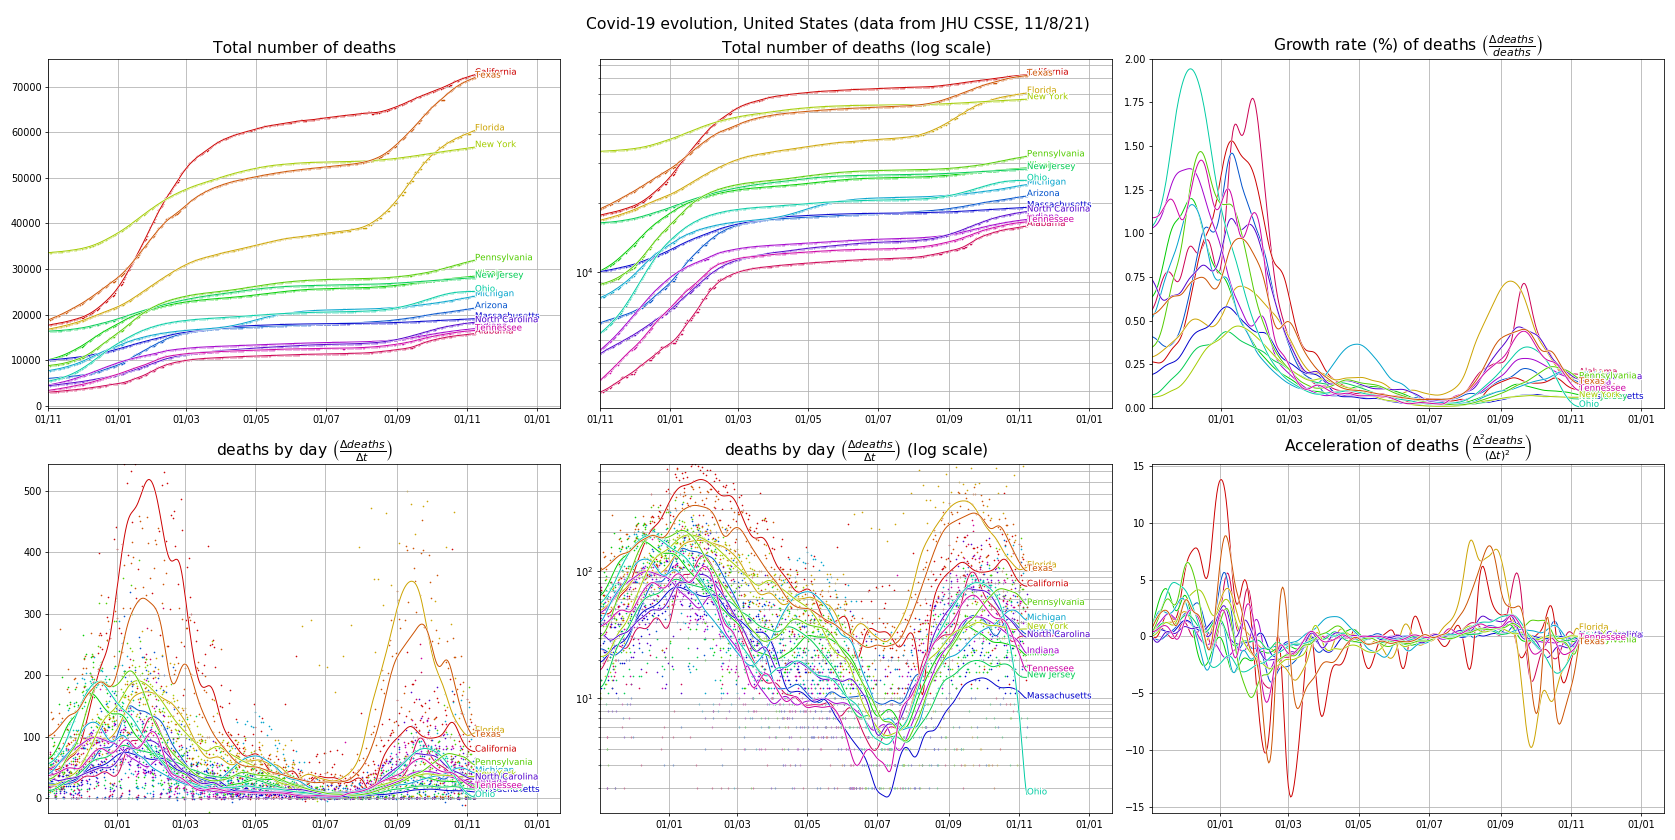
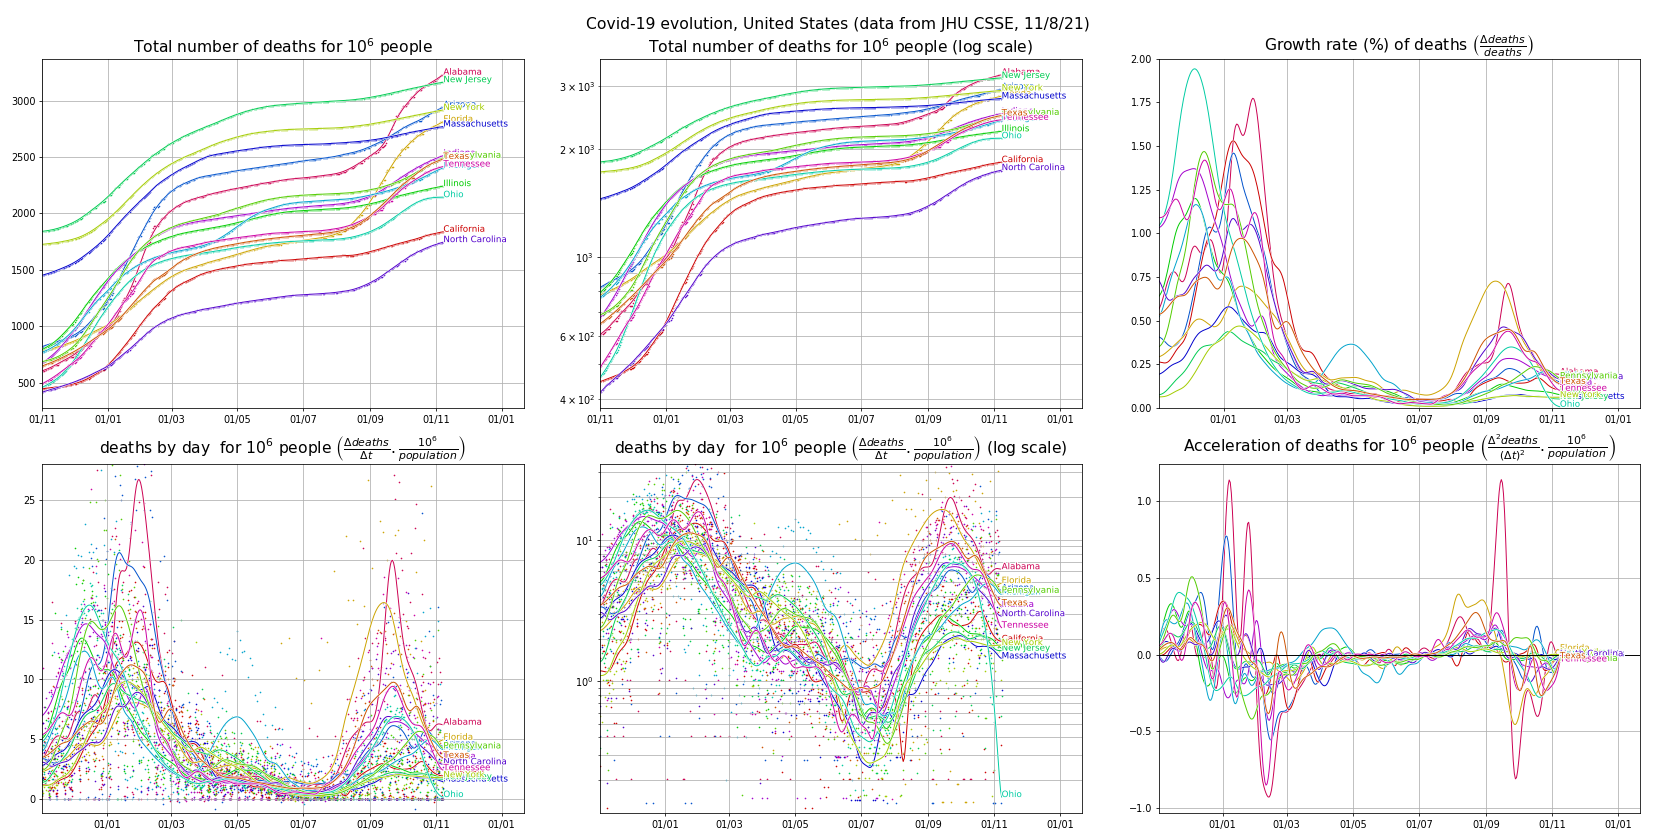
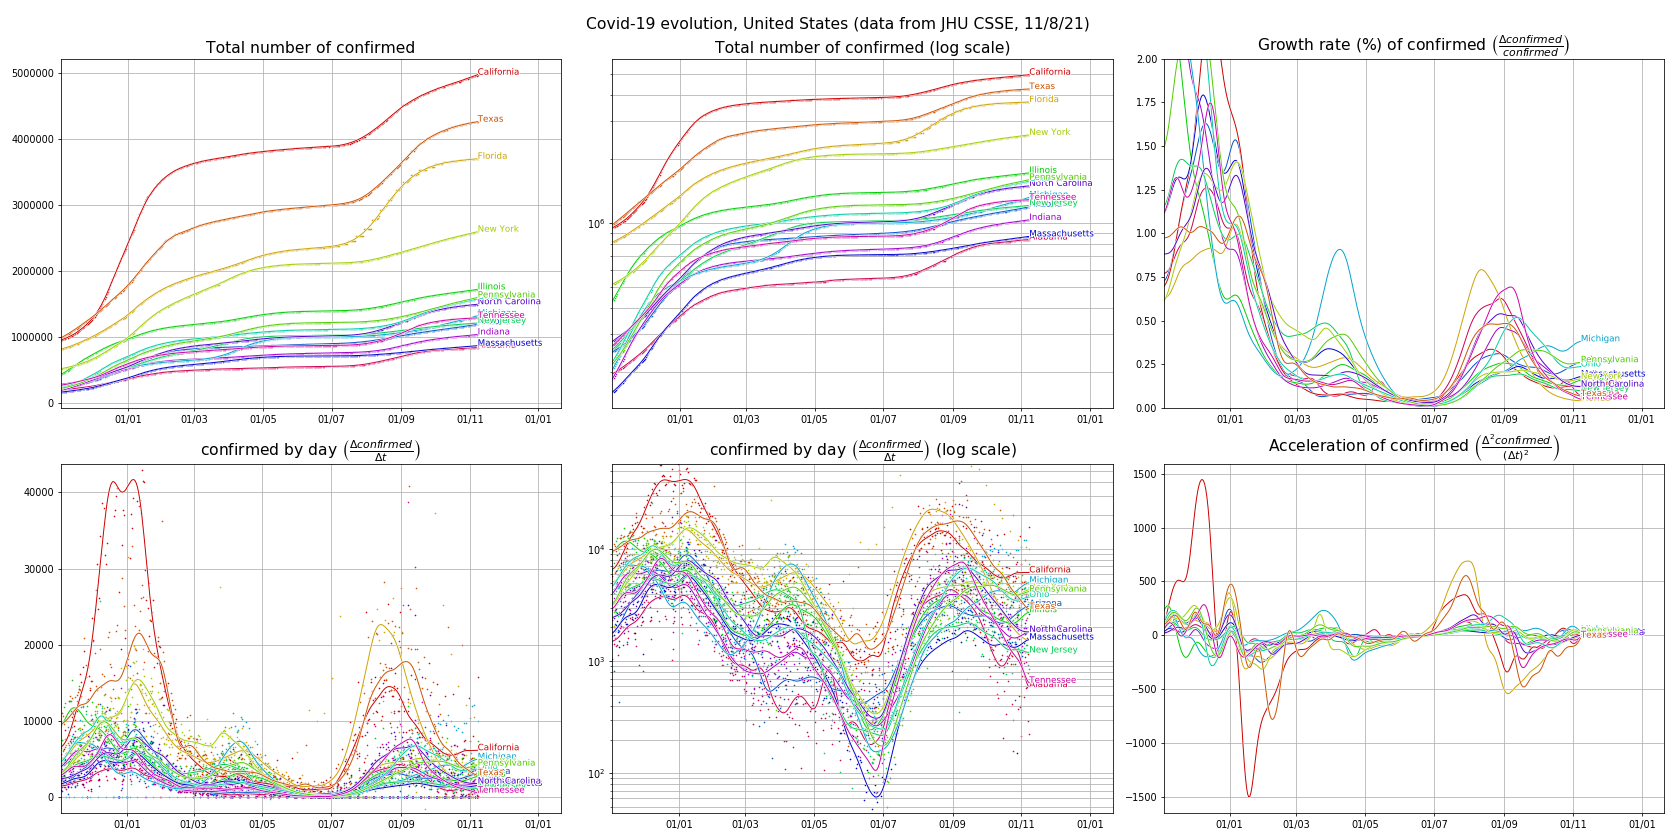
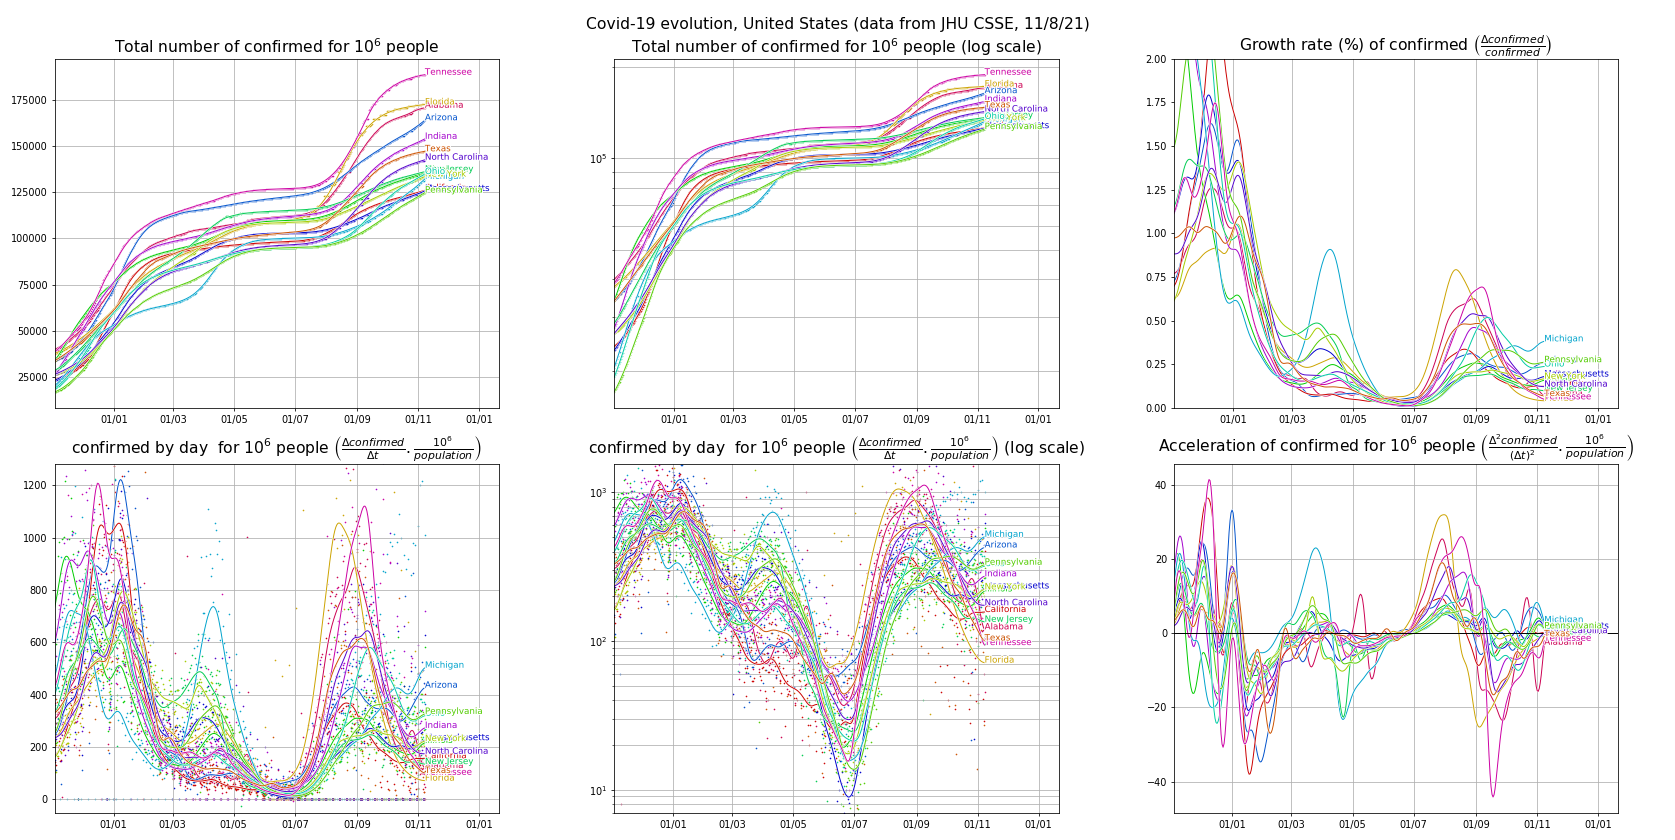
United States (table of contents)
- Deaths: absolute values, normalized by population size
- Confirmed cases: absolute values, normalized by population size
Deaths (absolute values) (table of contents)

Deaths (normalized by population size) (table of contents)
Confirmed cases (absolute values) (table of contents)
Confirmed cases (normalized by population size) (table of contents)
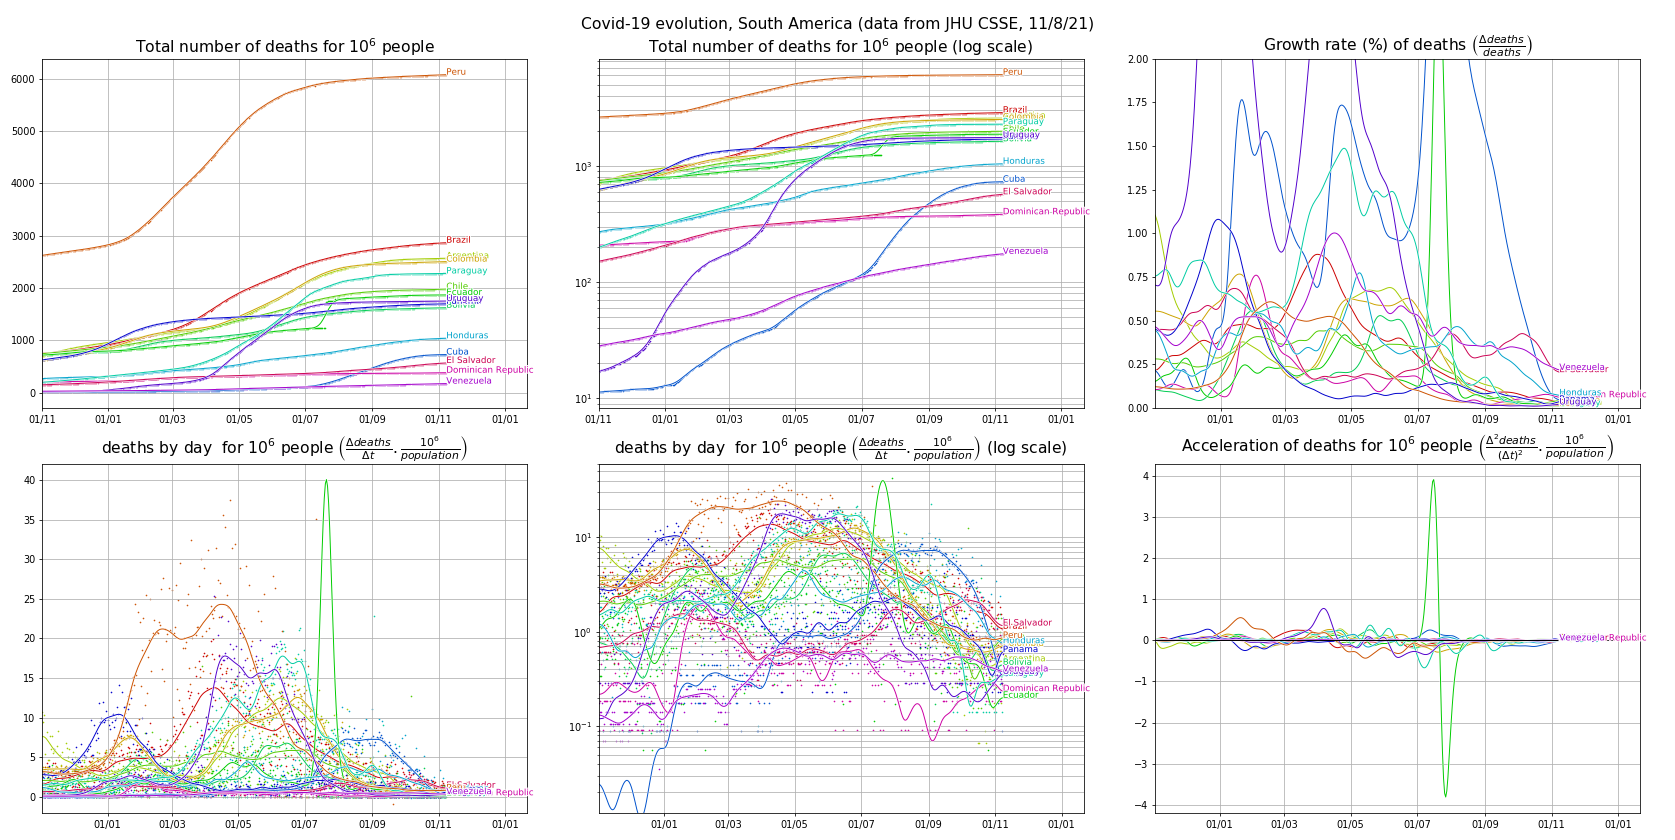
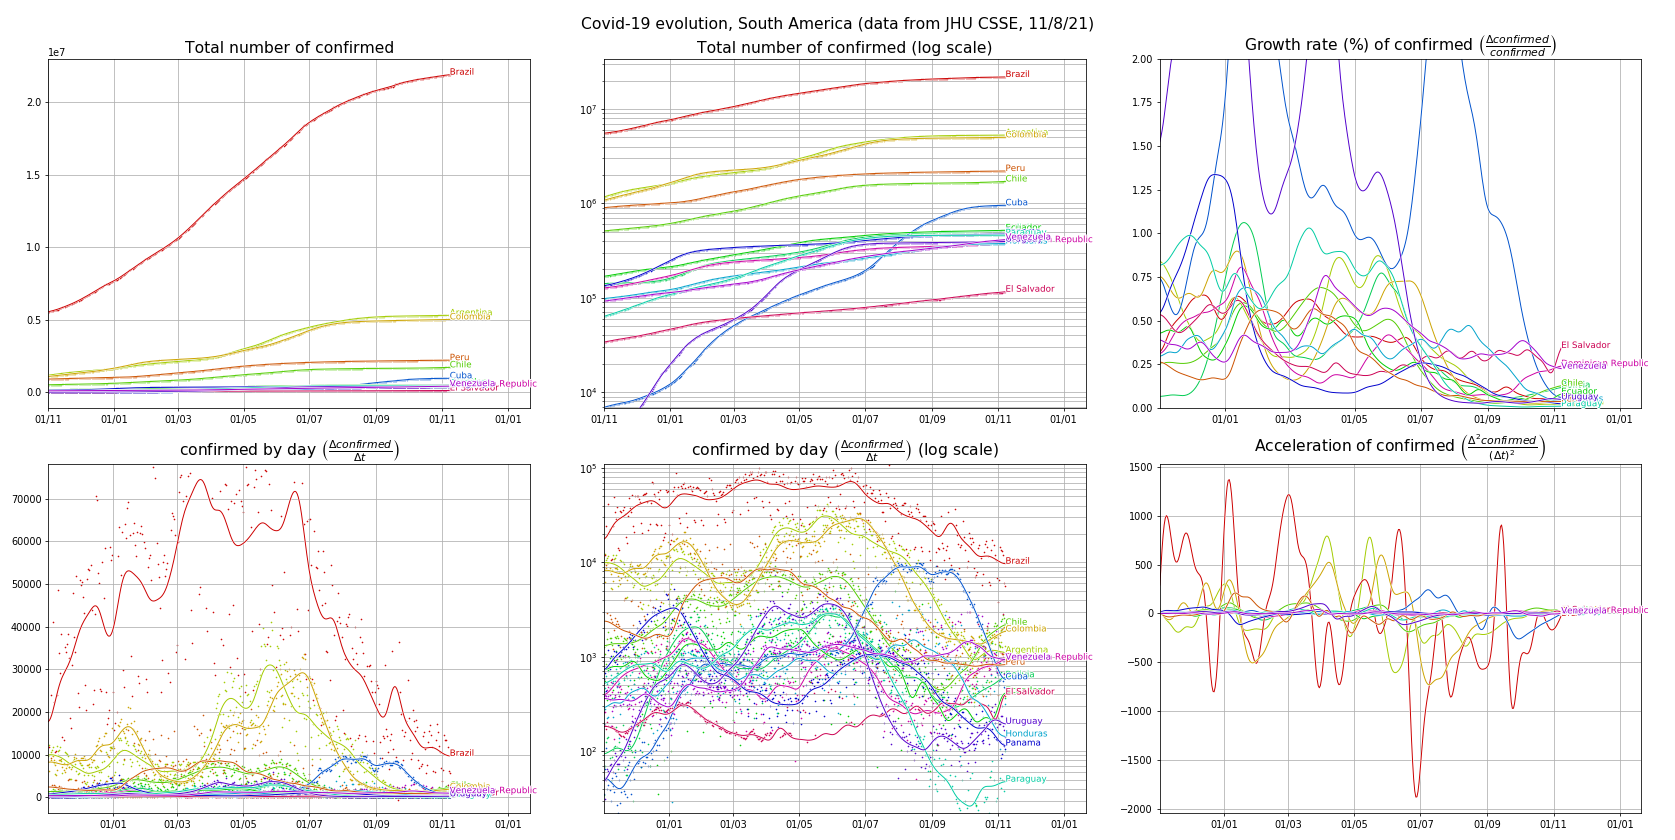
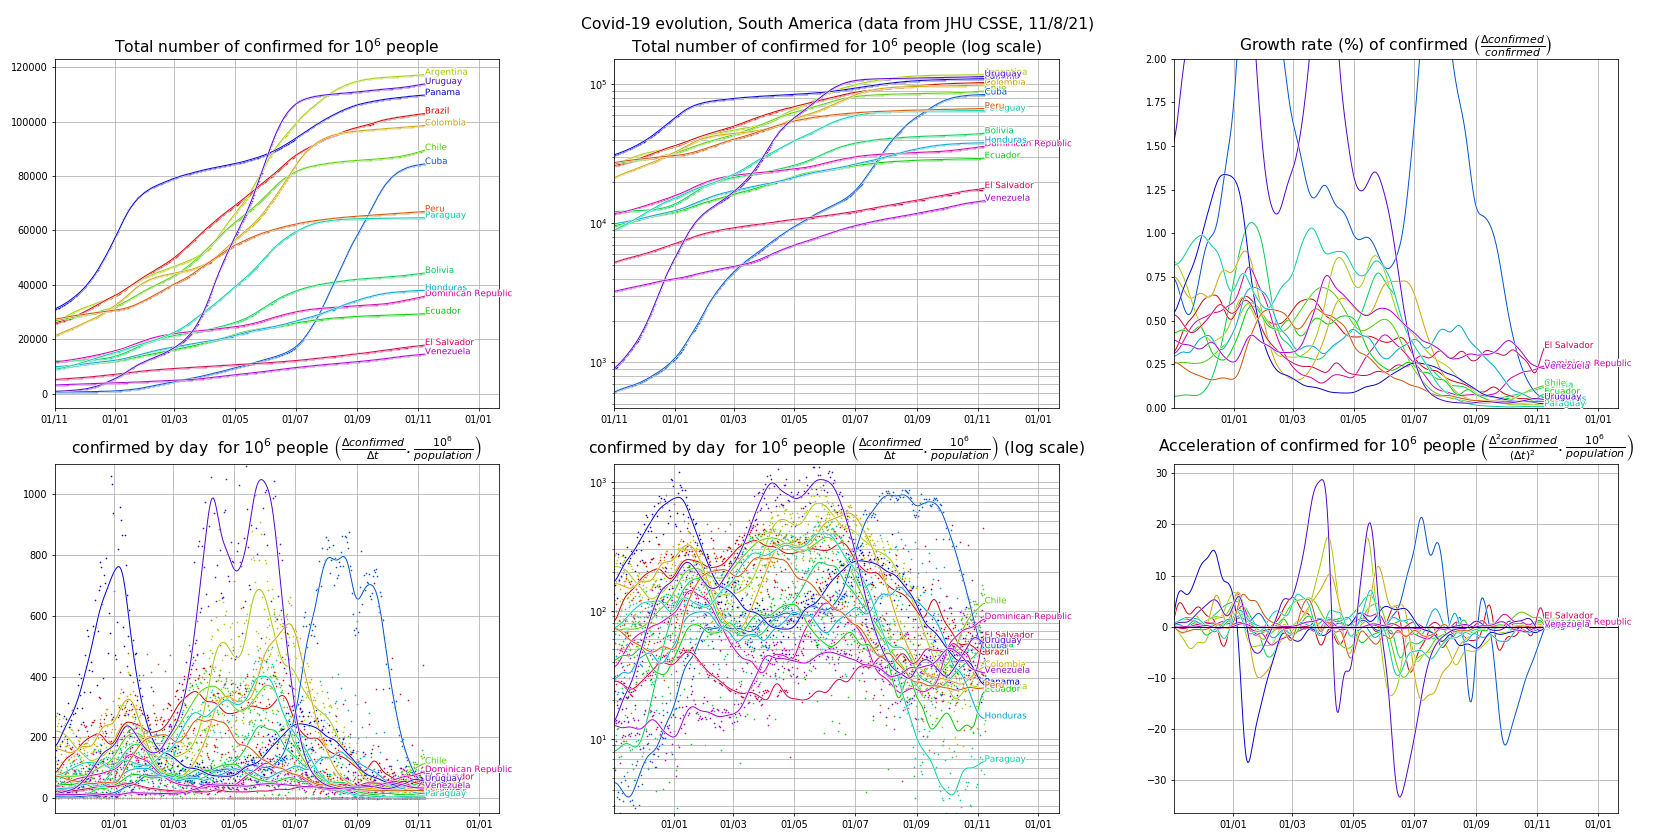
South America (table of contents)
- Deaths: absolute values, normalized by population size
- Confirmed cases: absolute values, normalized by population size
Deaths (absolute values) (table of contents)
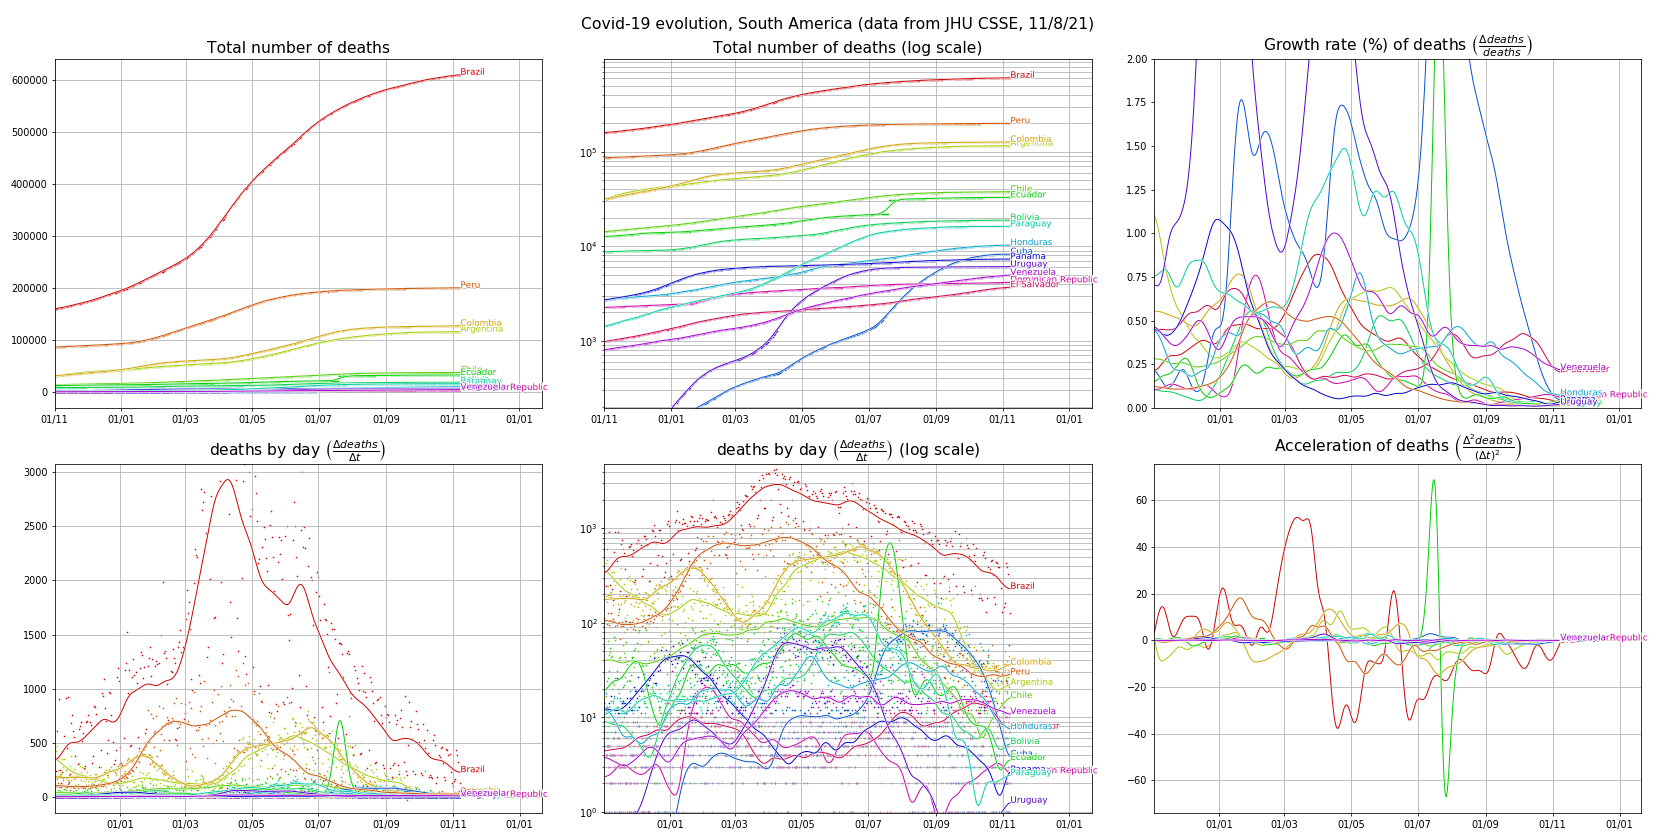

Deaths (normalized by population size) (table of contents)
Confirmed cases (absolute values) (table of contents)
Confirmed cases (normalized by population size) (table of contents)
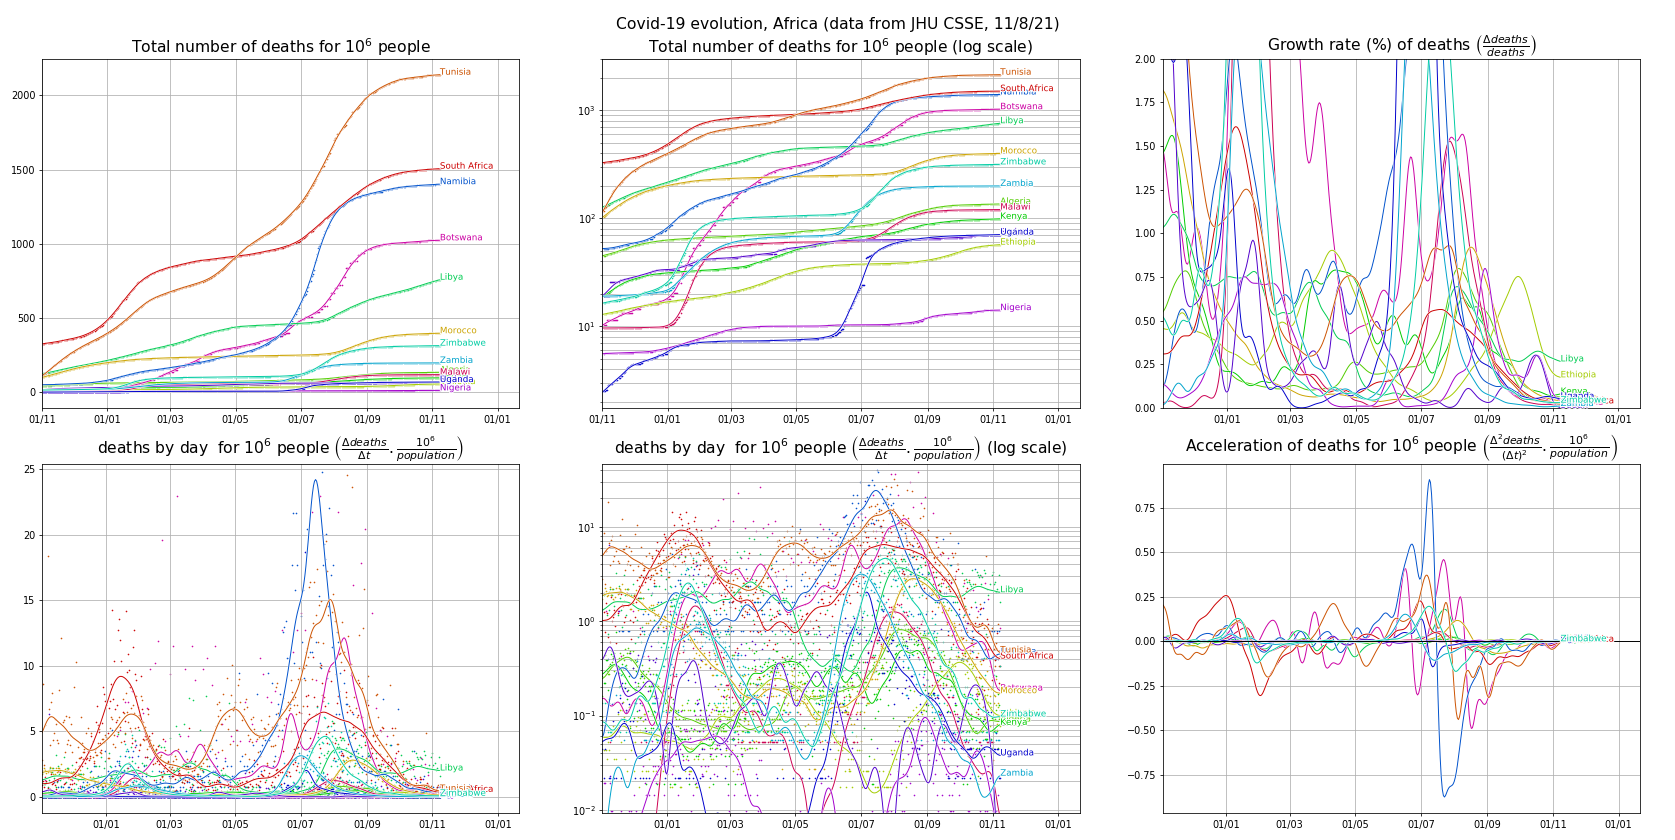
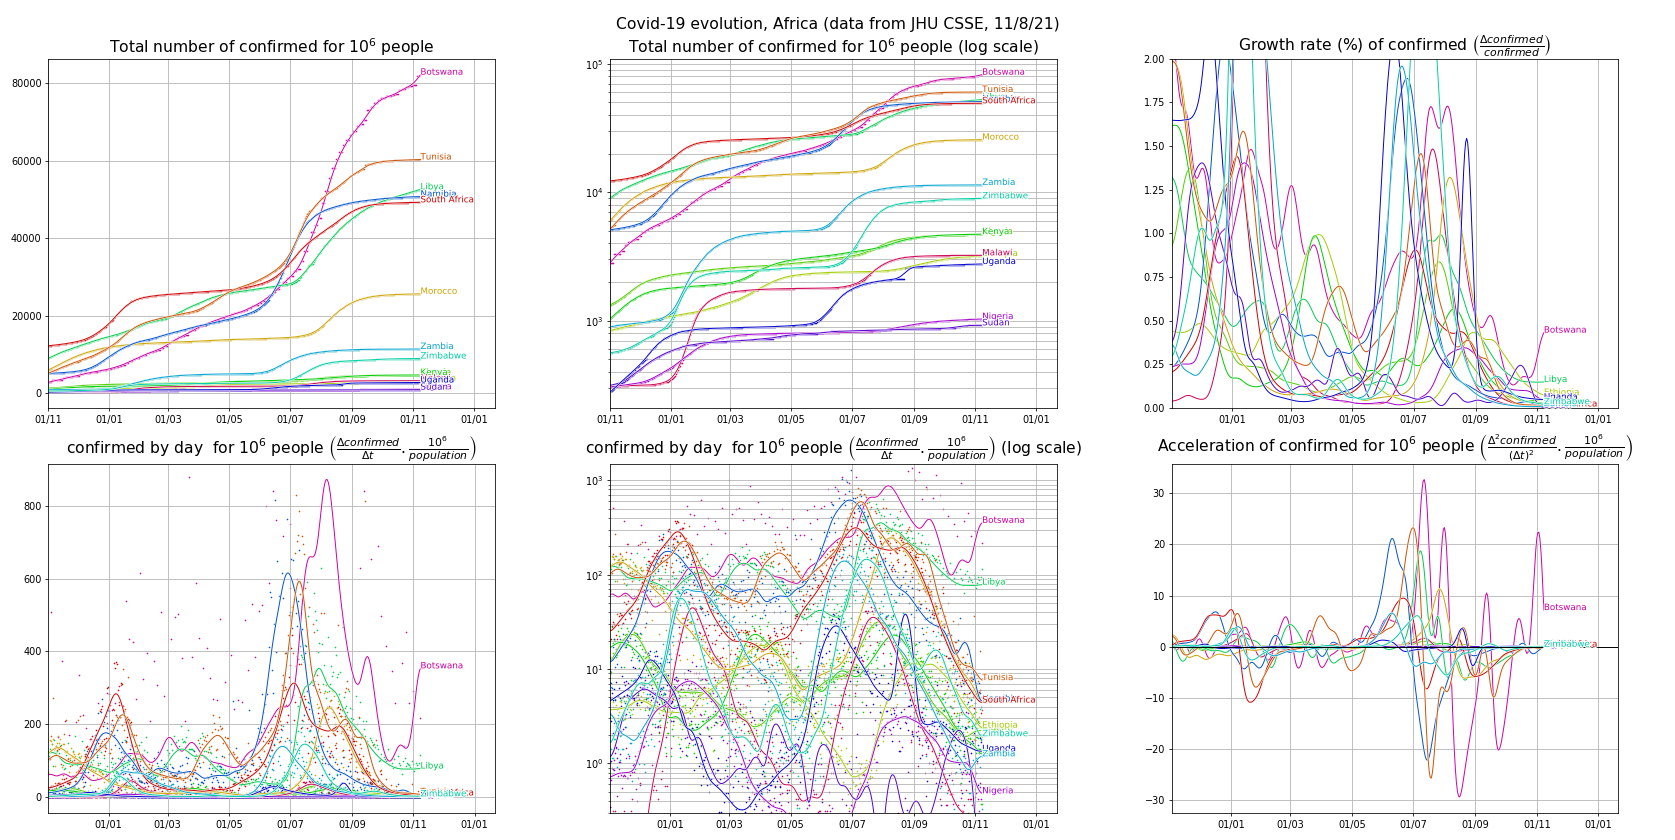
Africa (table of contents)
- Deaths: absolute values, normalized by population size
- Confirmed cases: absolute values, normalized by population size
Deaths (absolute values) (table of contents)
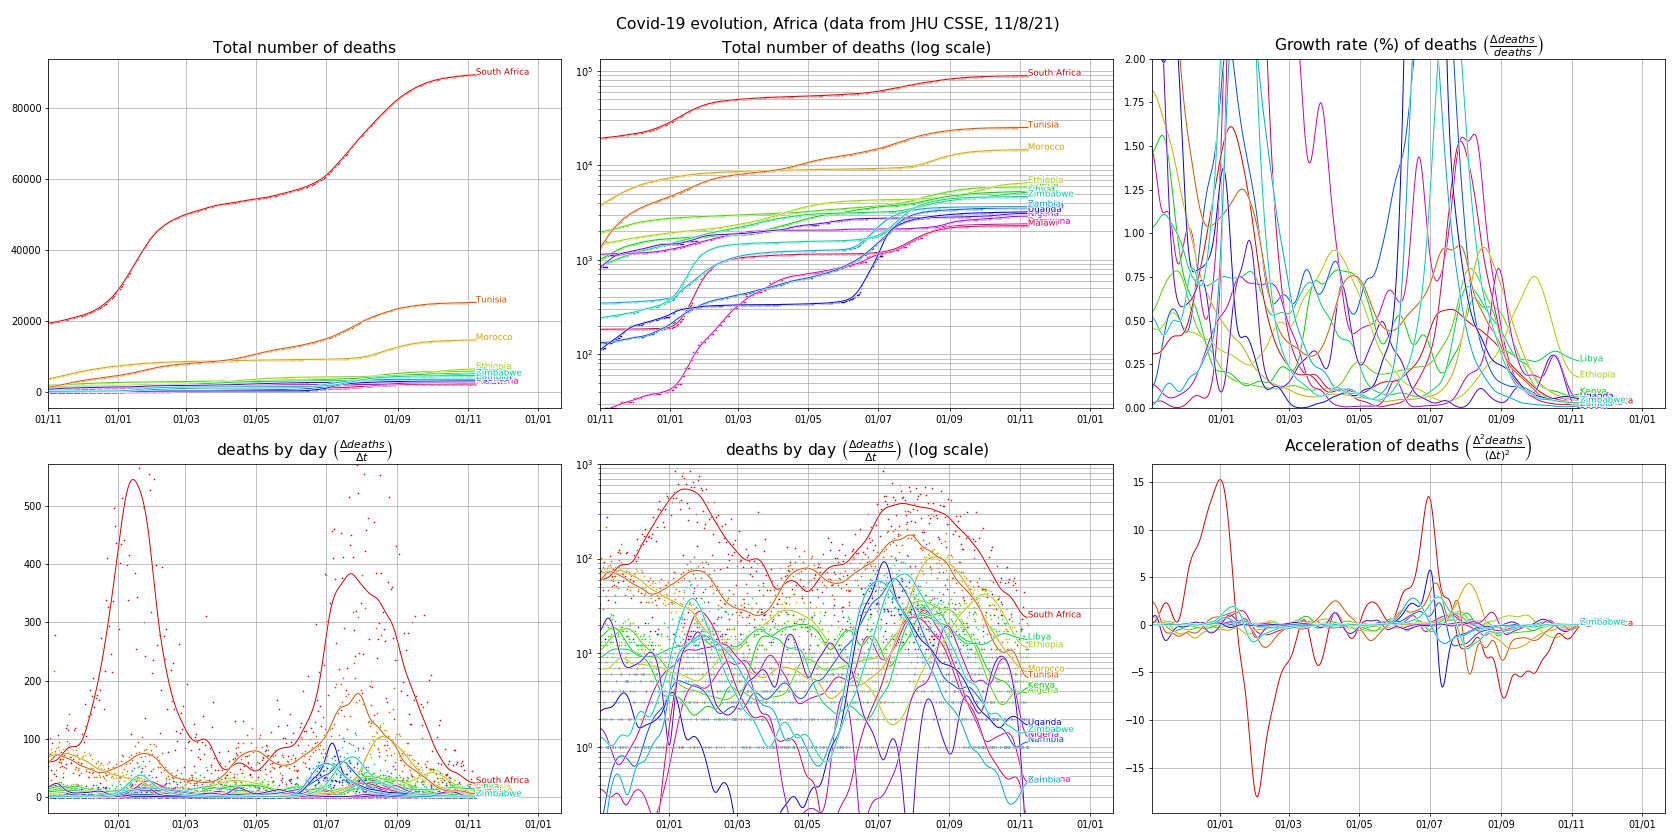

Deaths (normalized by population size) (table of contents)
Confirmed cases (absolute values) (table of contents)
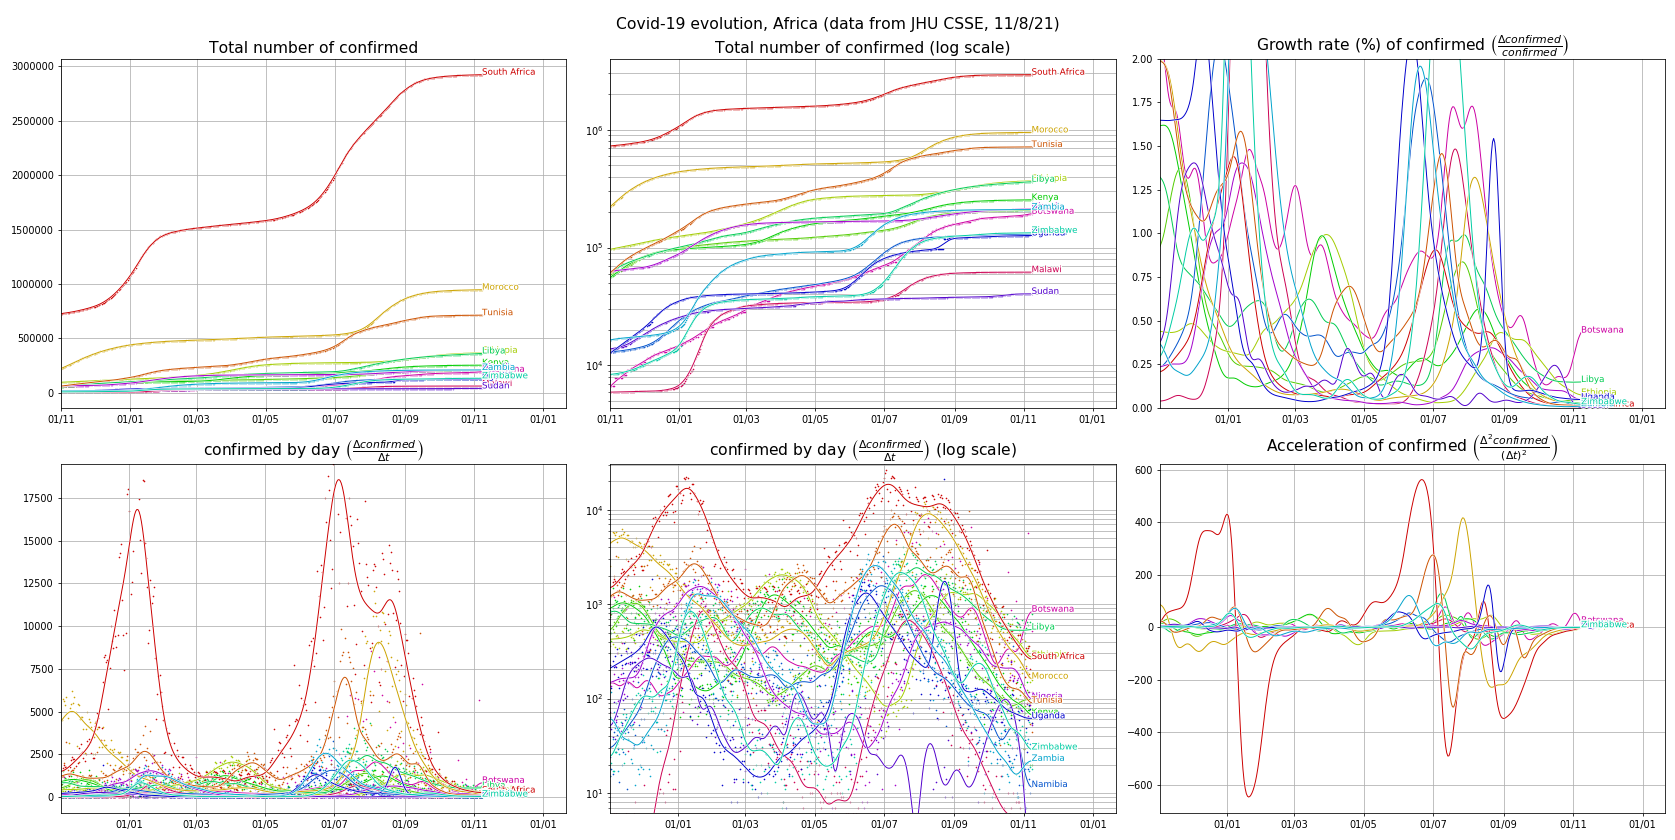
Confirmed cases (normalized by population size) (table of contents)
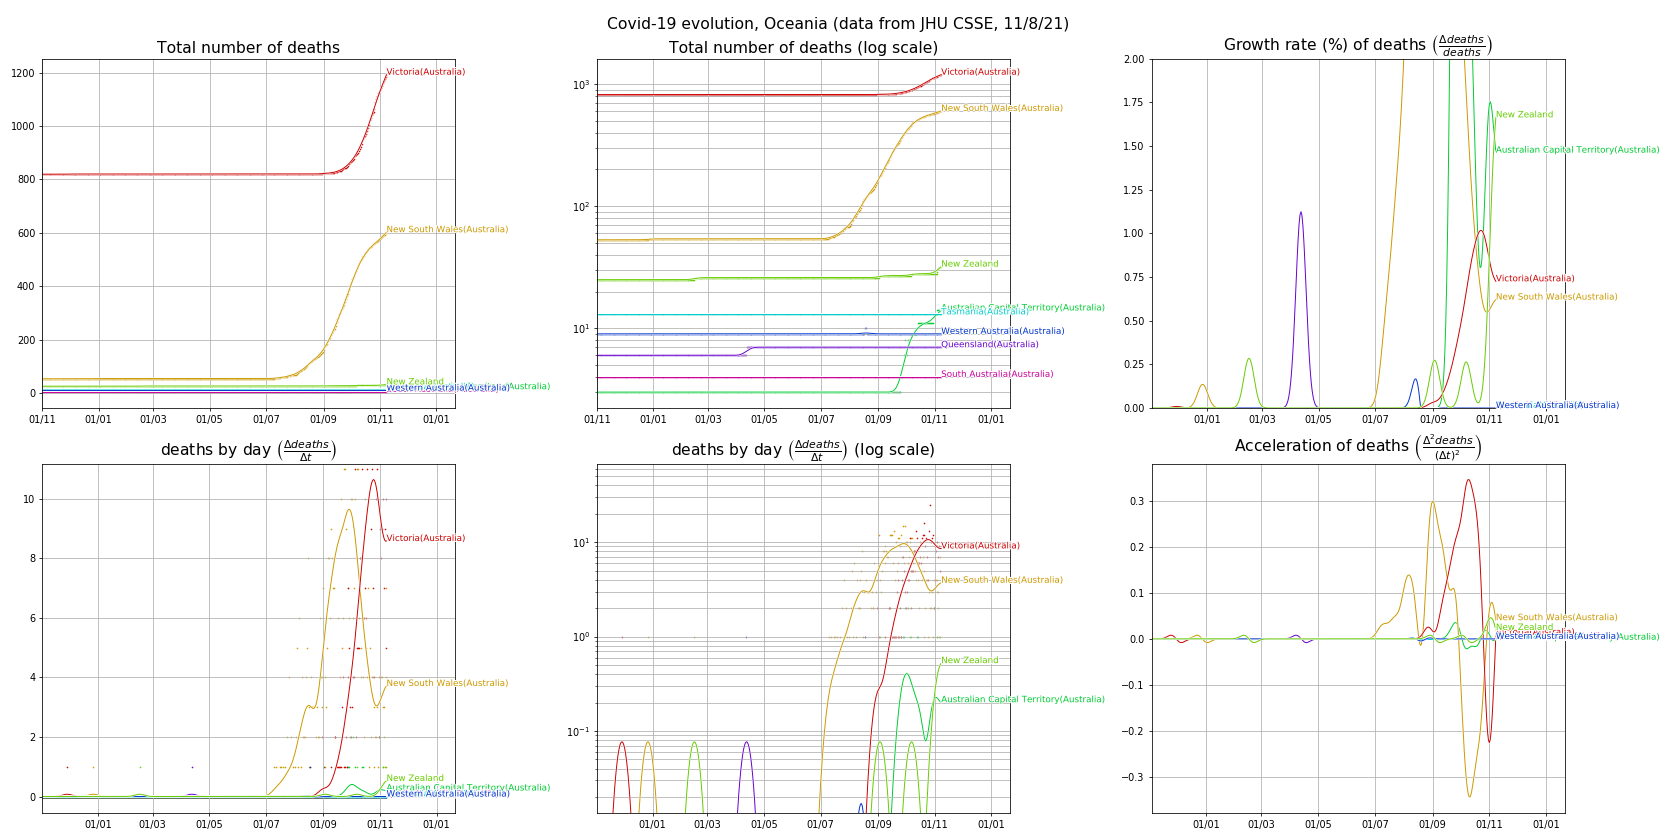
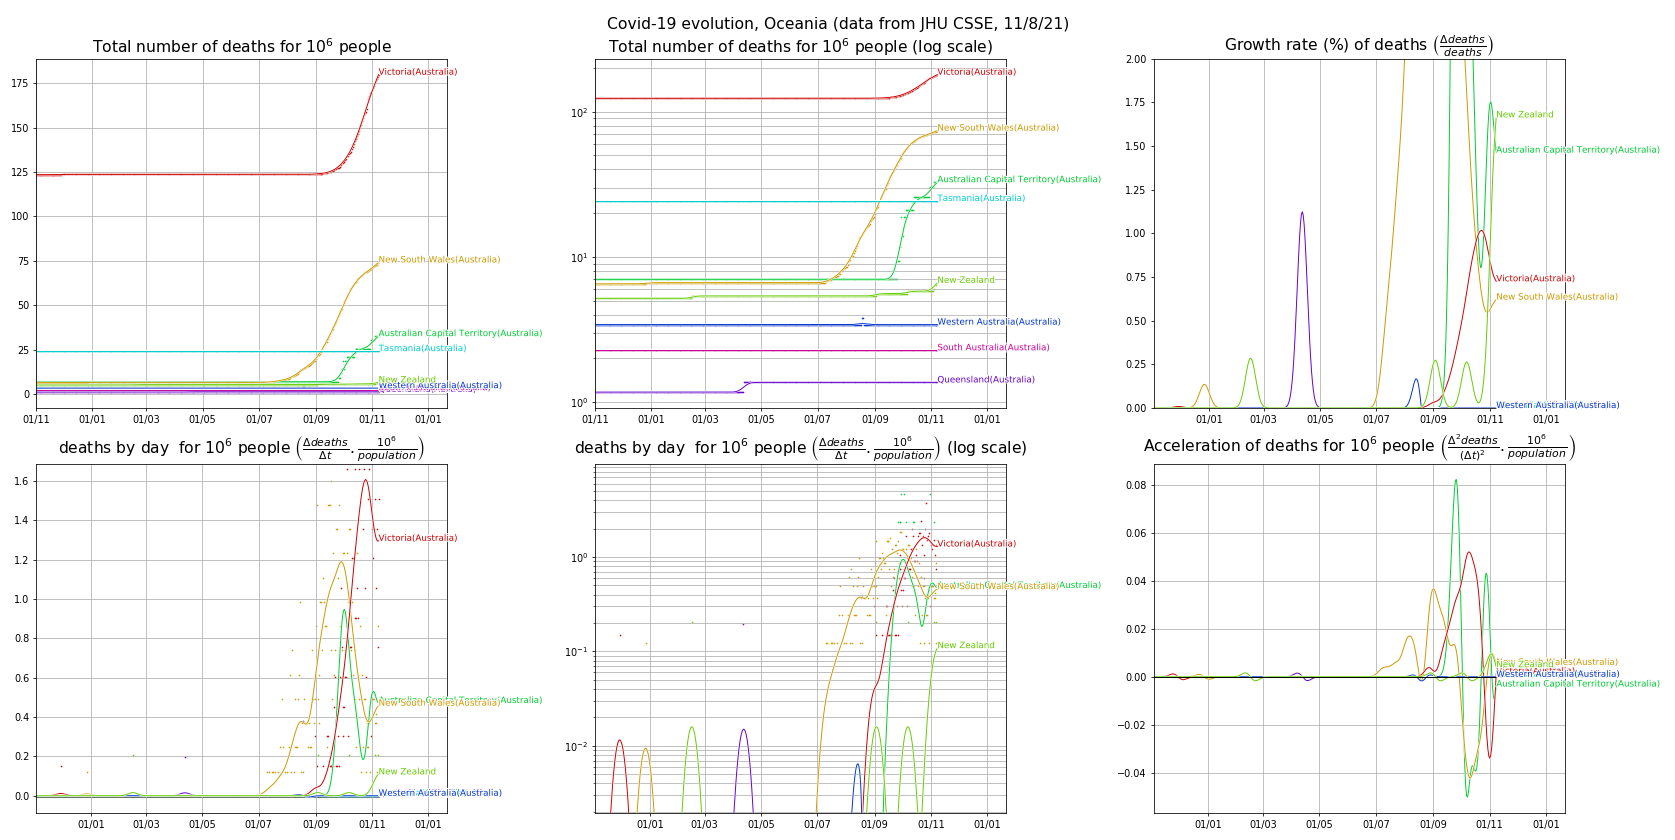
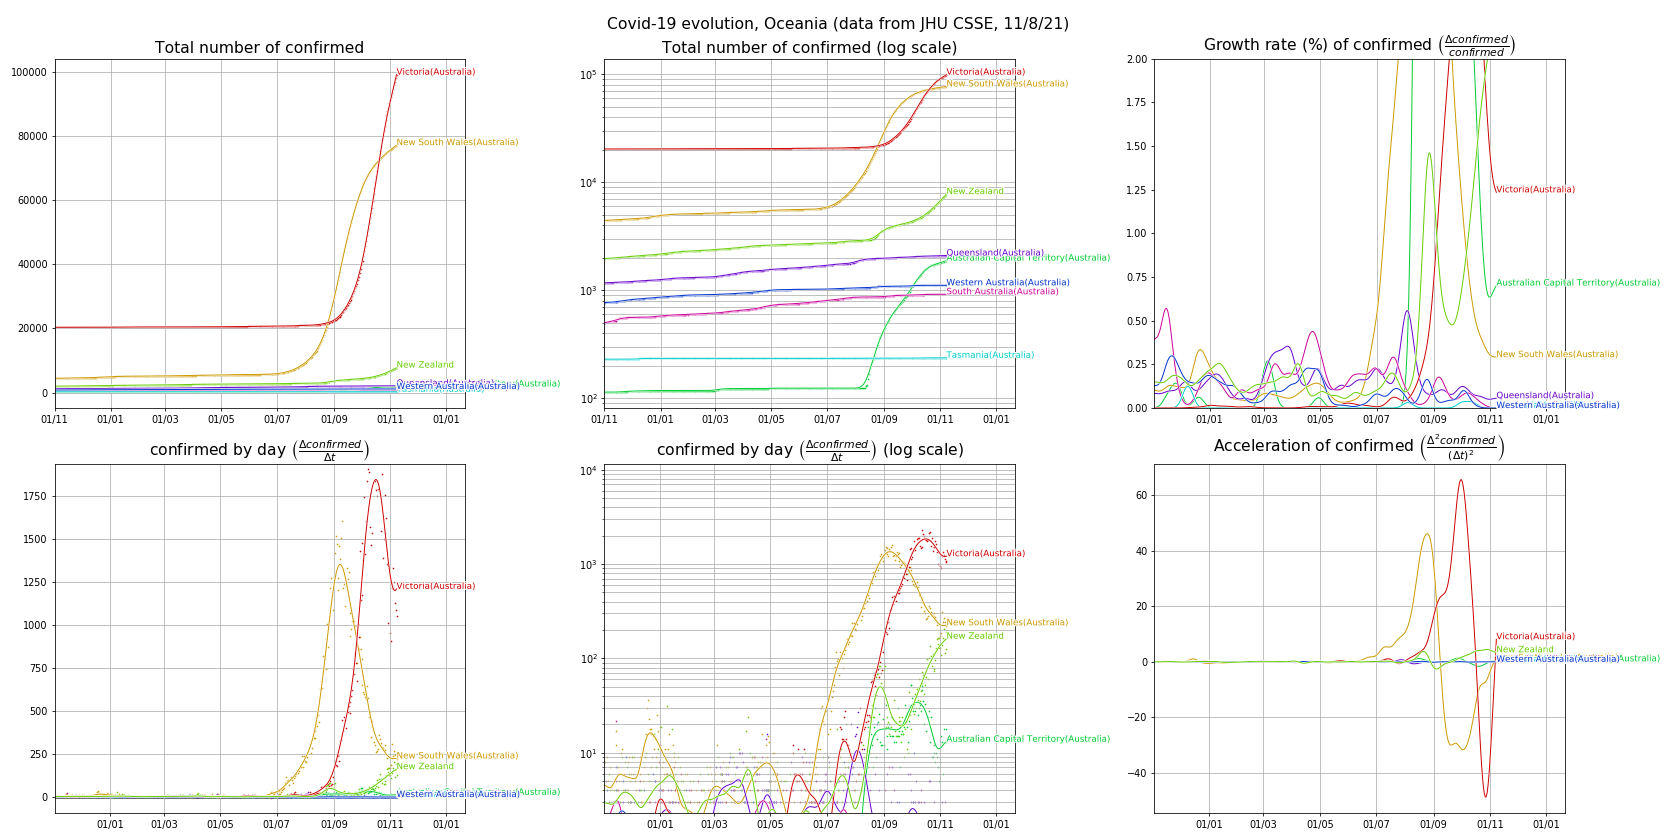
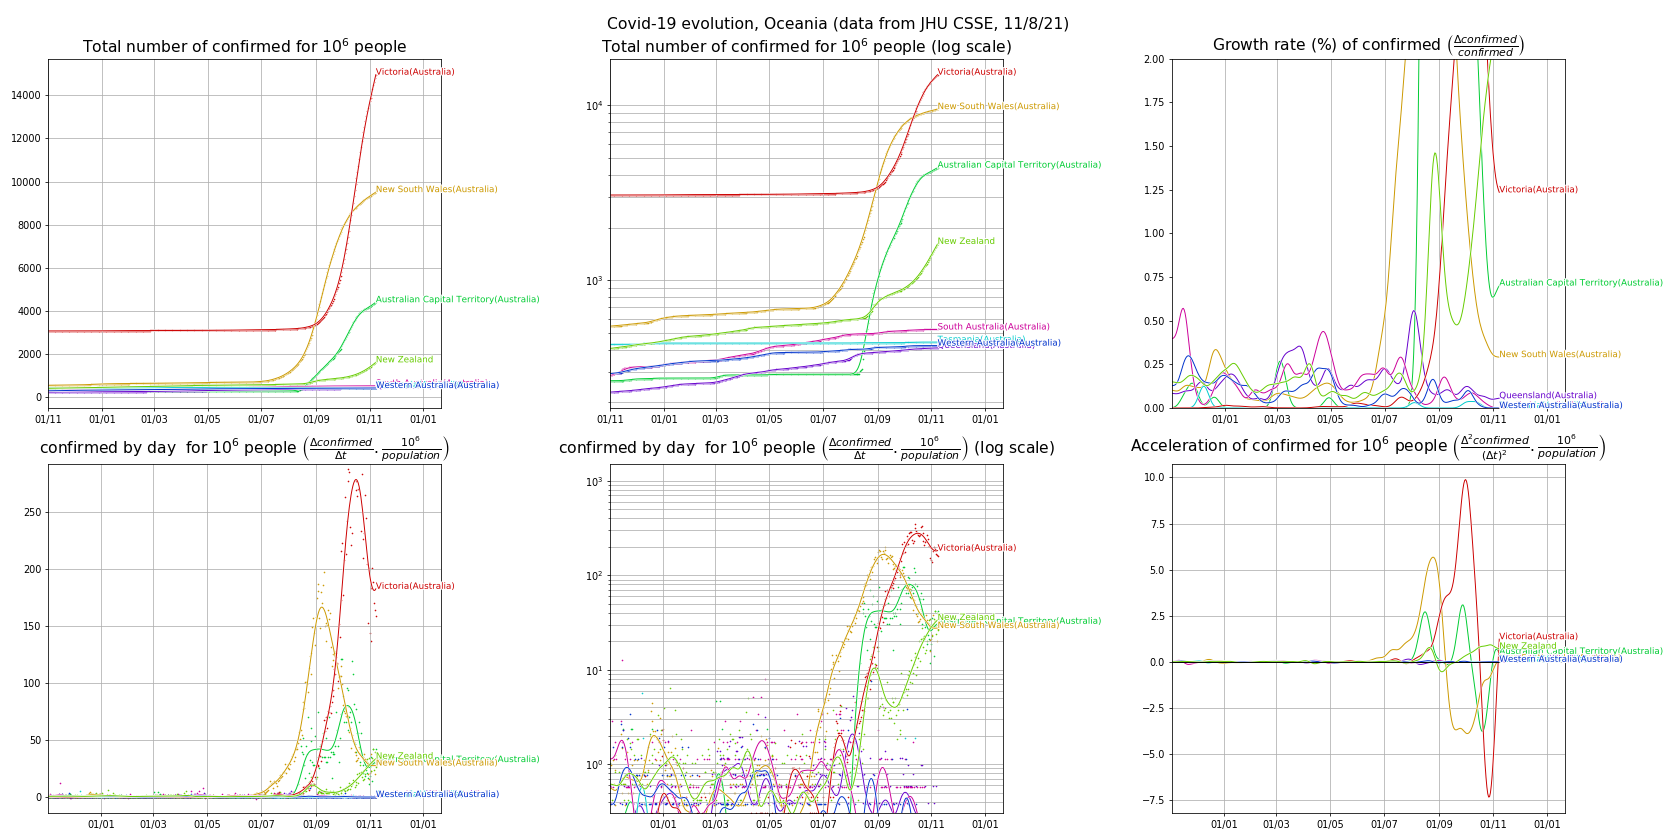
Oceania (table of contents)
- Deaths: absolute values, normalized by population size
- Confirmed cases: absolute values, normalized by population size
Deaths (absolute values) (table of contents)

Deaths (normalized by population size) (table of contents)
Confirmed cases (absolute values) (table of contents)
Confirmed cases (normalized by population size) (table of contents)
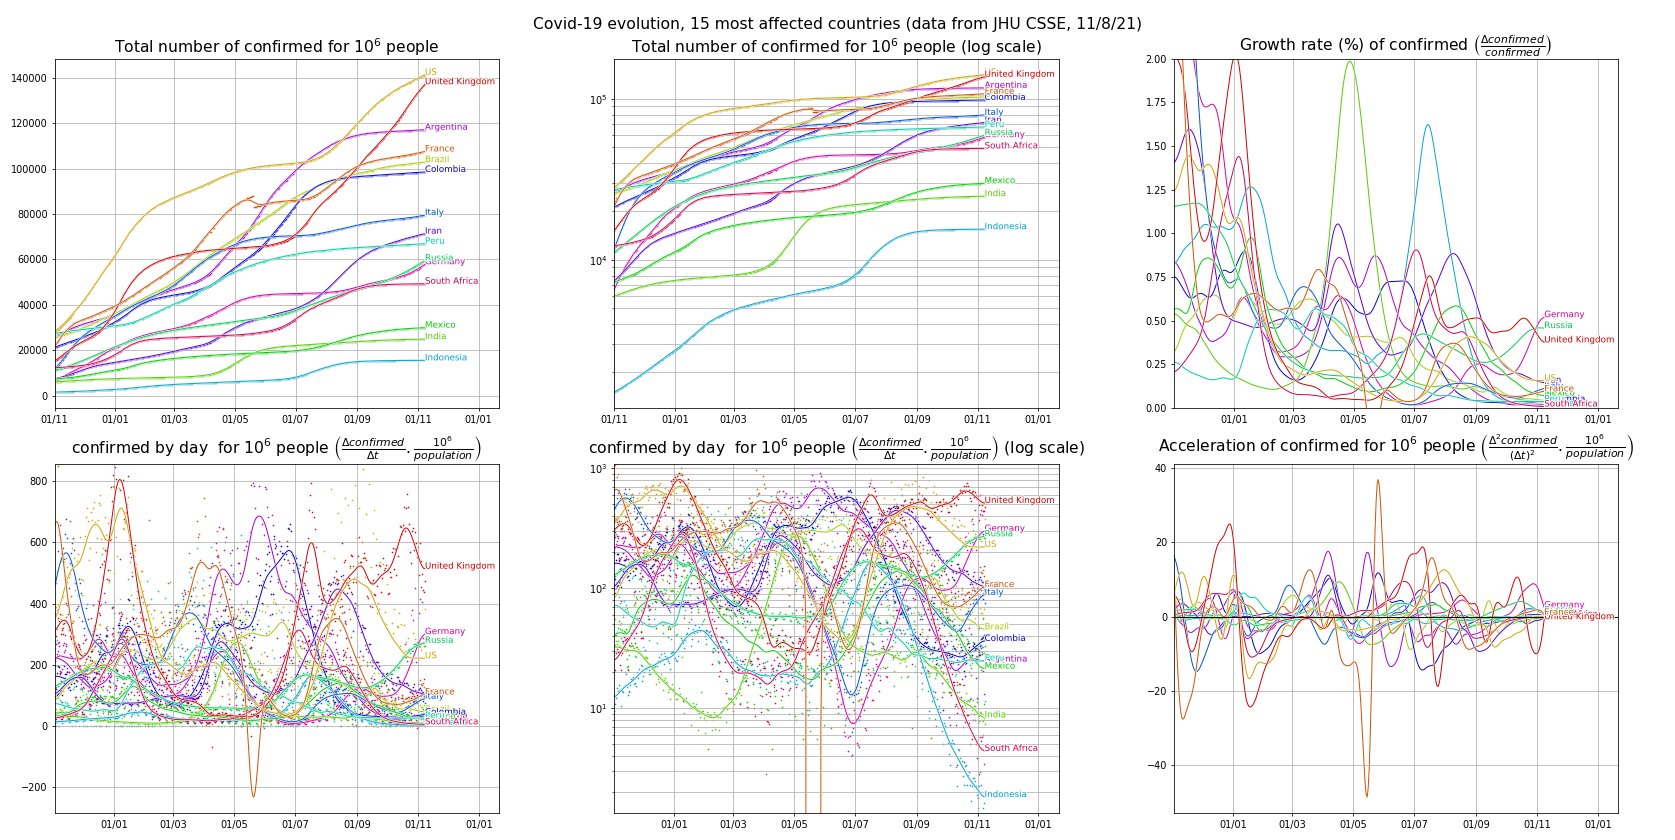
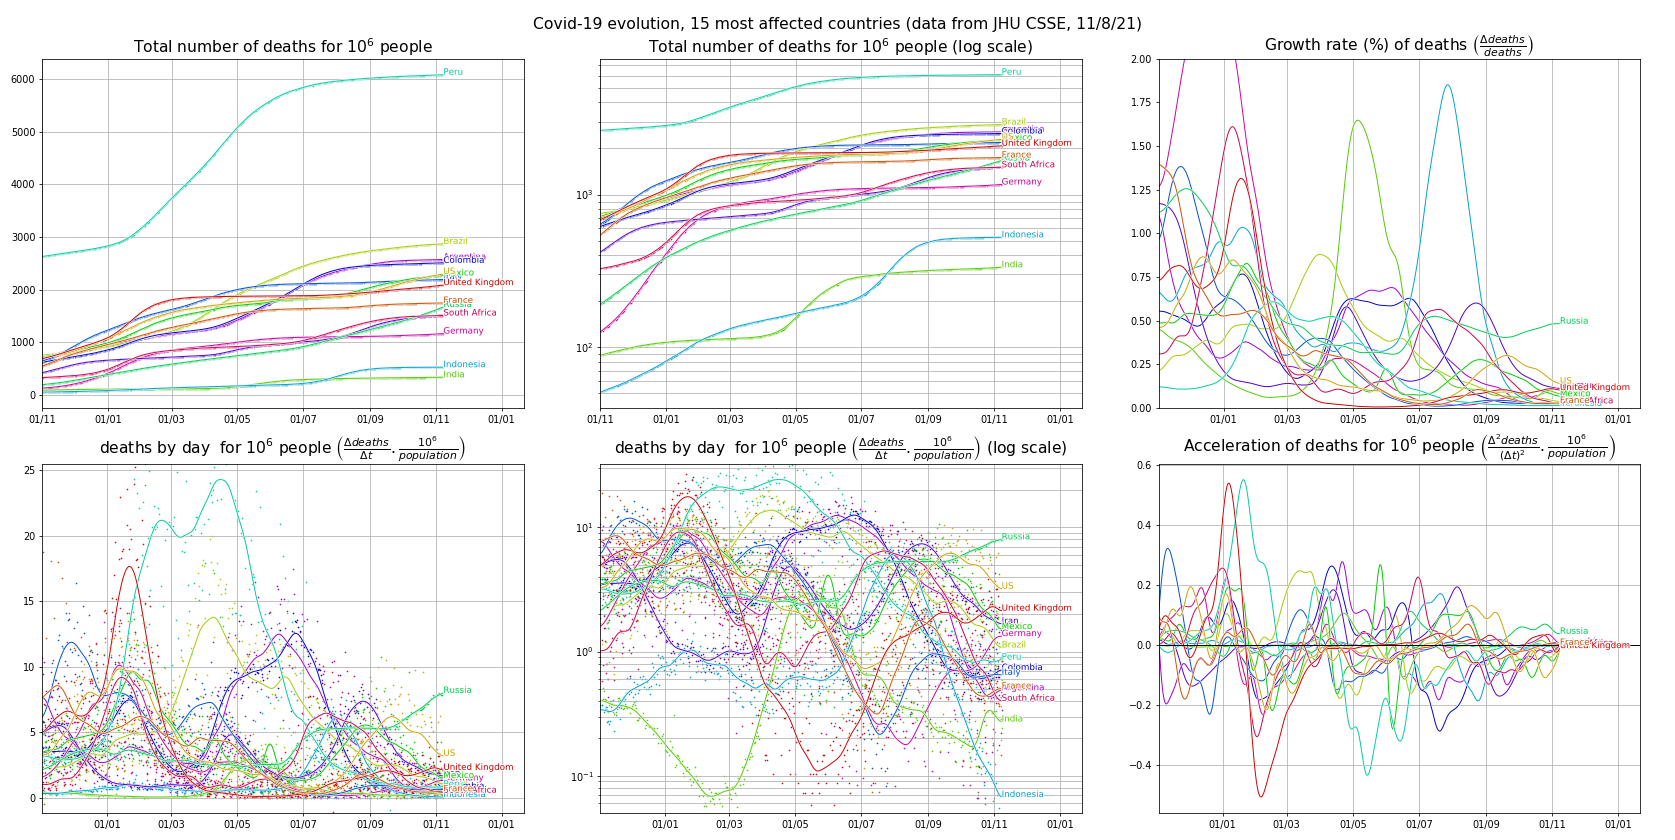
15 countries with the most deaths (table of contents)
- Deaths: absolute values, normalized by population size
- Confirmed cases: absolute values, normalized by population size
Deaths (absolute values) (table of contents)
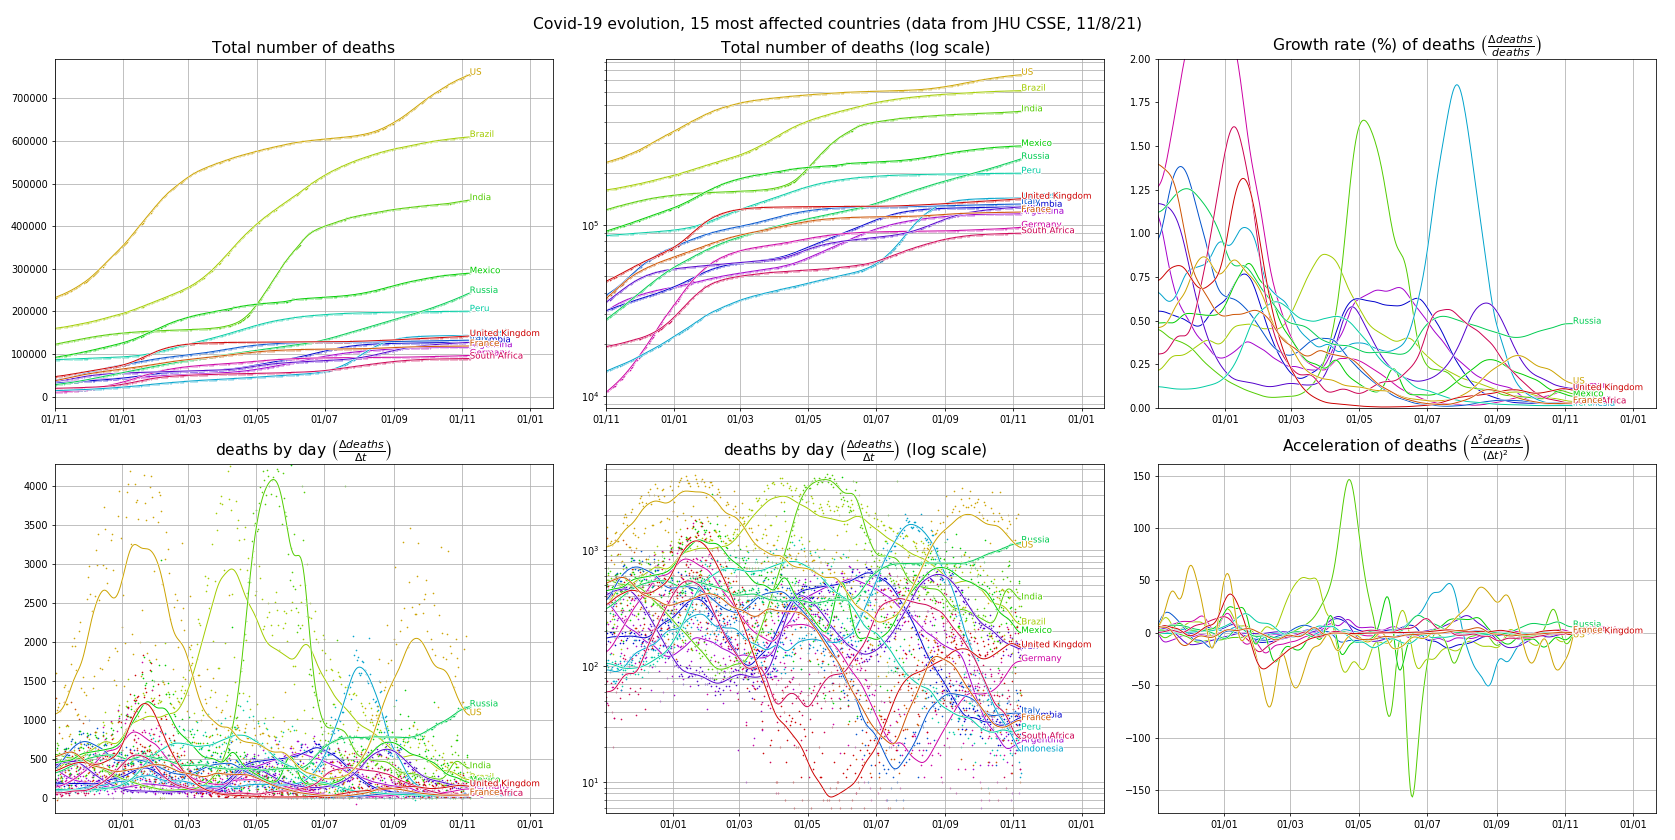

Deaths (normalized by population size) (table of contents)
Confirmed cases (absolute values) (table of contents)
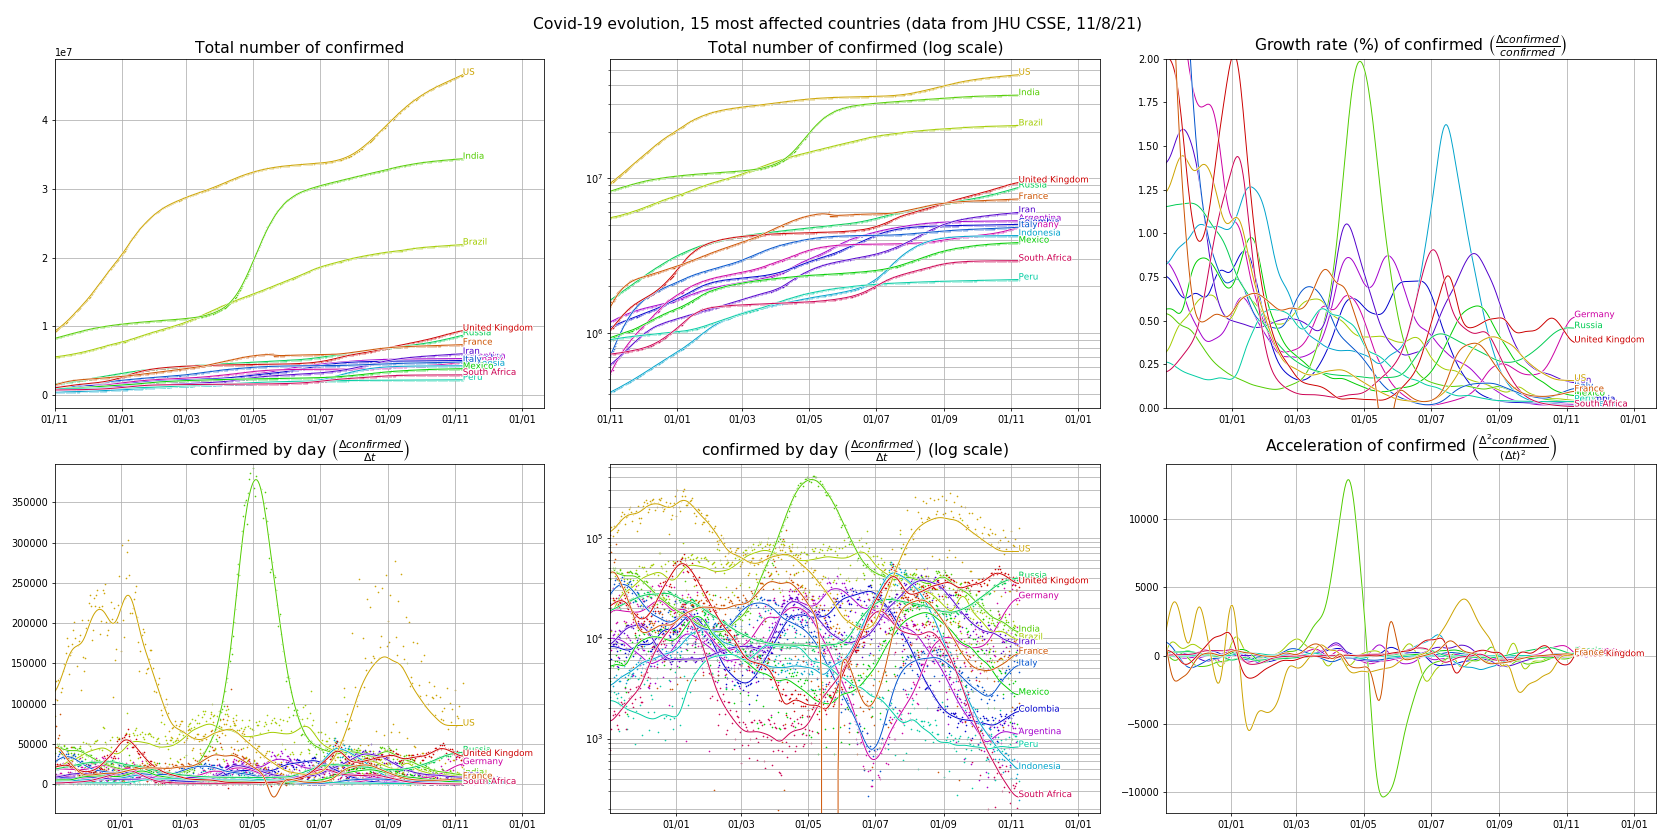
Confirmed cases (normalized by population size) (table of contents)