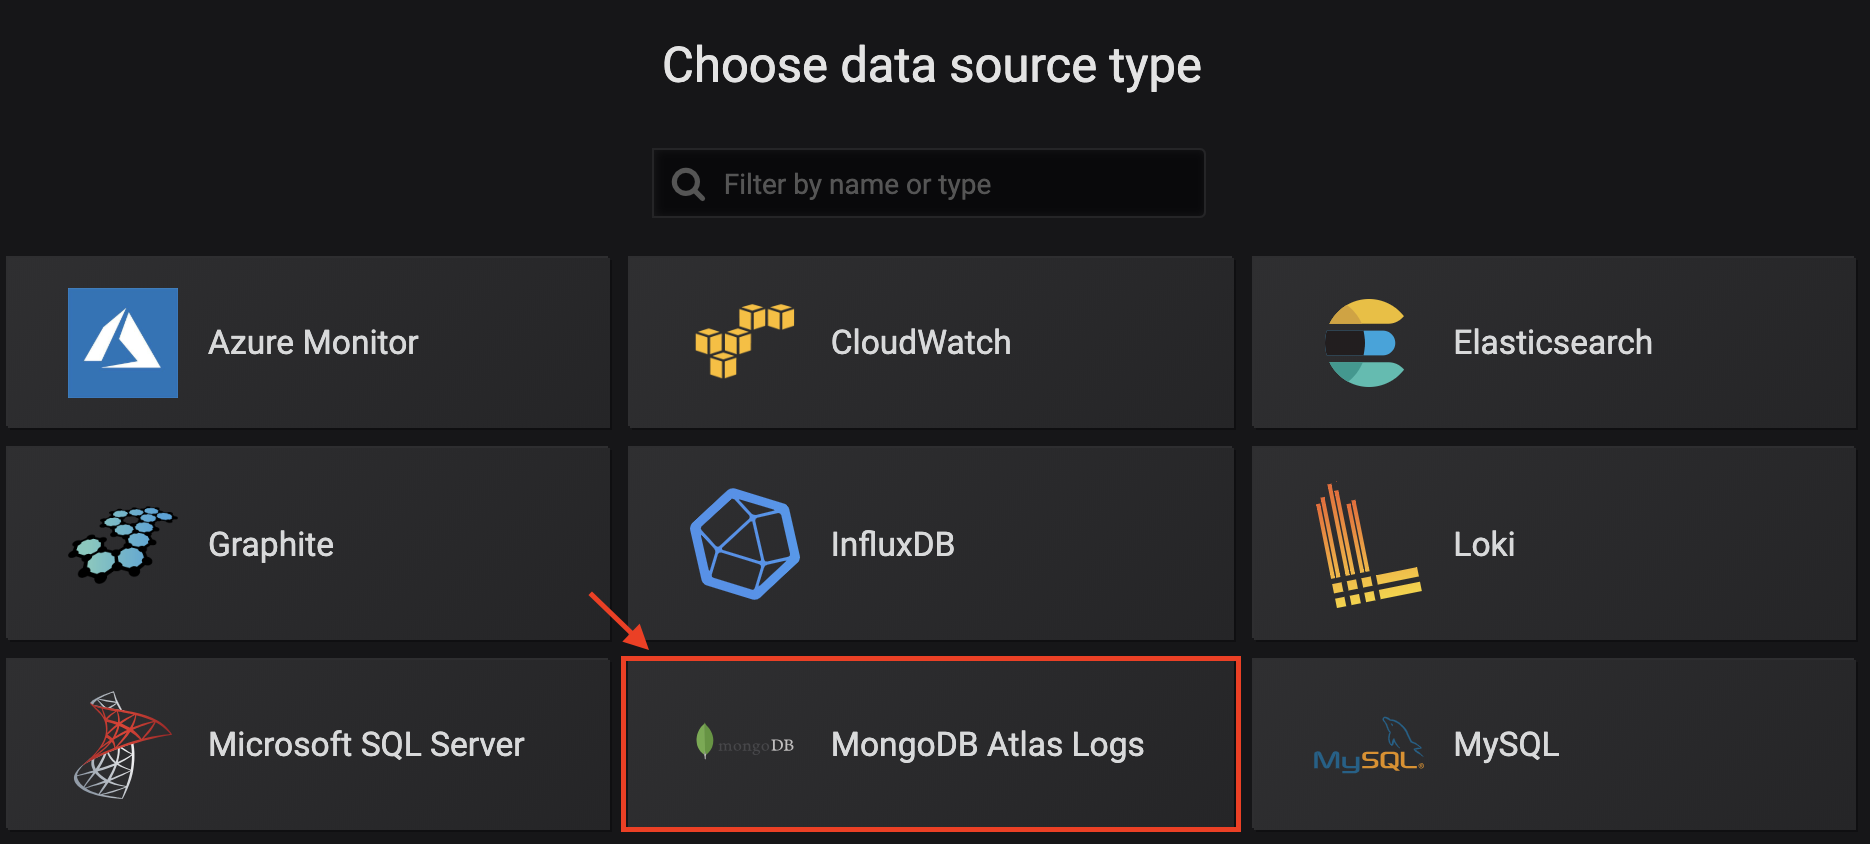
MongoDB Atlas allows to fetch logs from their service. More information can be found here: https://docs.atlas.mongodb.com/reference/api/logs/
This plugin allows to fetch process, database and disk logs from MongoDB Atlas in your Grafana dashboard. This allows you to monitor your whole MongoDB Atlas infrastructure within your grafana dashboards.
You can load the latest plugin version with the following command:
grafana-cli --pluginUrl https://github.com/valiton/grafana-mongodb-atlas-datasource/releases/latest/download/grafana-mongodb-atlas-datasource.zip plugins install grafana-mongodb-atlas-datasourcePlease note that we currently only build for linux. If you have a windows machine, then you have to update the Makefile accordingly
For docker setup add the following environment variable to automatically install the plugin:
docker run -p 3000:3000 -e GF_INSTALL_PLUGINS="https://github.com/valiton/grafana-mongodb-atlas-datasource/releases/latest/download/grafana-mongodb-atlas-datasource.zip;grafana-mongodb-atlas-plugin" grafana/grafana
For more information about the plugin installation have a look at the plugin official documentation.
This plugin requires node > 8.10 and dep
npm install # install JavaScript dependencies
dep ensure  # install go dependencies
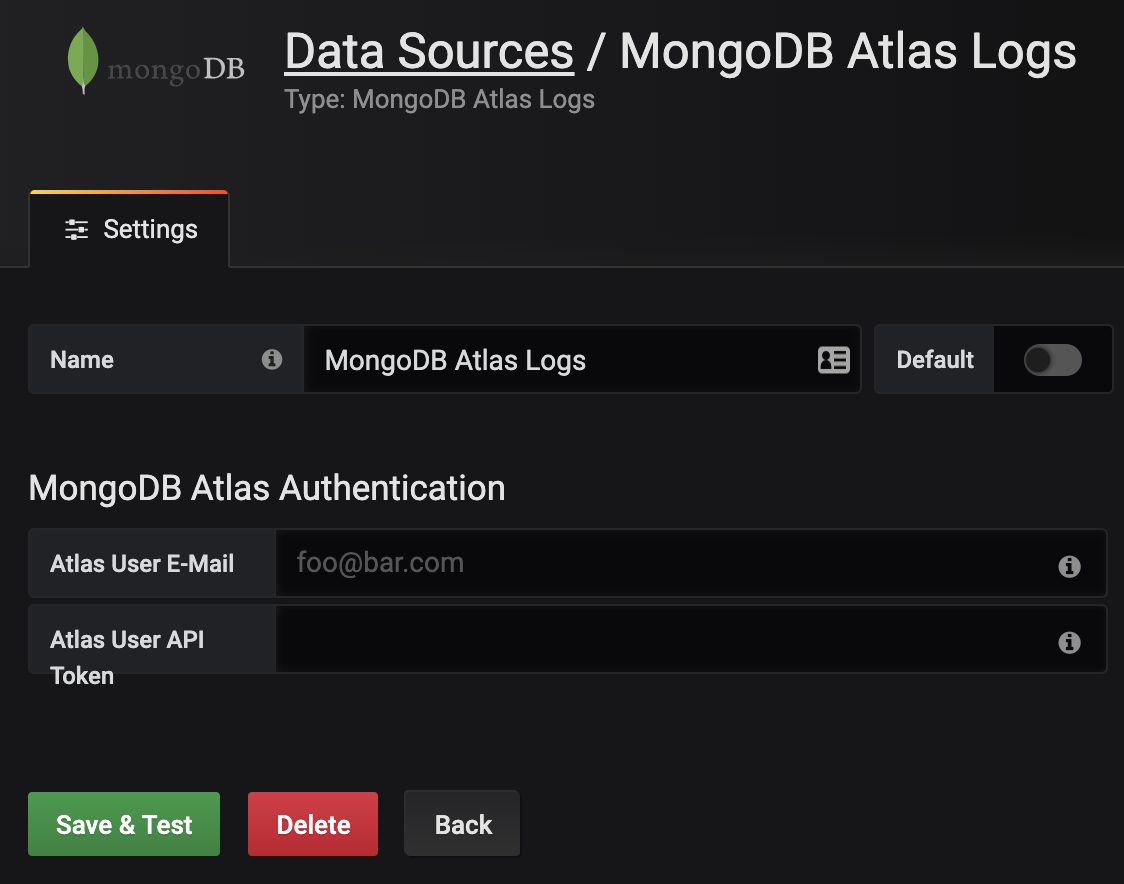
make # build JavaScript frontend and Go backendAfter installing the datasource in Grafana (see Grafana Setup section), you can create a Grafana datasource.
Please enter here your Atlas email address and the Atlas API token in the two input fields and click on enter. If the credentials are valid, you will see a green info box. For more information, have a look at the MongoDB Atlas documentation to create these credentials.
After setting up the datasource, you are able to create a query for a Grafana panel. You have to first select here the project you want to monitor and the cluster. After that, you can select one of three different metrics:
Next, you are asked different other parameters, such as the database name and then you can select the dimension you want to display in the query. To name the query, please use the alias input. You can use {{name}} to use metrics or dimensions for the name (see hint field of alias for more information).
Note: Annotations are not yet supported!
Pull requests for new features, bug fixes, and suggestions are welcome!
We use semversion format for tagging the releases.
make
zip --exclude "*node_modules*" --exclude "*vendor*" --exclude "*\.git*" -r grafana-mongodb-atlas-datasource.zip ./see https://help.github.com/en/articles/creating-releases for more information
-
1.0.0 - Initial release
Support for process, database and disk logs
-
1.0.1 - Remove empty data points from atlas logs
The logs by Atlas contain a lot of datapoints with null values. They were removed with this release.
-
1.0.2 - Rename Email / API Token to Public Key / Private Key
API keys aren't bound to accounts anymore: MongoDB deprecated the Personal API Keys in favor of the Programmatic API Keys.
-
1.0.3 - Support Other Timezones https://github.com/valiton/grafana-mongodb-atlas-datasource/commit/8efac61b1d1eb7915373028e2f98986c2c42923a


