This repository is a collection of notes about different useful things around Kotlin compiler JS IR backend development.
- TL;DR
- Gradle for kotlin compiler
- Gradle for other projects
- JVM control
- Daemons
- Debugging
- Profiling
- Heap dump
- Benchmarking
- build and install Kotlin from sources to local maven repository:
$ ./gradlew install
- run Kotlin compiler JS IR tests:
$ ./gradlew --parallel --project-dir js/js.tests jsIrTest
- show all available gradle tasks:
$ ./gradlew -q :tasks --all
- clean everything:
$ rm -rf .gradle && find . -name 'build' | grep -v ".git" | xargs rm -rf
- show all Kotlin daemons:
$ jps | grep KotlinCompileDaemon - stop all Gradle and Kotlin daemons:
$ jps | grep -E 'GradleDaemon|KotlinCompileDaemon' | cut -f 1 -d' ' | xargs kill -9
- start Kotlin daemon with debugger:
$ ./gradlew -Dkotlin.daemon.jvm.options=-agentlib:jdwp=transport=dt_socket\\,server=y\\,suspend=y\\,address=5006 :${Kotlin JS Task}
- start Kotlin daemon with/for JFR:
$ ./gradlew -Dkotlin.daemon.jvm.options=XX:+UnlockDiagnosticVMOptions,XX:+DebugNonSafepoints,XX:+FlightRecorder,XX:FlightRecorderOptions=stackdepth=2048 :${Kotlin JS Task} - start JFR:
$ jcmd ${KotlinCompileDaemon PID} JFR.start name=KotlinDemonProfile filename=/out/path/recording.jfr settings=profile maxsize=4GB - stop JFR:
$ jcmd ${KotlinCompileDaemon PID} JFR.stop name=KotlinDemonProfile - start Kotlin daemon with Heap dump:
$ ./gradlew -Dkotlin.daemon.jvm.options=XX:+HeapDumpOnOutOfMemoryError,XX:HeapDumpPath=/path/to/heap_dump.hprof :${Kotlin JS Task} - run gradle-profiler:
$ gradle-profiler --benchmark --project-dir /path/to/project --scenario-file /path/to/scenario/file.scenarios
My team-mates have strongly recommended me add the following local.properties file to my kotlin local repository
org.gradle.java.installations.auto-detect=false
kotlin.build.isObsoleteJdkOverrideEnabled=true
kotlin.native.enabled=false
kotlin.build.disable.werror=true
kotlin.test.maxParallelForks=8Build Kotlin from sources:
$ ./gradlew distBuild Kotlin from sources and install it into local maven repository ($HOME/.m2 directory):
$ ./gradlew installYou can run tests from IDE - just press the green play button, however it is possible to run the tests from the console.
Run all JS IR tests from the console:
$ ./gradlew --parallel --project-dir js/js.tests jsIrTestAlso, you may add -Pfd.kotlin.js.debugMode=2 option to you tests (in IDE it works as well).
If this option is enabled, compiler dumps IR after each lowering. They will be dumped to js/js.tests/build/out/irBox/builtins/${testName}-irdump directory.
Extremely useful for debugging!

TODO: Can I use it for non-test project build???
A piece of information about Kotlin JS tests can be found in Kotlin official repository here and here
After building and installing kotlin from sources you may use it for building other projects.
For that:
- Add the following code to the beginning of
settings.gradle.ktsfile:pluginManagement { repositories { gradlePluginPortal() mavenLocal() } } - Go through all
build.gradle.ktsfiles and- add
mavenLocal()near allmavenCentral()calls, it may look like:allprojects { version = "0.1.1" repositories { mavenLocal() mavenCentral() } } - set kotlin and plugin version to
1.X.255-SNAPSHOT, it may look like:plugins { kotlin("multiplatform") version "1.8.255-SNAPSHOT" apply false kotlin("plugin.serialization") version "1.8.255-SNAPSHOT" apply false }
- add
99.9% of all the things with gradle you can do from IDE, however you can also use a console.
To increase the compiler output verbosity you may add --info option to the gradle command.
In general there are two types of build:
- Development - no DCE, but it supports incremental compilation,
- Production - with DCE, incremental compilation options are ignored, and it also includes webpack (are you sure?).
The names of the gradle build tasks may be different for each project.
You may check the tasks name in IDE (Gradle button in the right top corner), or use the following command:
$ ./gradlew -q :tasks --allDevelopment build without DCE, but with the incremental compilation support
$ ./gradlew client:compileDevelopmentExecutableKotlinJsProduction build with Webpack(?)
$ ./gradlew client:compileProductionExecutableKotlinJsIf you do not trust ./gradlew clean command, you can remove all build artifacts with the command:
ATTENTION! IT MAY REMOVE MORE THAN YOU WANT! DO NOT USE THIS COMMAND IN KOTLIN LOCAL REPOSITORY
$ rm -rf .gradle && find . -name 'build' | grep -v ".git" | xargs rm -rfHere are the most useful JVM commands which allows controlling your daemons.
This command shows all JVM processes. I usually use it with grep.
Example:
$ jps
This is very nice tool, it helps to understand what is going on with Kotlin daemon. Read more here.
The most interesting are: VM.uptime, VM.flags, VM.system_properties, VM.command_line, JFR.*.
Example:
jcmd ${PID} VM.uptime
You can say gradle to run everything in one process without daemons, but it is very slow!
If you still wanna do this, check the options (in gradle.properties or local.properties or through -P{option key}={option value}):
org.gradle.daemon=false- do not start gradle daemon,kotlin.compiler.execution.strategy=in-process- do not start Kotlin daemon.
Usually gradle stars GradleDaemon which starts KotlinCompileDaemon, and this daemon does all Kotlin stuff.
Mostly you need to pass some extra options to Kotlin daemon, but before you need to find and stop him, so the next time Gradle daemon will start Kotlin daemon with your options.
Find Kotlin daemon PID:
$ jps | grep KotlinCompileDaemonQ: What should I do if I see more than one KotlinCompileDaemon processes?
A: Usually I clean everything, stop all daemons and run build task again. If after that I still see more than one daemon, I use the daemon with the highest PID.
Find Gradle and Kotlin daemons:
$ jps | grep -E 'GradleDaemon|KotlinCompileDaemon' Stop all daemon processes:
$ jps | grep -E 'GradleDaemon|KotlinCompileDaemon' | cut -f 1 -d' ' | xargs kill -9Also, you may stop all JVM processes (it works fine for macOS, however on Linux it may kill your IDE as well):
$ killall -9 javaYou may add or override option from gradle.properties or local.properties via -P.
For example, enable JS IR backend:
$ ./gradlew -Pkotlin.js.compiler=ir :${Kotlin JS Task}You may pass options to Kotlin daemon JVM via kotlin.daemon.jvm.options (and -D!!!):
$ ./gradlew -Dkotlin.daemon.jvm.options=${any options separated by `,` without `-`} :${Kotlin JS Task}- Prepare a debug configuration in IDE, it should look like that:
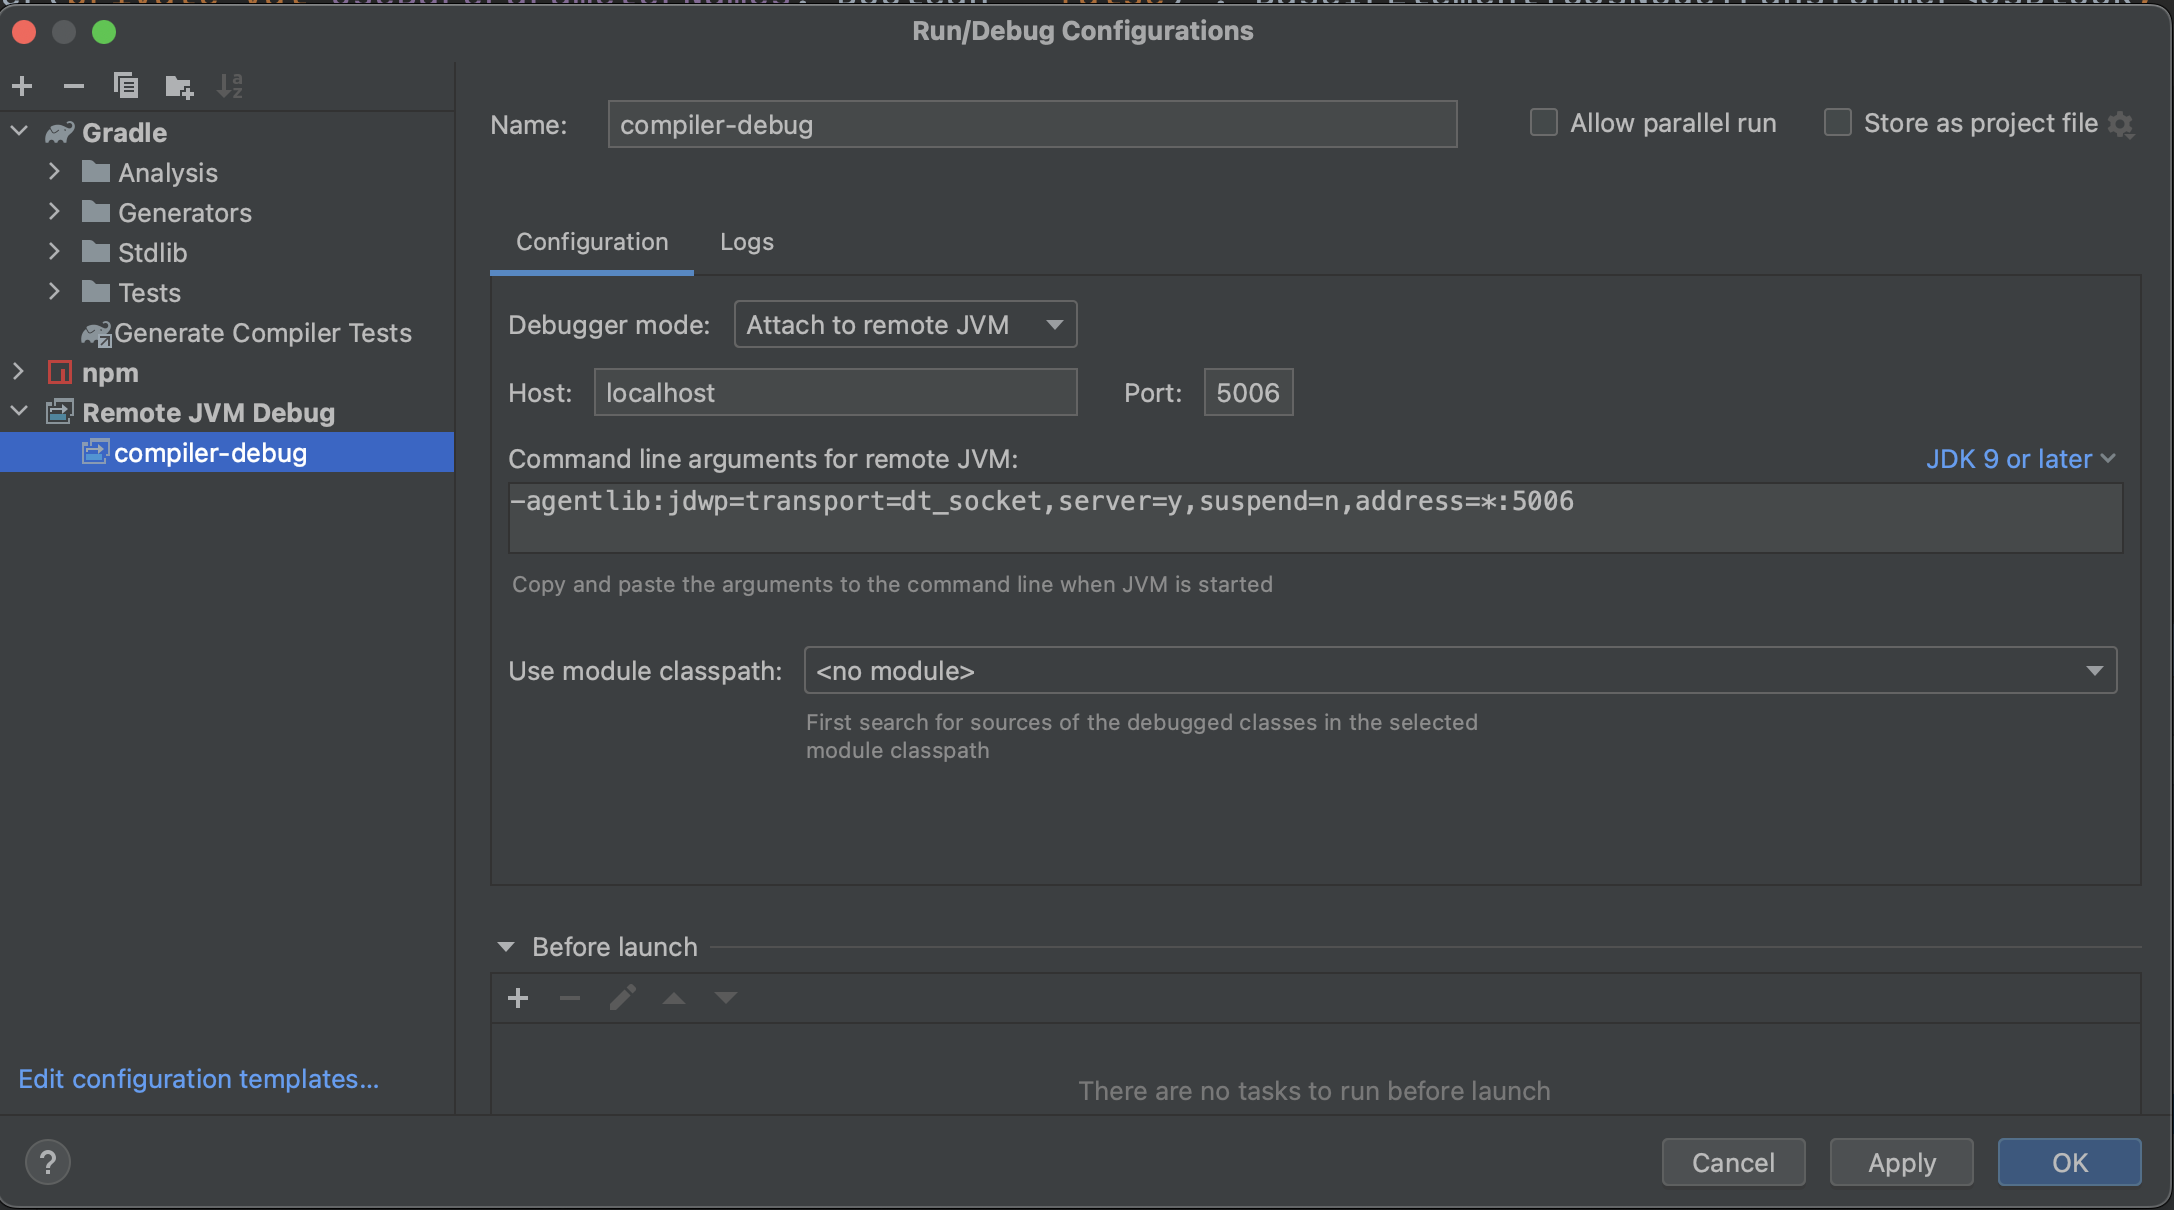
- Before continuing make sure, that there are no available Kotlin daemons,
- Start Kotlin daemon with the tuned debugger:
$ ./gradlew -Dkotlin.daemon.jvm.options=-agentlib:jdwp=transport=dt_socket\\,server=y\\,suspend=y\\,address=5006 :${Kotlin JS Task}
- Go to IDE and attach to Kotlin daemon,
- Enjoy!

Works like a magic: just open Profiler tab, find you KotlinCompileDaemon process and attach.
If you can't find Profiler tab for some reasons - open Actions (for macOS: Command + Shift + A) and enter Profiler

Java flight recorder complains about stack depth, therefore it makes sense to tune and use it manually.
Tune JFR for Kotlin daemon (Before starting make sure, that there are no available Kotlin daemons):
$ ./gradlew -Dkotlin.daemon.jvm.options=XX:+UnlockDiagnosticVMOptions,XX:+DebugNonSafepoints,XX:+FlightRecorder,XX:FlightRecorderOptions=stackdepth=2048 :${Kotlin JS Task}+UnlockDiagnosticVMOptionsand+DebugNonSafepoints- in the internet it is written, that this options improve the profiling quality, I have no idea if it is true.+FlightRecorder- enable JFR, TODO: Should the option be explicitly used?FlightRecorderOptions- tune JFR, set stack depth. This option is must have!
Do not forget about JVM warming up!
Start-stop JFR:
$ jcmd ${KotlinCompileDaemon PID} JFR.start name=KotlinDemonProfile filename=/out/path/recording.jfr settings=profile maxsize=4GB
# do the compilation
$ jcmd ${KotlinCompileDaemon PID} JFR.stop name=KotlinDemonProfile
You can use this combination for small projects:
$ jcmd ${KotlinCompileDaemon PID} JFR.start name=KotlinDemonProfile filename=/out/path/recording.jfr settings=$JAVA_HOME/lib/jfr/profile.jfc maxsize=4GB && \
  ./gradlew -Dkotlin.daemon.jvm.options=XX:+UnlockDiagnosticVMOptions,XX:+DebugNonSafepoints,XX:+FlightRecorder,XX:FlightRecorderOptions=stackdepth=2048 :${Kotlin JS Task} && \
jcmd ${KotlinCompileDaemon PID} JFR.stop name=KotlinDemonProfileIf you wanna understand what goes wrong and why compiler has eaten all memory, you need to ask JVM to generate heap dump on OOM.
But before, inspect the current JVM args, it is very possible, that required options are already passed implicitly.
You can do this with the jcmd command:
$ jcmd ${KotlinCompileDaemon PID} VM.command_lineI've got the following:
jvm_args:
  -Djava.awt.headless=true
  -D$java.rmi.server.hostname=127.0.0.1
  -Xmx4g
  -XX:MaxMetaspaceSize=768m
  -Dkotlin.environment.keepalive
  -ea
  -XX:+HeapDumpOnOutOfMemoryError
  -XX:HeapDumpPath=/var/folders/wf/6rs371f93c33q3kl3ygxs4500000kt/T/
so I can find heap dumps in /var/folders/wf/6rs371f93c33q3kl3ygxs4500000kt/T/ directory:
$ ls -la /var/folders/wf/6rs371f93c33q3kl3ygxs4500000kt/T/ | grep javaa heap dump should look like java_pid${KotlinCompileDaemon PID}.hprof.
If HeapDumpOnOutOfMemoryError and HeapDumpPath are not specified implicitly, you can pass them explicitly to Kotlin daemon (TODO: check if it works)
(Before starting make sure, that there are no available Kotlin daemons):
$ ./gradlew -Dkotlin.daemon.jvm.options=XX:+HeapDumpOnOutOfMemoryError,XX:HeapDumpPath=/path/to/heap_dump.hprof :${Kotlin JS Task}Also heap dump can be generated manually via jcmd:
$ jcmd ${KotlinCompileDaemon PID} GC.heap_dump /path/to/heap_dump.hprofGradle profiler is good for benchmarking, however I'm still not sure if it is possible to use it for Kotlin daemon profiling, because it runs profilers only for Gradle daemon and profiles them.
Here is a template. Feel free to copy-paste-modify it.
Do not forget to set ${Kotlin JS Task}.
Also, you may wanna add extra gradle-args options, like --info or tune JVM arguments via jvm-args.
clean_build_legacy {
    title = "Legacy: clean build"
    tasks = [":${Kotlin JS Task}"]
    cleanup-tasks = ["clean"]
    gradle-args = [
        "-Pkotlin.js.compiler=legacy",
    ]
    jvm-args = [
        "-Xmx6g",
        "-XX:+UseParallelGC"
    ]
    clear-build-cache-before = SCENARIO
    clear-configuration-cache-state-before = SCENARIO
    clear-transform-cache-before = SCENARIO
    clear-project-cache-before = SCENARIO
    show-build-cache-size = true
    iterations = 4
    warm-ups = 2
}
clean_build_ir {
    title = "IR: clean build"
    tasks = [":${Kotlin JS Task}"]
    cleanup-tasks = ["clean"]
    gradle-args = [
        "-Pkotlin.js.compiler=ir",
        "-Pkotlin.incremental.js.klib=false",
        "-Pkotlin.incremental.js.ir=false"
    ]
    jvm-args = [
        "-Xmx6g",
        "-XX:+UseParallelGC"
    ]
    clear-build-cache-before = SCENARIO
    clear-configuration-cache-state-before = SCENARIO
    clear-transform-cache-before = SCENARIO
    clear-project-cache-before = SCENARIO
    show-build-cache-size = true
    iterations = 4
    warm-ups = 2
}
clean_build_ir_ic {
    title = "IR IC: clean build"
    tasks = [":${Kotlin JS Task}"]
    cleanup-tasks = ["clean"]
    gradle-args = [
        "-Pkotlin.js.compiler=ir",
        "-Pkotlin.incremental.js.klib=true",
        "-Pkotlin.incremental.js.ir=true"
    ]
    jvm-args = [
        "-Xmx6g",
        "-XX:+UseParallelGC"
    ]
    clear-build-cache-before = SCENARIO
    clear-configuration-cache-state-before = SCENARIO
    clear-transform-cache-before = SCENARIO
    clear-project-cache-before = SCENARIO
    show-build-cache-size = true
    iterations = 4
    warm-ups = 2
}
You may run benchmarking with the following command:
$ gradle-profiler --benchmark --project-dir /path/to/project --scenario-file /path/to/scenario/file.scenarios