In this tutorial you'll learn how to set up the time series database KairosDB along with the popular NoSQL database Cassandra on DCOS. We will use the GitHub API as a stream datasource and build a dashboard using Grafana.
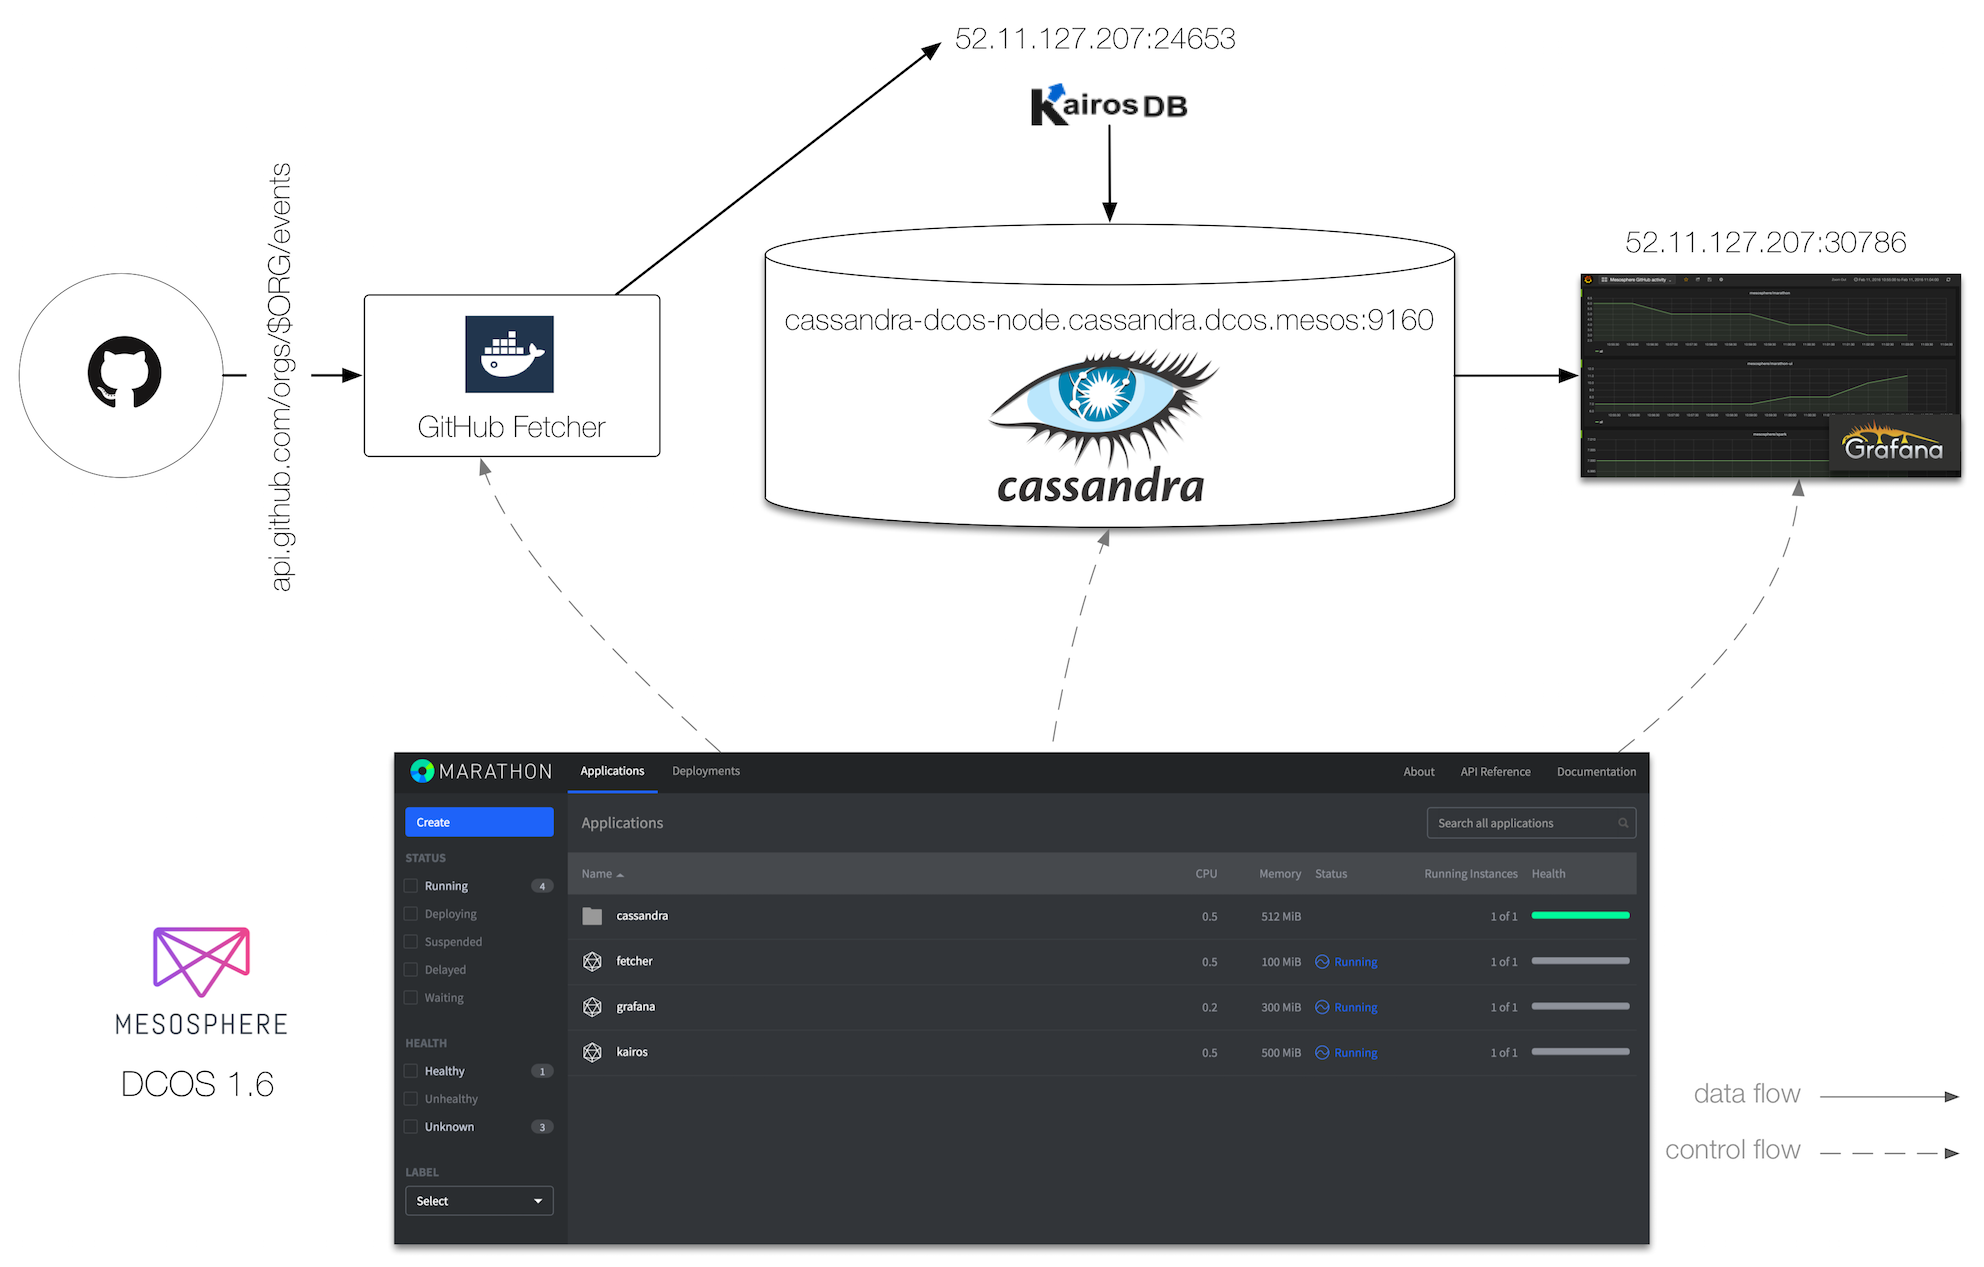
The overall application architecture looks as follows:
Note that above exemplary IP addresses and ports are shown, which varies based on the actual deployment.
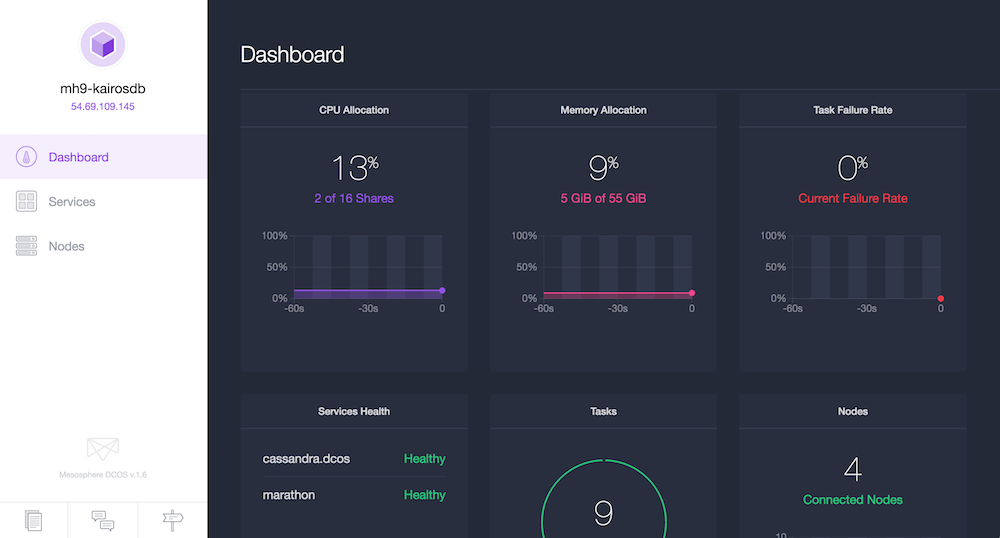
The first step of the preparation is to create a DCOS cluster. I've used a cluster with three private nodes and one public node (where the end-user facing components run):
Once you have the DCOS cluster up and running it's time to install Cassandra:
$ dcos package install cassandra
You execute above command from the place where you've installed the DCOS command line interface. It takes a couple of minutes and once you see Cassandra marked as healthy in the DCOS dashboard you're good to go.
Note that the Cassandra nodes are available via <DCOS-URI>/service/cassandra/v1/nodes/connect.
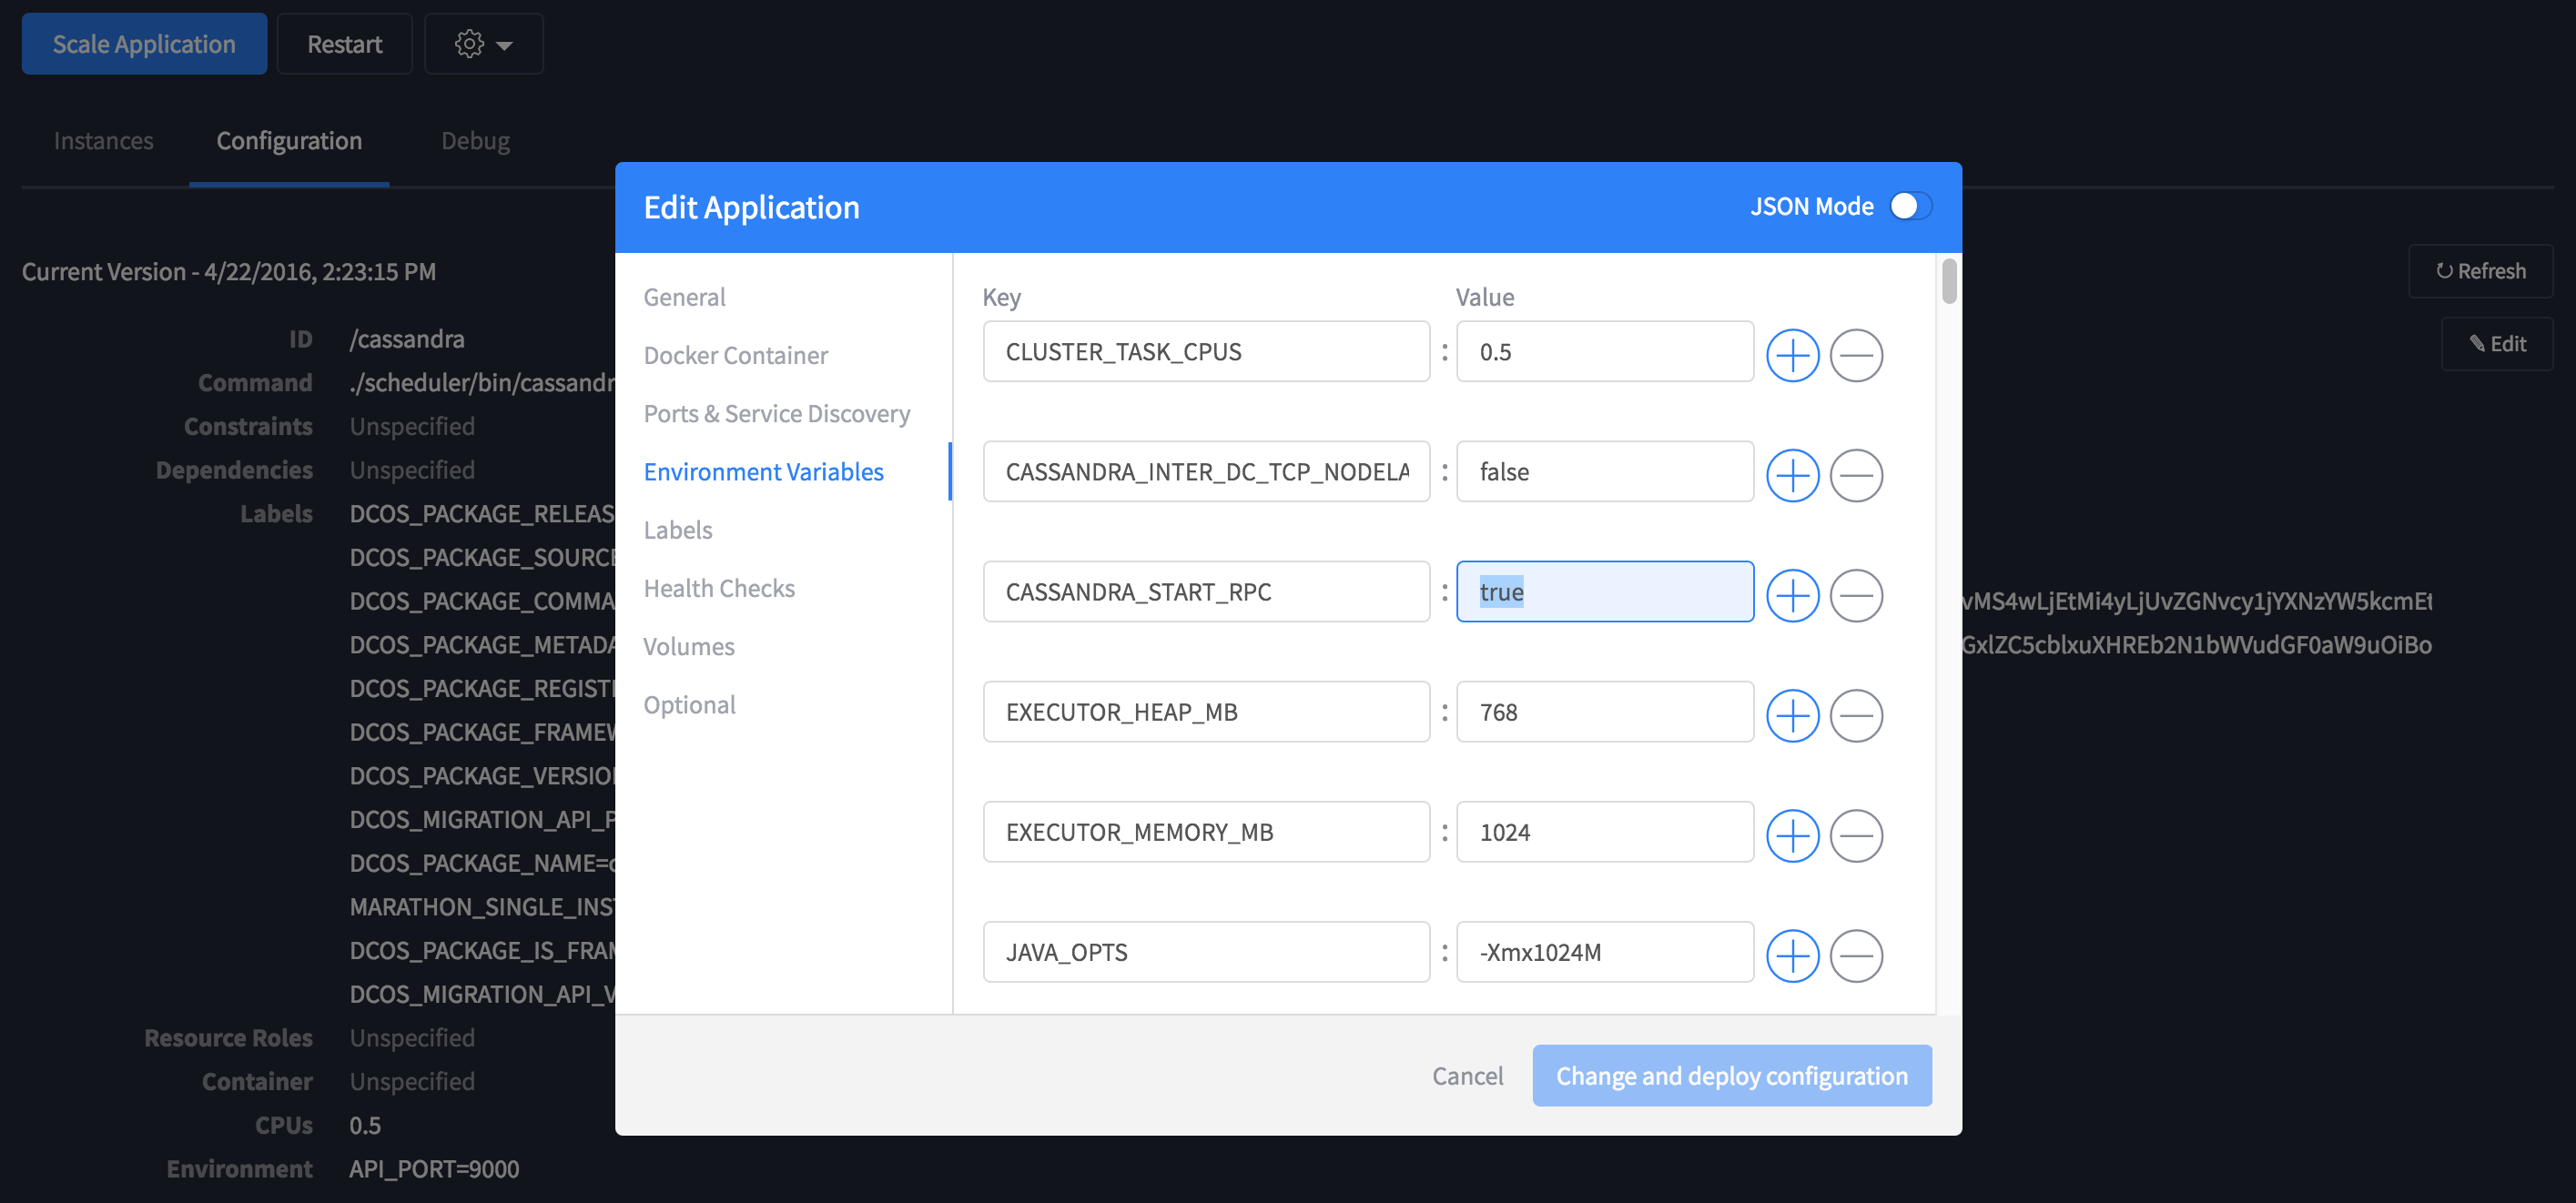
By default Cassandra does not enable support for the Thrift protocol which is required by KairosDB. To enable this we can do a rolling configuration update of Cassandra which enables this feature. To do this we should change the environment variable CASSANDRA_START_RPC and deploy the config change as illustrated below.
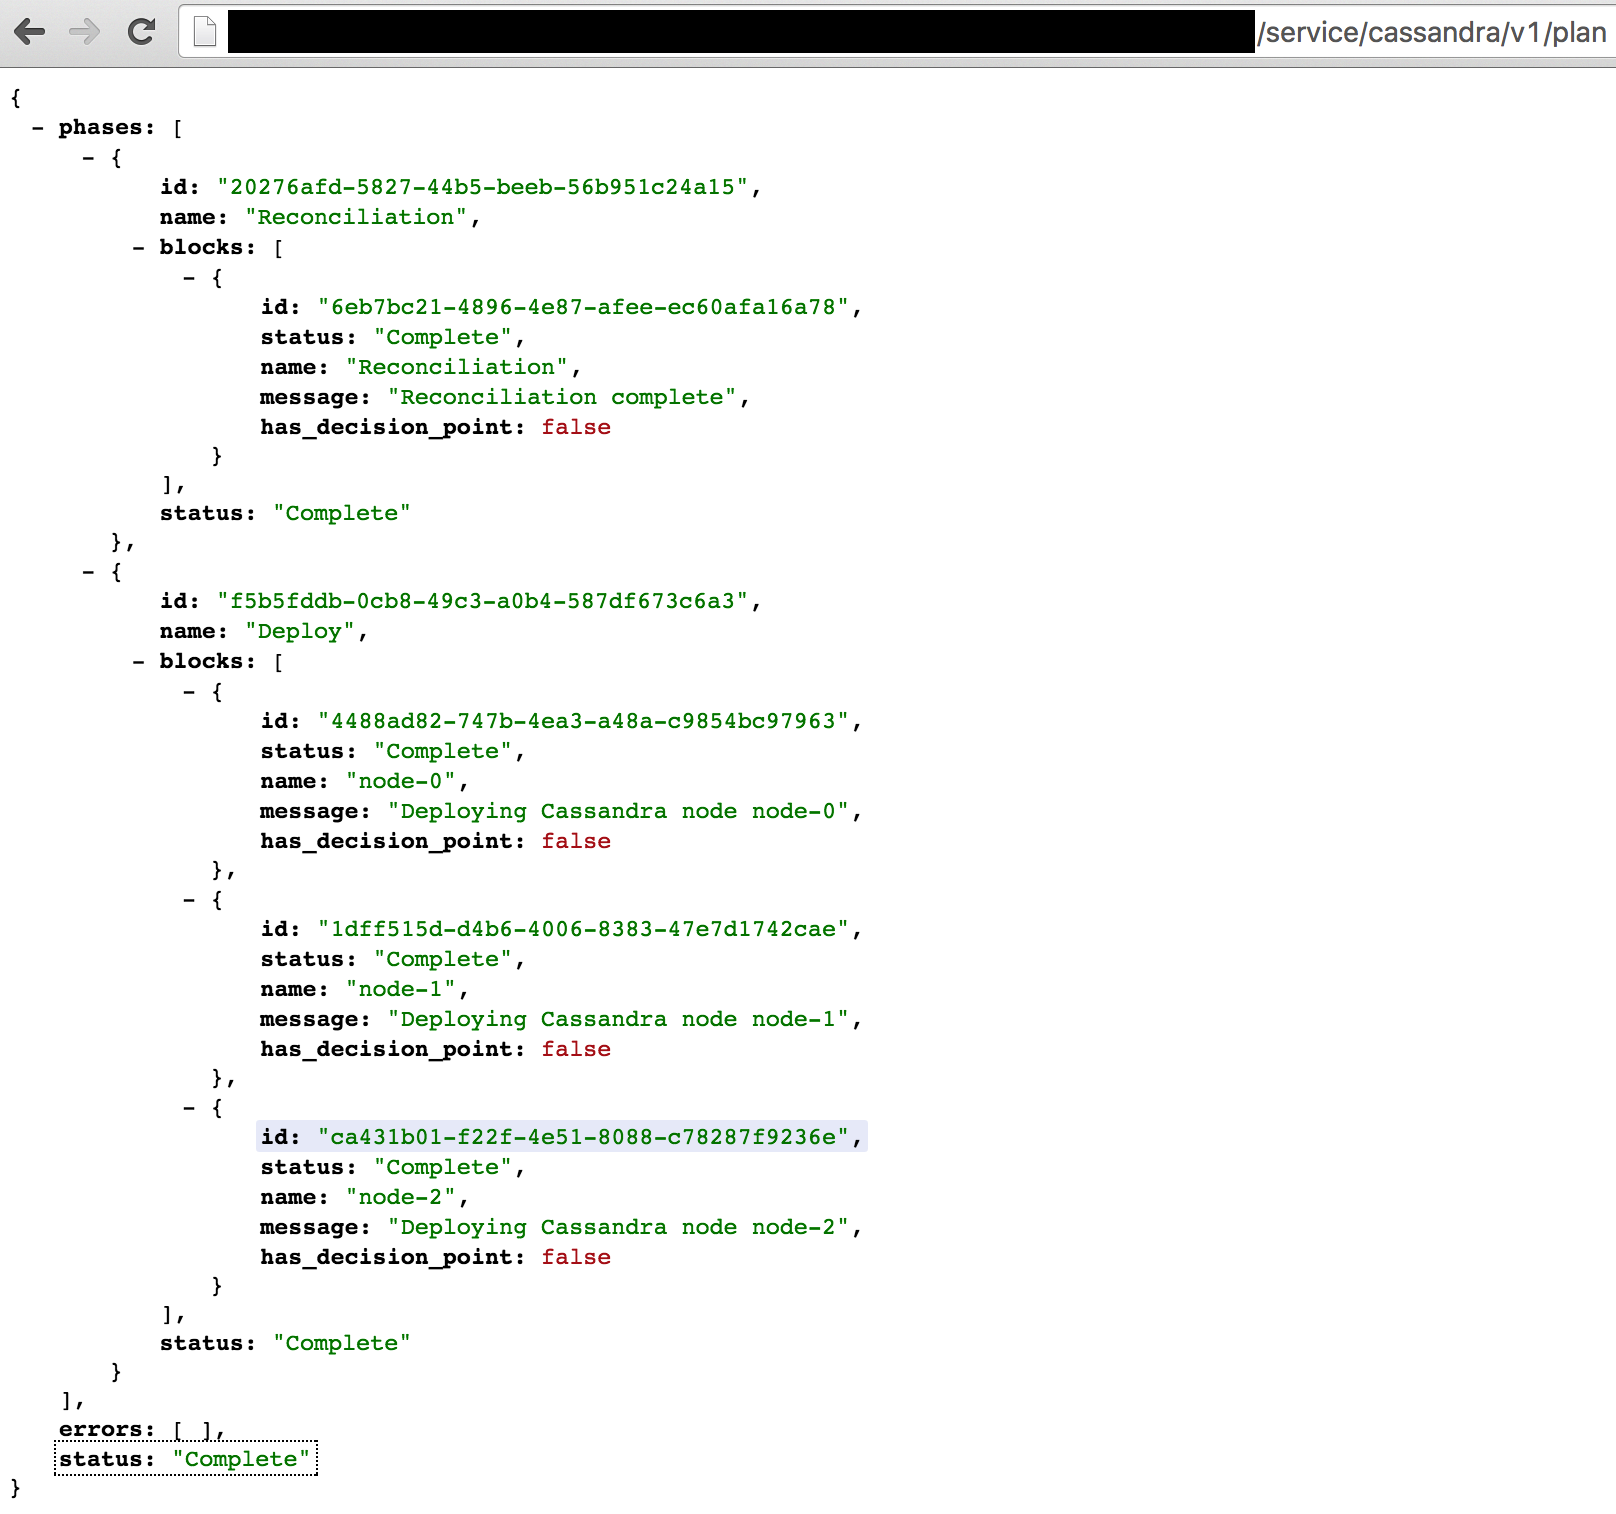
We can monitor the status of the configuration update at the <DCOS-URI>/service/cassandra/v1/plan as illustrated below. Once the Plan is Complete (see below), it is safe to proceed.
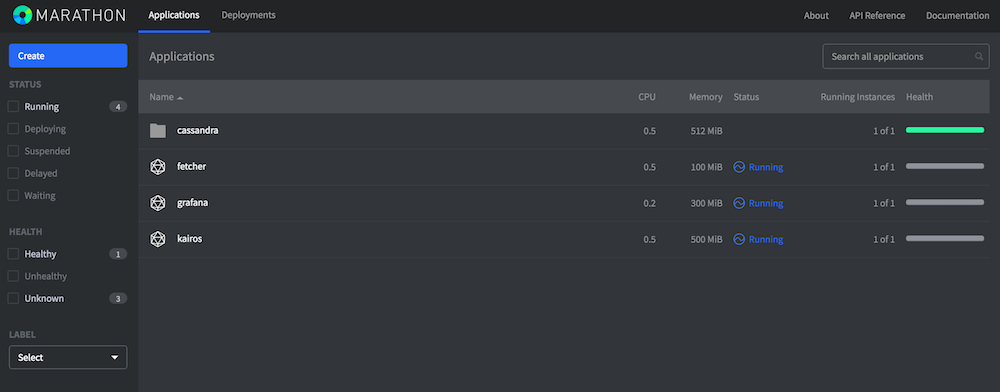
Once you've completed the steps outlined in this section, you should see the following applications and services running in Marathon:
Note that Cassandra has already been launched in the preparation step, so in total three new apps will appear in Marathon.
KairosDB is a time series database that runs on top of Cassandra, offering a HTTP data API as well as a Web UI, both exposed via port 8080.
Use the DCOS CLI to launch the Marathon app spec for KairosDB:
$ dcos marathon app add marathon-kairosdb.json
Note: Nothing needs to be changed in marathon-kairosdb.json.
Once you see KairosDB running in Marathon, you can access its Web UI by looking up the IP address of the public node (52.11.127.207 in my case) along with the port that Mesos has assigned to the container.
Tip: You can find your public agent IP address in AWS by viewing your EC2 instances and searching for nodes with a Public IP and aws:cloudformation:logical-id PublicSlaveServerGroup
Once you've obtained the IP of your cluster's Public Node, you can then glean the port mapping information either through looking at the application in the Marathon UI, or through using the DCOS CLI like so:
$ dcos marathon task list
APP              HEALTHY          STARTED              HOST     ID
/cassandra/dcos    True   2016-02-09T05:51:45.269Z  10.0.2.113  cassandra_dcos.308b8c24-cef1-11e5-bf2e-02181a13a4a7
/kairos            True   2016-02-02T14:11:48.858Z  10.0.4.20   kairos.ce522993-c9b6-11e5-bf2e-02181a13a4a7
$ dcos marathon task show kairos.ce522993-c9b6-11e5-bf2e-02181a13a4a7
{
  "appId": "/kairos",
  "host": "10.0.4.20",
  "id": "kairos.ce522993-c9b6-11e5-bf2e-02181a13a4a7",
  "ipAddresses": [
    {
      "ipAddress": "172.17.0.2",
      "protocol": "IPv4"
    }
  ],
  "ports": [
    24653,
    24654,
    24655,
    24656
  ],
...
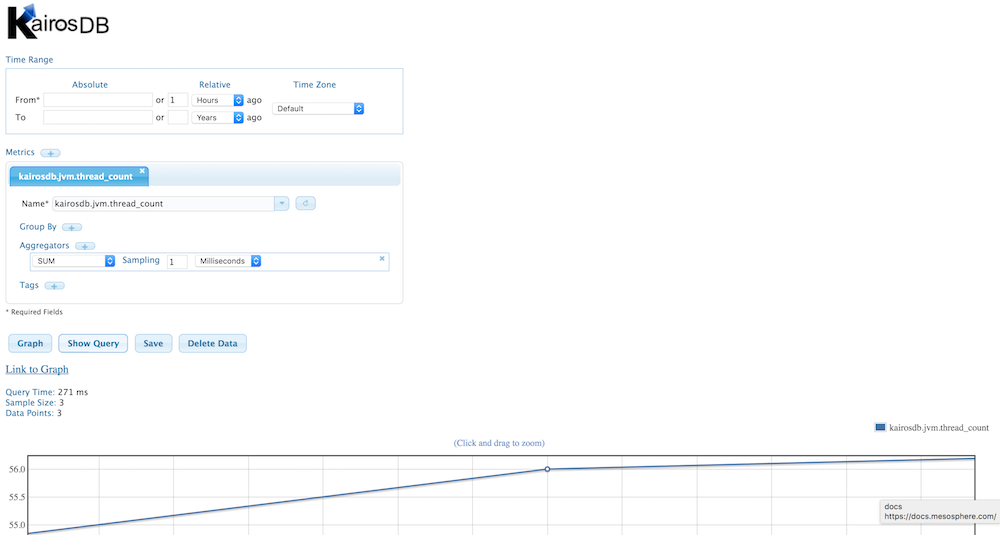
The first port (for me is 24653) is mapped to container port 8080. Now that you have both the Public Node IP and the mapped port (for me http://52.11.127.207:24653), you can now visit the KairosDB Web UI at that address:
Even now, without any data ingested from GitHub, you can toy around with the internal metrics available. Also, if you're interested in the internals of KairosDB on DCOS, check out the manual launch notes.
We want to build a dashboard with Grafana, plotting the time series data from KairosDB. For that we need to first launch Grafana using the Marathon app spec for Grafana
$ dcos marathon app add marathon-grafana.json
Notes:
- Again, as in the previous step, there is nothing for you to change in
marathon-grafana.json - You can look up Grafana's serving port on the Public Node in the same fashion as before (for me that was
52.11.127.207:30786).
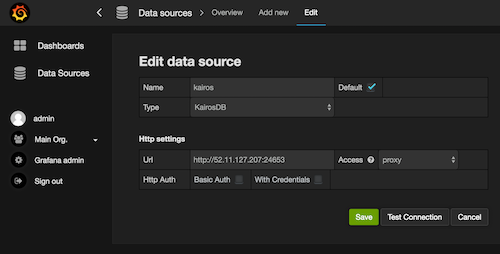
Next step is to connect Grafana to KairosDB as a backend, which is supported since v2.1. Start by visiting the Grafana Web UI and authenticating with user:admin password:admin. Next, add a new data source as shown below:
Once you've completed this step you're almost good to go.
In this tutorial, we use Github activity as a sample data source. To ingest data from GitHub into KairosDB, a custom Docker image is used, called the GitHub Fetcher.
In a nutshell, it polls https://api.github.com/orgs/$ORG/events with a configurable time interval and uses the KairosDB HTTP API to ingest the datapoints.
The custom Docker image is launched as a Marathon app via the app specification marathon-github-fetcher.json.
Before adding this application, you must first customize the KAIROSDB_API value in marathon-github-fetcher.json. This must be pointed to the IP/port that we found earlier for the KairosDB Web UI. The provided endpoint must not end in a slash:
...
"env": {
    "KAIROSDB_API": "http://52.11.127.207:24653",
    "GITHUB_ORG": "mesosphere",
    "POLL_INTERVAL": "60"
},
...
Note:
- You can customize the Github organization by editing
GITHUB_ORG. - The period between refreshes can be customized by changing
POLL_INTERVAL. The default value of 60 sec is a good value for most organizations.
Once you've gone through the preparation steps and launched both KairosDB and Grafana as well as configured the GitHub fetcher as discussed in the previous section, you're ready to start importing and visualizing Github statistics.
First, launch the GitHub Fetcher and make sure it is running:
$ dcos marathon app add marathon-github-fetcher.json
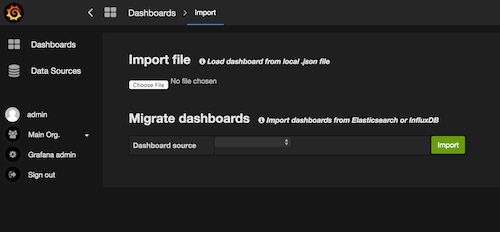
Now, data is ingested from the GitHub API into Cassandra and available in Grafana. You can either create your own dashboards or import the one I've created, grafana-dashboard.json, as a starting point and take it from there, like so:
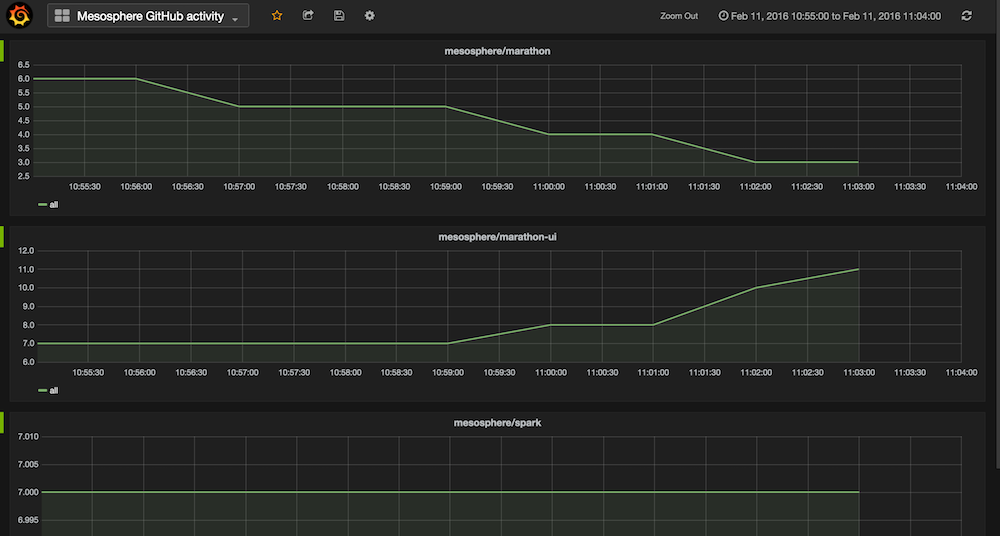
The result of the import is the GitHub activity of an organization:
Note that you can play around with the tags to show a drilldown in terms of activities (such as pull requests, comments, etc.) and actors (GitHub users).
