The purpose of this project is to uncover insights from a dataset on term deposit marketing campaigns conducted by a bank in Portugal. Term deposits enhance banks' lending capabilities by locking in customer funds for a fixed period in exchange for higher interest rates. Analyzing factors influencing term deposit enrollments helps banks design effective marketing strategies, ultimately boosting enrollment and increasing their lending pool and revenues from interest payments from borrowers.
To begin, I formulated several hypotheses based on domain knowledge for validation during analysis. I then formatted the data by creating dummy variables for categorical data and enumerating ordinal data. Next, I conducted a correlation analysis, bootstrapped with replacement to find confidence intervals, and performed hypothesis testing. Finally, I carried out PCA and k-means clustering. The results of my analysis informed the graphs included in my Excel dashboard, which succinctly captured the data patterns. This analysis can help small banks optimize their marketing strategies for term loans, ultimately increasing their lending pool and interest revenues and driving faster growth of the bank as a whole.
- Repository Structure
- Software Requirements & Packages
- Dataset
- Hypothesis
- Data Wrangling
- Analysis
- Results
- Discussion
- Dashboard
- Conclusion
- Contact
- Sources Cited
- License
Click to see the repository skeleton.
\
│   .gitattributes
│   .gitignore
│   README.md
│   repo_structure.txt
│
├── data\
│   ├── bank_combined.xlsx
│   ├── bank_dashboard.xlsx
│   ├── bank_dummiesonly.xlsx
│   ├── bank_nodummies.xlsx
│   ├── bank_original.xlsx
│   ├── bootstrap_means_balance_df.pkl
│   ├── bootstrap_means_duration_df.pkl
│   ├── bootstrap_means_n1000.pkl
│   ├── bootstrap_samples_n1000.pkl
│   ├── bootstrap_samples_n1000.zip
│   ├── bootstrap_samples_yes_df.pkl
│   └── df_scaled.pkl
│
├── images\
│   ├── bootstrap_means_age.png
│   ├── bootstrap_means_balance.png
│   ├── bootstrap_means_duration.png
│   ├── dashboard_sketchpng.png
│   ├── eigenvectors_PC1to3.png
│   ├── elbow_plot.png
│   ├── histogram_age.png
│   ├── histogram_balance_with_stats.png
│   ├── histogram_campaign_with_stats.png
│   ├── histogram_duration_with_stats.png
│   ├── histogram_education.png
│   ├── histogram_monthnum_with_stats.png
│   ├── histogram_pdays_with_stats.png
│   ├── histogram_previous_with_stats.png
│   ├── kmeans_clustering.png
│   ├── PCA.png
│   ├── QQ_plot_age.png
│   ├── QQ_plot_balance.png
│   ├── sample_means_age_95confidence.png
│   ├── sample_means_balance_95confidence.png
│   ├── sample_means_duration_95confidence.png
│   └── scree_plot.png
│
└── src\
  ├── data_prep.ipynb
  ├── histograms_bootstrap_confidence_intervals.ipynb
  ├── hypothesis_tests.ipynb
  └── PCA_kmeans_clustering.ipynb
- Microsoft Excel 2021
- Windows 10/11
- Python 3.10
- Pandas, Numpy, Scipy, Matplotlib, Seaborn, Sklearn, mpl_toolkits, Pickle
UC Irvine ML Library-- Bank Marketing
The dataset comprises 45,211 records across 17 columns. Each row represents a customer contact event in a marketing campaign, with potential for multiple rows per customer, though customer IDs are not provided. Of the columns, 10 are categorical (including nominal, ordinal, and binary types), while 7 are numeric.
Click to see the column headers.
| Column No. | Attribute | Description |
|------------|-----------|-------------|
| 1          | age       | Numeric: the age of the client. |
| 2          | job       | Categorical: the type of job ("admin.", "unknown", "unemployed", "management", "housemaid", "entrepreneur", "student", "blue-collar", "self-employed", "retired", "technician", "services"). |
| 3          | marital   | Categorical: marital status ("married", "divorced", "single"; note: "divorced" includes widowed). |
| 4          | education | Categorical (Ordinal): level of education ("unknown", "secondary", "primary", "tertiary"). |
| 5          | default   | Binary: has credit in default? ("yes", "no"). |
| 6          | balance   | Numeric: average yearly balance in euros. |
| 7          | housing   | Binary: has housing loan? ("yes", "no"). |
| 8          | loan      | Binary: has personal loan? ("yes", "no"). |
| 9          | contact   | Categorical: contact communication type ("unknown", "telephone", "cellular"). |
| 10         | day       | Numeric: last contact day of the month. |
| 11         | month     | Categorical: last contact month of the year ("jan", "feb", "mar", ..., "nov", "dec"). |
| 12         | duration  | Numeric: last contact duration in seconds |
| 13         | campaign  | Numeric: number of contacts performed during this campaign and for this client (includes last contact) |
| 14         | pdays     | Numeric: number of days that passed by after the client was last contacted from a previous campaign (-1 means the client was not previously contacted). |
| 15         | previous  | Numeric: number of contacts performed before this campaign and for this client. |
| 16         | poutcome  | Categorical: outcome of the previous marketing campaign ("unknown", "other", "failure", "success"). |
| 17         | y         | Whether the client will subscribe to a term deposit ("yes", "no"). |
Based on my understanding of term deposits and human behavior, these initial assumptions about the features will guide my analysis. They can be validated or refuted based on the results of the analysis:
- Positive correlations expected with: age, job, marital status, education level, balance, and term deposit success. his assumption stems from the idea that individuals who have higher levels of education, employment and marriage are in a better position to subscribe to term loans.
- Negative correlations anticipated with: housing loan status, personal loan status, default status, and term deposit success. This assumption stems from the idea that individuals with more loans may have less disposable income to commit to term deposits.
- Generated dummy variables for categorical attributes: job, education, default, housing, loan, contact, poutcome, y, and marital.
- Created a new column, month_number, to represent months with enumerated names.
- Converted 'education' from string to integer to treat it as an ordinal variable, replacing 'unknown' with NaN.
- Consolidated all original and new columns into a unified dataframe, saving it as an Excel file named bank_combined.xlsx.
- Replaced -1 values in pdays with NaN.
First, I did a correlation analysis in Excel to find patterns to explore further through hypothesis testing:
The Excel Analysis Toolpak's descriptive statistics module efficiently computes metrics like mean, standard error (SE), and variance for numeric variables. However, these calculations are based on the data distribution itself rather than on the distribution of sample means. Consequently, metrics such as mean, SE, and skewness may appear larger when the data distributions deviate from normality. This issue is particularly significant for calculating the confidence interval.
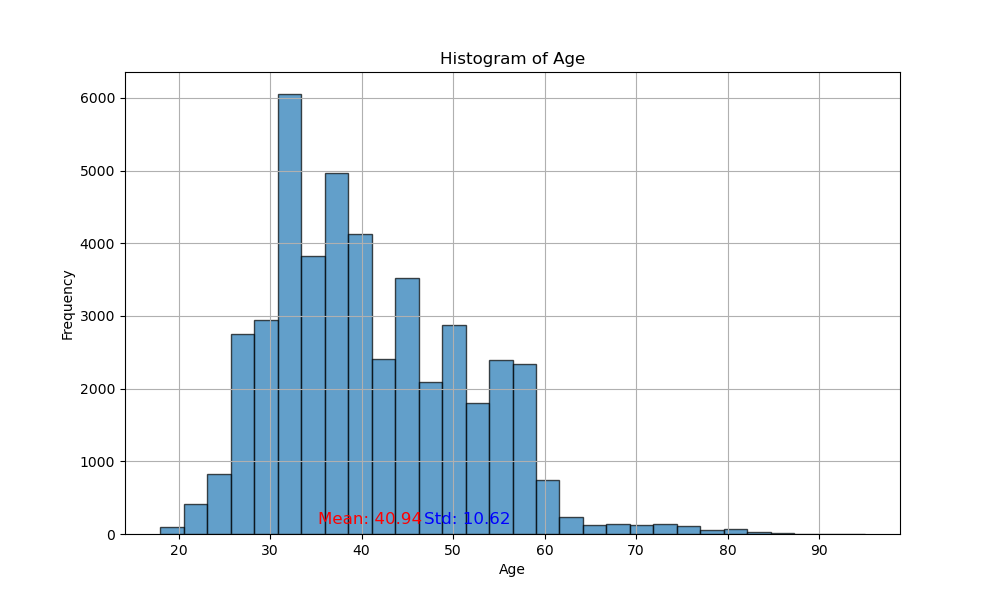
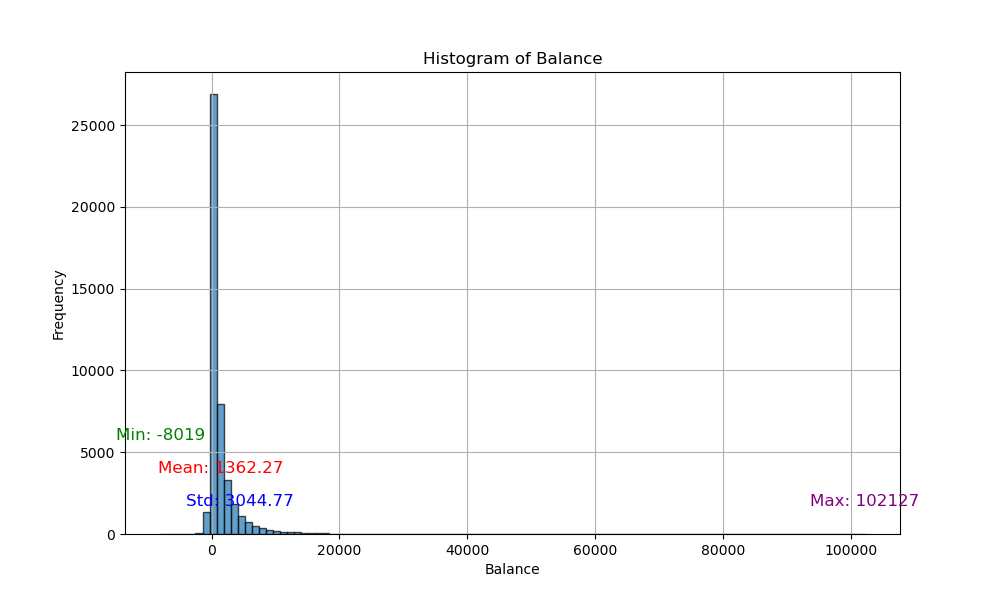
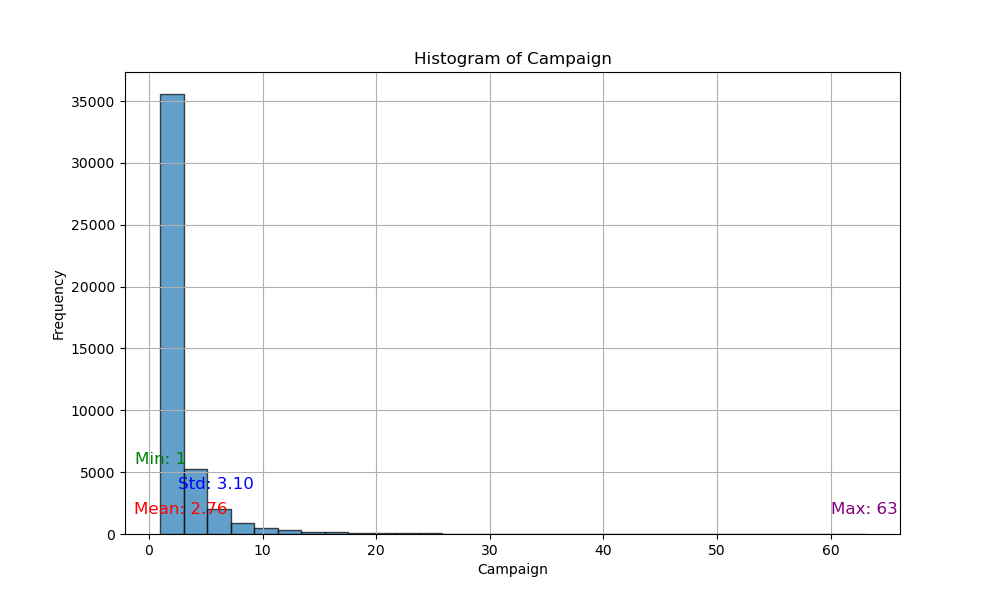
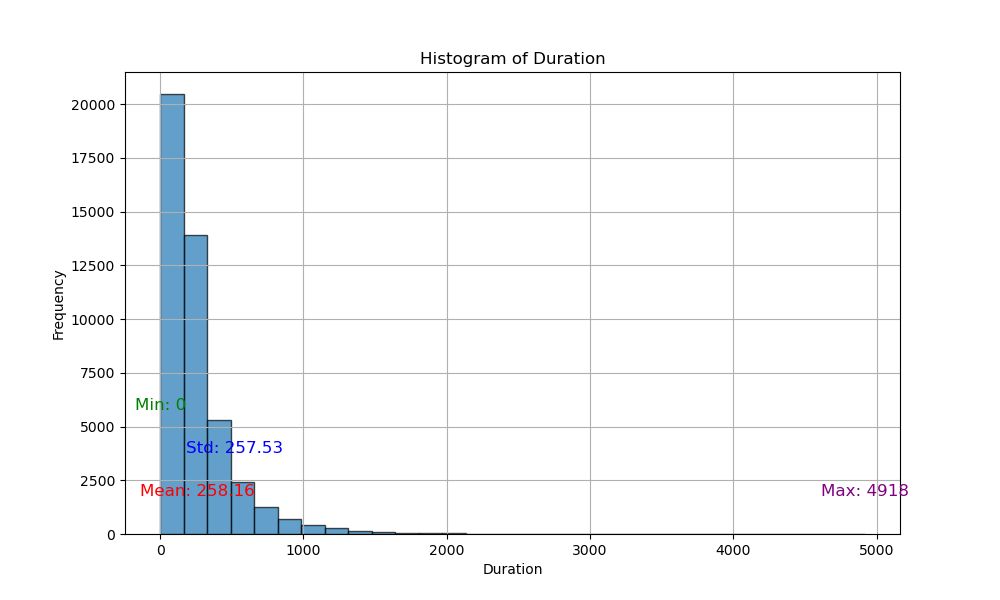
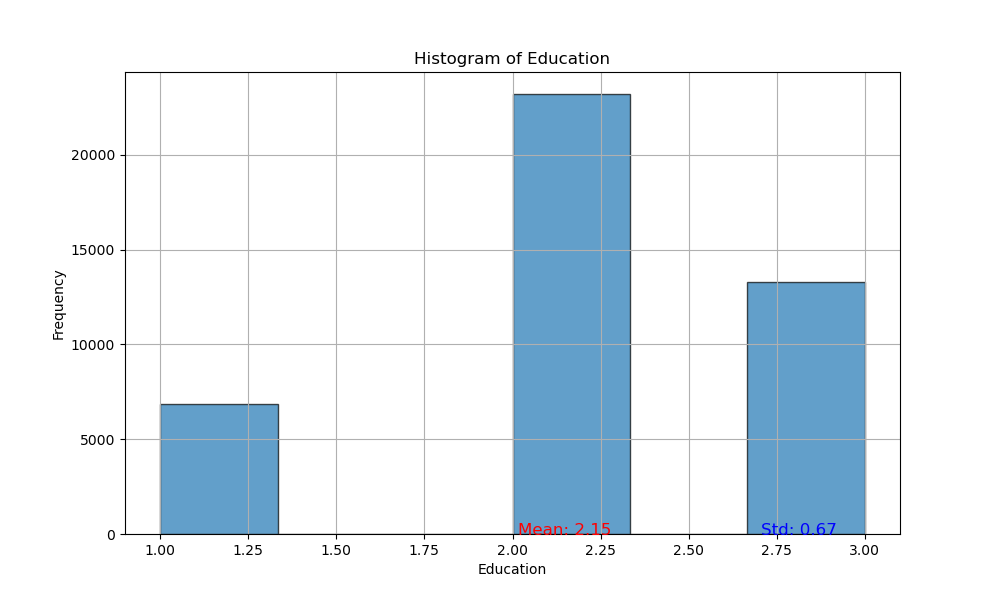
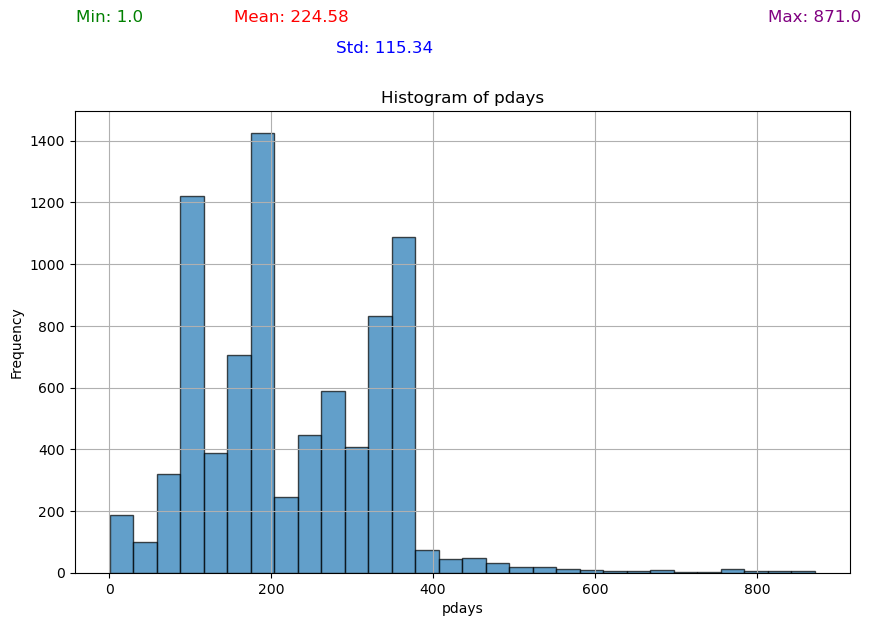
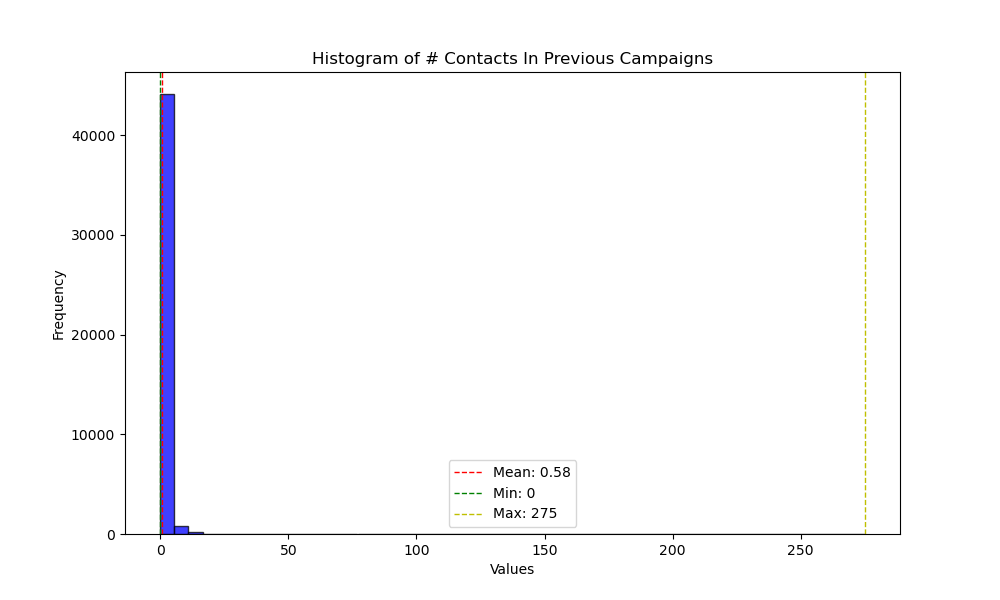
I've verified this observation by plotting the histograms of several numeric variables, which depict distributions that indeed deviate from normality.
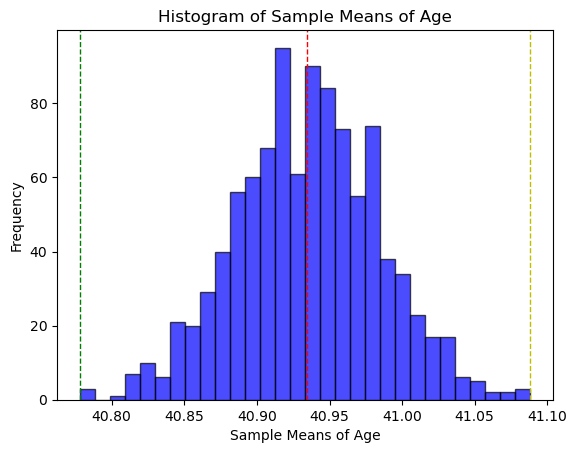
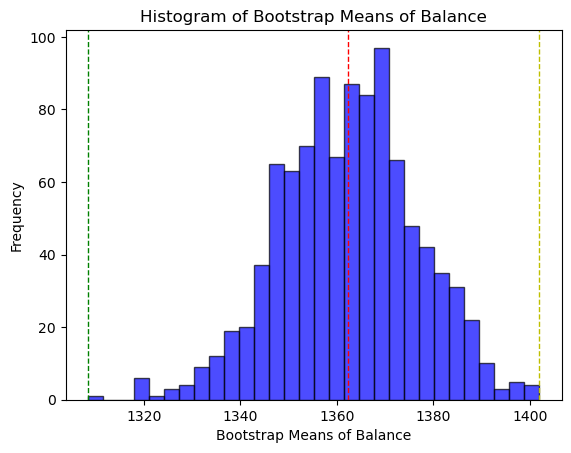
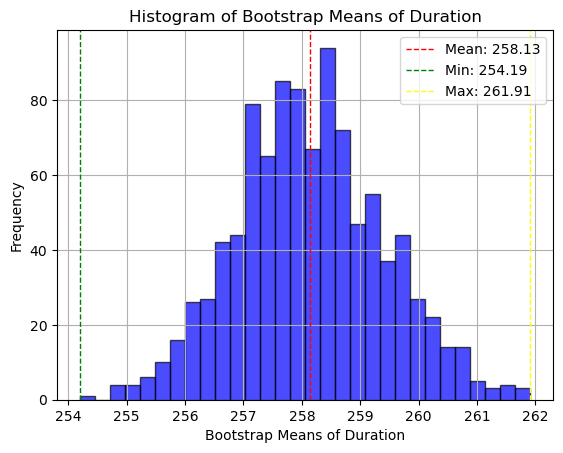
Since normality is preferred for confidence level calculations and assumed for statistical tests like the t-test, I generated additional samples using bootstrapping with replacement. As predicted by the central limit theorem, the resulting sample means distributions approximates normality better than the original distributions.
Each bootstrap sample replicates the size of the original dataset to ensure representativeness. I conducted 1000 iterations (n) for my bootstrap with replacement.
Based on patterns found in the correlations heatmap, I conducted the following hypothesis tests using bootstrapped samples (n = 1000):
-
two-sample t-tests (alpha= 0.05):
- Current campaign success (yes/no) vs. average annual balance ($)
-
chi-square test(alpha= 0.05):
- House loan (yes/no) vs. current campaign success (yes/no)
- Previous campaign's outcome (y/n/unknown/other) vs. current campaign success (yes/no)
- Contact method vs. current campaign success (yes/no)
- Contact method vs. previous campaign's outcome (y/n/unknown/other)
-
one-way ANOVA (alpha= 0.05):
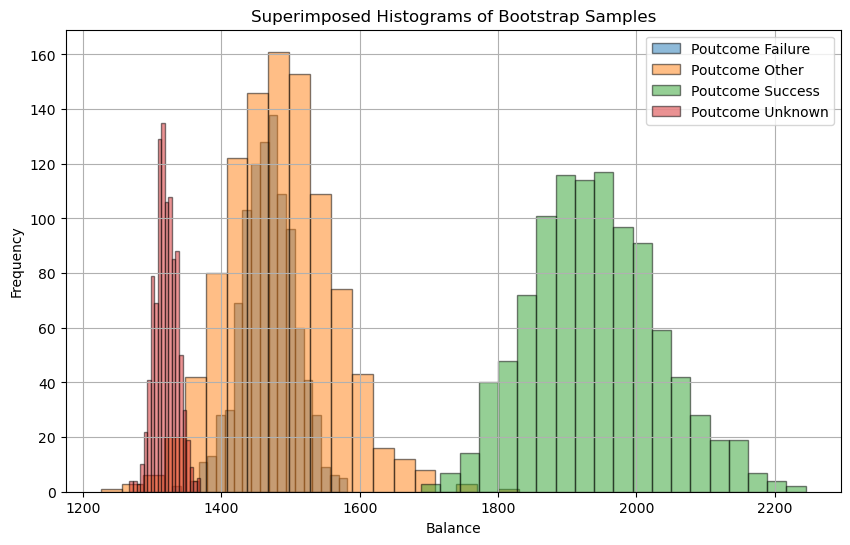
- Previous campaign's outcome (y/n/unknown/other) vs. balance
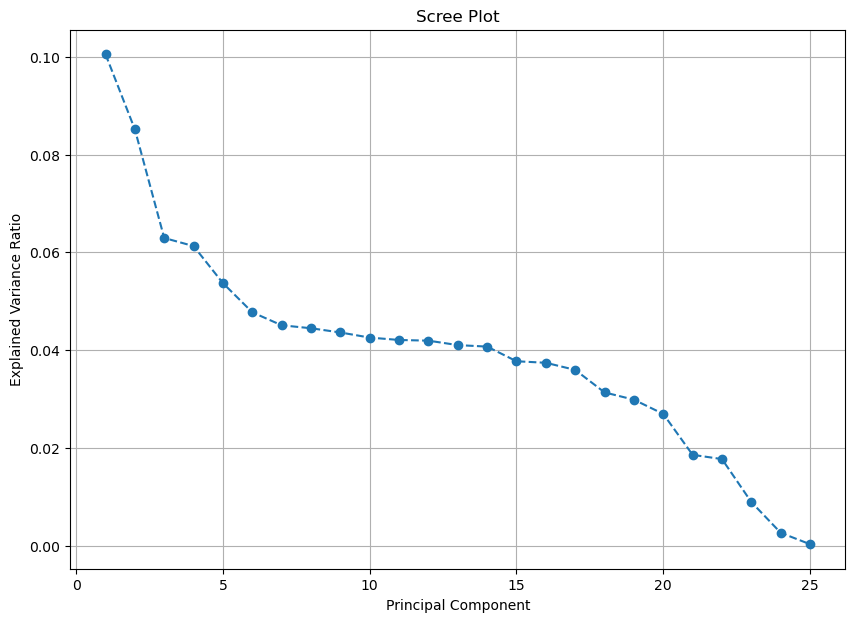
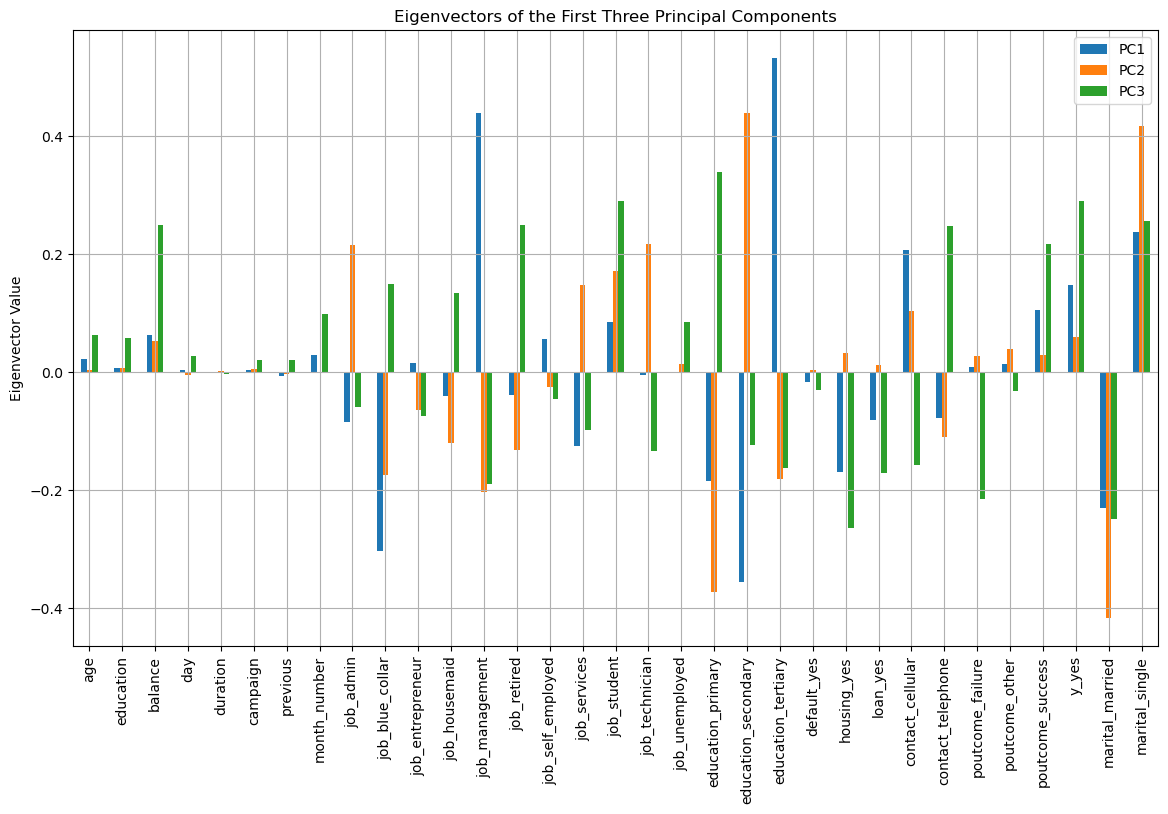
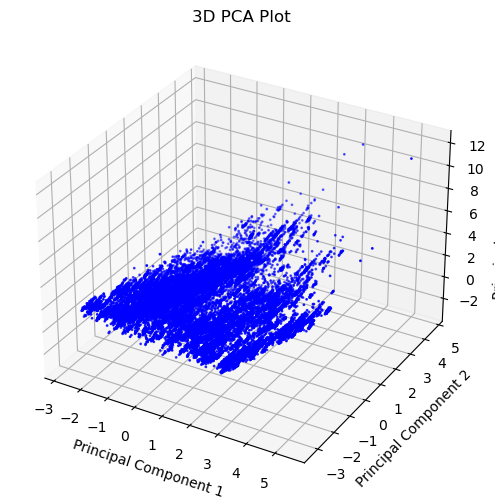
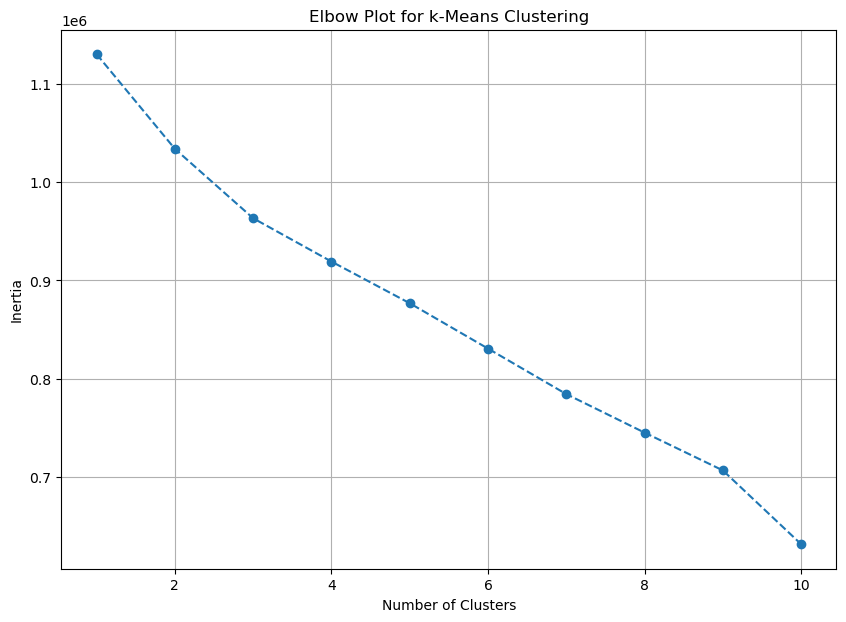
Lastly, I conducted a PCA analysis and k-means clustering, using a Scree Plot and Elbow Plot to find the optimal number of principal components and clusters.
The positive correlations between balance and current campaign success, no housing loan and current campaign success, current campaign failure and yes housing loan support my earlier hypothesis.
Notable positive correlations:
- poutcome_unknown & balance 0.233804984
- y_yes & balance 0.106048857
- y_yes & housing_no 0.139172702
- y_no & housing_yes 0.139172702
- y_no & contact_unknown 0.150934971
- poutcome_unknown & contact_unknown 0.291657431
- poutcome_success & y_yes 0.306788211
Notable negative correlations:
- poutcome_failure & balance -0.174939044
- poutcome_other & balance -0.102639208
- y_yes & balance 0.106048857
- y_no & balance -0.106048857
- y_no & housing_no -0.139172702
- y_yes & housing_yes -0.139172702
- poutcome_unknown & contact_cellular -0.264425506
- y_no & contact_cellular -0.135872936
- y_yes & contact_unknown -0.150934971
Results of the Hypothesis tests:
-
two-sample t-tests (alpha= 0.05):
- Current campaign success (yes/no) vs. average annual balance ($)
- P-value: 0.0
- Reject the null hypothesis: There is a significant difference between the means.
- Current campaign success (yes/no) vs. average annual balance ($)
-
chi-square test(alpha= 0.05):
- House loan (yes/no) vs. current campaign success (yes/no)
- p-value: 2.918797605076633e-192
- Reject the null hypothesis: There is a significant association between housing and current campaign success.
- Previous campaign's outcome (y/n/unknown/other) vs. current campaign success (yes/no)
- p-value: 0.0
- Reject the null hypothesis: There is a significant association between the results of the last campaign and that of the current.
- Contact method vs. current campaign success (yes/no)
- p-value: 3.994899557849592e-230
- Reject the null hypothesis: There is a significant association between the contact method and subscription to a term deposit.
- Contact method vs. previous campaign's outcome (y/n/unknown/other)
- p-value: 0.0
- Reject the null hypothesis: There is a significant association between the contact method and the previous campaign's outcome.
- House loan (yes/no) vs. current campaign success (yes/no)
-
one-way ANOVA (alpha= 0.05):
- Previous campaign's outcome (y/n/unknown/other) vs. balance
- P-value: 0.0
- Reject the null hypothesis: There is a significant difference between the groups.
- Previous campaign's outcome (y/n/unknown/other) vs. balance
PCA
- One column of each dummy variable was ommitted to eliminate multicollinearity, and in addition, all values were scaled to their z-scores.
- Looking at the scree plot, it appears that PC1, PC2 and PC3 account for most of the variation in the data.
K-Means Clustering
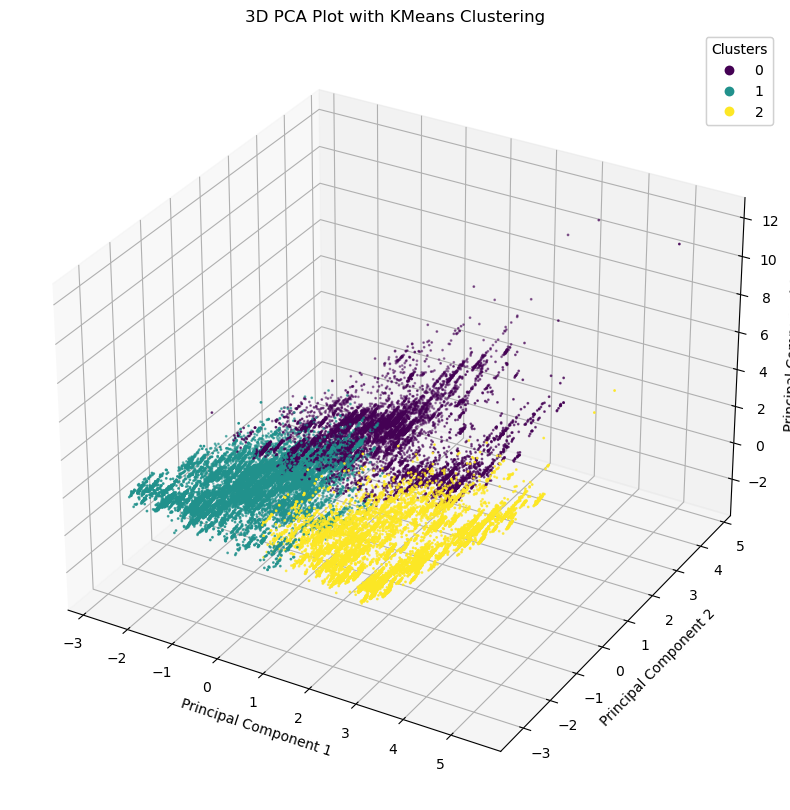
- The elbow plot didn't show a clear bend so I decided to create three clusters (k = 3).
-
There is a significant correlation between having a house loan and the success of the current term loan campaign (p < 0.05), confirming my earlier hypothesis. This might be becauses individuals with house loans may have less available cash to set aside.
-
Additionally, significant associations were found between the effectiveness of the previous and current marketing campaigns (p < 0.05), the contact method used and the current campaign's success (p < 0.05), and the contact method and the previous campaign's success (p < 0.05).
-
Furthermore, there is a notable difference in the annual average balance between clients who subscribe to term loans and those who do not (p < 0.05).
-
Moreover, a significant disparity exists in the annual average balance based on the outcomes of the previous marketing campaign (p < 0.05).
-
K-Means clustering reveals that records in Cluster 1 have high PC2 and low PC1 and PC3.
-
Cluster 2 is characterized by low PC1 and PC3 with variable PC2.
-
Cluster 3 is defined by high PC1, low PC3, and variable PC2.
Cluster Profiles
- Cluster 1: This cluster consists of younger clients who are less financially stable and hold lower-level jobs. They prefer cellular contact and are more likely to be single.
- Cluster 2: Clients in this cluster exhibit lower financial stability, have mixed job types, and are often married. Their contact preferences and outcomes in marketing campaigns vary.
- Cluster 3: This cluster is made up of more financially stable clients in higher-level jobs. They prefer cellular contact, are typically single, and have been more successful in previous marketing campaigns.
Predicting whether a client will subscribe to a term plan in the next contact during a campaign can help small banks optimize their resources by strategically deciding when and whom to contact. More term deposits result in a larger pool of money that the bank can loan out to generate revenue from interest, leading to bank growth. The information in the given dataframe is fairly general and can be obtained through a simple credit check and client profile view. While having more detailed information would be beneficial, this dataset strikes a good balance between being easy to acquire and sufficiently detailed.
Feel free to email me for suggestions or feedback.
UC Irvine Machine Learning Library-- Bank Marketing
Moro, S., Cortez, P., & Rita, P. (2014). A data-driven approach to predict the success of bank telemarketing. Decis. Support Syst., 62, 22-31.
Copyright 2024 Brigitte Yan;
Licensed under the MIT License - https://opensource.org/licenses/MIT


