Work with NuPIC results interactively in a nice web UI. This app is designed to consume and render CSV files output by NuPIC, but it can read any CSV file with numercical data that has a timestamp as one of its fields.
- The first line in the CSV must be a header, containing the names of the fields
- There must be a field labeled
timestampin the list of fields. - The data in the
timestampfield can be either a number or a string. If it is a string, it will attempt to parse the date. To ensure that the app can parse the date, it is recommended that your timestamps conform to one of the following formats:
- ISO 8601:
yyyy-mm-dd[T[hh[:mm[:ss[:ms]]]]] yyyy-mm-dd [hh[:mm[:ss[:ms]]]](Like ISO 8601, but with a space separator for time instead of "T")mm/dd/yyyy [hh[:mm[:ss[:ms]]]]
- Note that at this time, the app strips out the first two rows of data. This is because the output of the OPF has three header rows. We are working on a way to automatically detect if the second and third rows are data or meta-data, so this does not happen on non-OPF CSV files.
First, go the the build directory:
cd build
then, launch a simple Web server:
python -m SimpleHTTPServer 8080
Open your web browser and go to http://localhost:8080
There are demo files in examples/ for NuPIC OPF, NAB and generic CSV files.
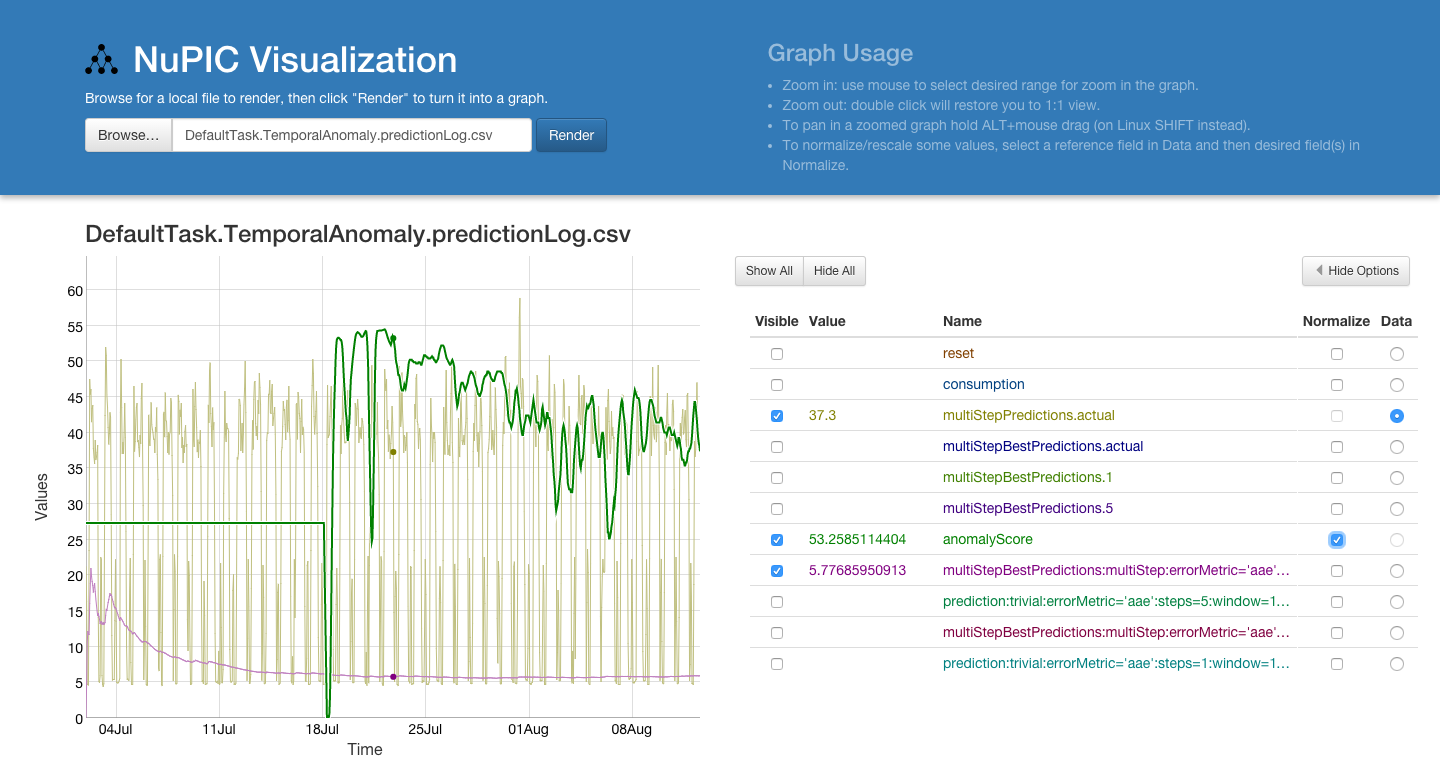
- Select a local file by clicking 'Browse...'
- If the app was able to parse the file, the 'Render' button will become active.
- Click the 'Render' button to render the graph.
- To zoom in on the graph, click and drag with the cursor. To zoom out, double-click. To pan on a zoomed graph, hold the ALT key (on Linux, hold the SHIFT key), while dragging the cursor.
- The options to the right of the graph allow the user to:
- Set the visibility of a series
- View the current value of a series, based on where the cursor is over the graph
- Normalize a series to a selected reference series. For example, perhaps you want to compare your 'my_data' field to your 'anomaly_score' field, but your 'my_data' series varies between 100 and 10,000 - while your 'anomaly_score' field varies between 0 and 1. With the default settings, your anomaly score variations will be too small to be visible. By clicking on 'Data' for the 'my_data', and then checking the 'Normalize' checkbox for 'anomaly_score', the 'anomaly_score' will be scaled up to a ratio matching that of the 'my_data' field.
If you are interested in developing, or modifying the code, follow these instructions:
- Install
nodeandnpm. This will vary depending on your OS. - From the root directory of this project,
npm install. This will install all of the package dependencies. - Make your modifications.
- When you are ready to perform a build, run
gulp. This will build the app in thebuilddirectory. Launch the app as described in the "Launch" section, above.