CSCI 665 NYIT Fall 2022 - Professor Altion Simo
Team Members
- Robert Trieste rtrieste@nyit.edu 917-806-6333
- Alex Gusmano agusmano@nyit.edu 516-382-0856
- Mohana Pranadeep Potti mpotti@nyit.edu 315-737-1799
- Pavani Gummadi pgumma01@nyit.edu 848-345-0235
- Venkata Ratna Sandeep Paladugu vpalad03@nyit.edu 315-737-1415
- Rajeev Gurram rgurra07@nyit.edu 973-641-9942
- Application Highlights
- Use of Cloud
- Project Structure
- Backend
- Frontend
- Team Meetings
- Jira
- Confluence
Some highlights of this application:
- You may view our live web app here: https://www.usagaspricetracker.com
- This Angular SPA (Single-Page Web Application - with multiple components) was concieved and built by the members listed above in the Fall of 2022 in conjuction with NYIT's CSCI 665 Software Engineering Course taught by Professor Altion Simo.
- The project was as much about team colllaboration and the iterative process of building software as it was about delivering a functioning app.
- Right from the start the Team had to consider the pros and cons of building a web app versus a native mobile application.
- Although native mobile apps have some advantages such as: running faster than web apps in some cases; greater functionality as they have access to system resources; can work offline, etc, the team chose to build a web app due to their inherent advantages such as: web apps do not need to be downloaded or installed; function in-browser; easy to maintain as they have a common codebase regardless of mobile platform; do not require app store approval, etc.
- During 2022 the US much like the rest of the World saw oil and gasoline prices spike. As this was maintstream economic news with implications for an already delicate supply-chain (diesel fule has a direct impact on the the end price of goods and services here in the United States) the Team decided to build an app that would easily show gasoline prices across the coutry.
- Our USA Gas Price Tracker employs a python backend that collects publicly-available gas price data published by the American Automobile Association.
- The app adds a data visualization layer by presenting the gas prices by state in a heatmap (chloropleth) with the help of open-source python-based library Plotly and Chart-Studio. This is a great open-source alternative to software such as Tableau and MSFT's Power BI which can become expensive.
- The raw data collected is written to and stored in Google Cloud Platform (Google Sheets) as this is a more economical set-up than using a fully-fledged RDBMS such as SQL Server.
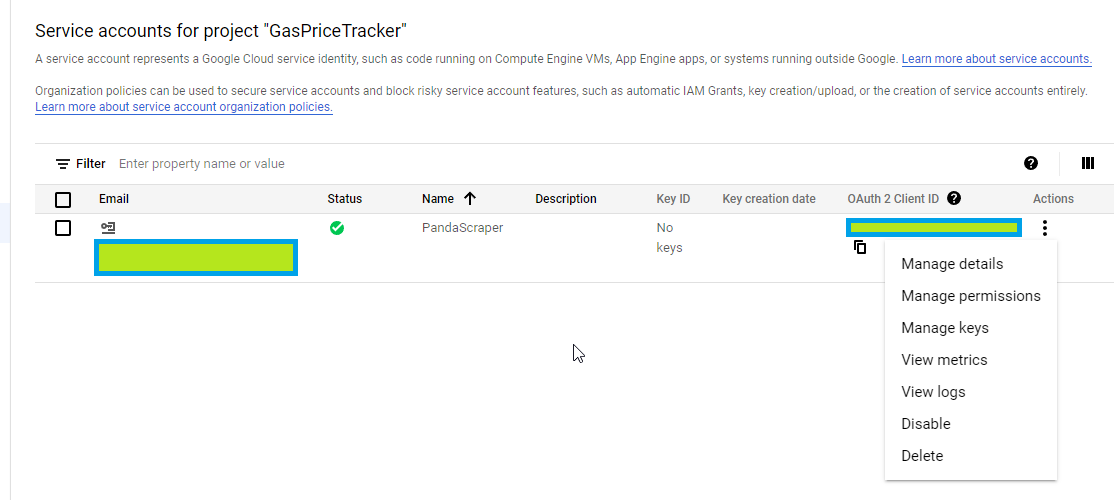
- Some of the main sticking points and more time-consuming portions of building this app were getting the various platforms and services talking to one another: such as extracting Google credentials and getting the AWS-EC2 hosted python apps talking through the Google Sheets API with their service account authentication:
- Once things were up and runnnig the Angular frontend made for an efficient presentation layer. By use of backend running timed CRON jobs on the server the app runs by itelf and collects and presents new fresh data daily.
Use of the Cloud - Touch all 3 major Cloud Platforms:
- We utilize infrastructure from all three major cloud providers:
- Amazon AWS for the backend to host a Linux EC2 instance.
- Google Cloud Platform (GCP) service account to host the dataframe produced.
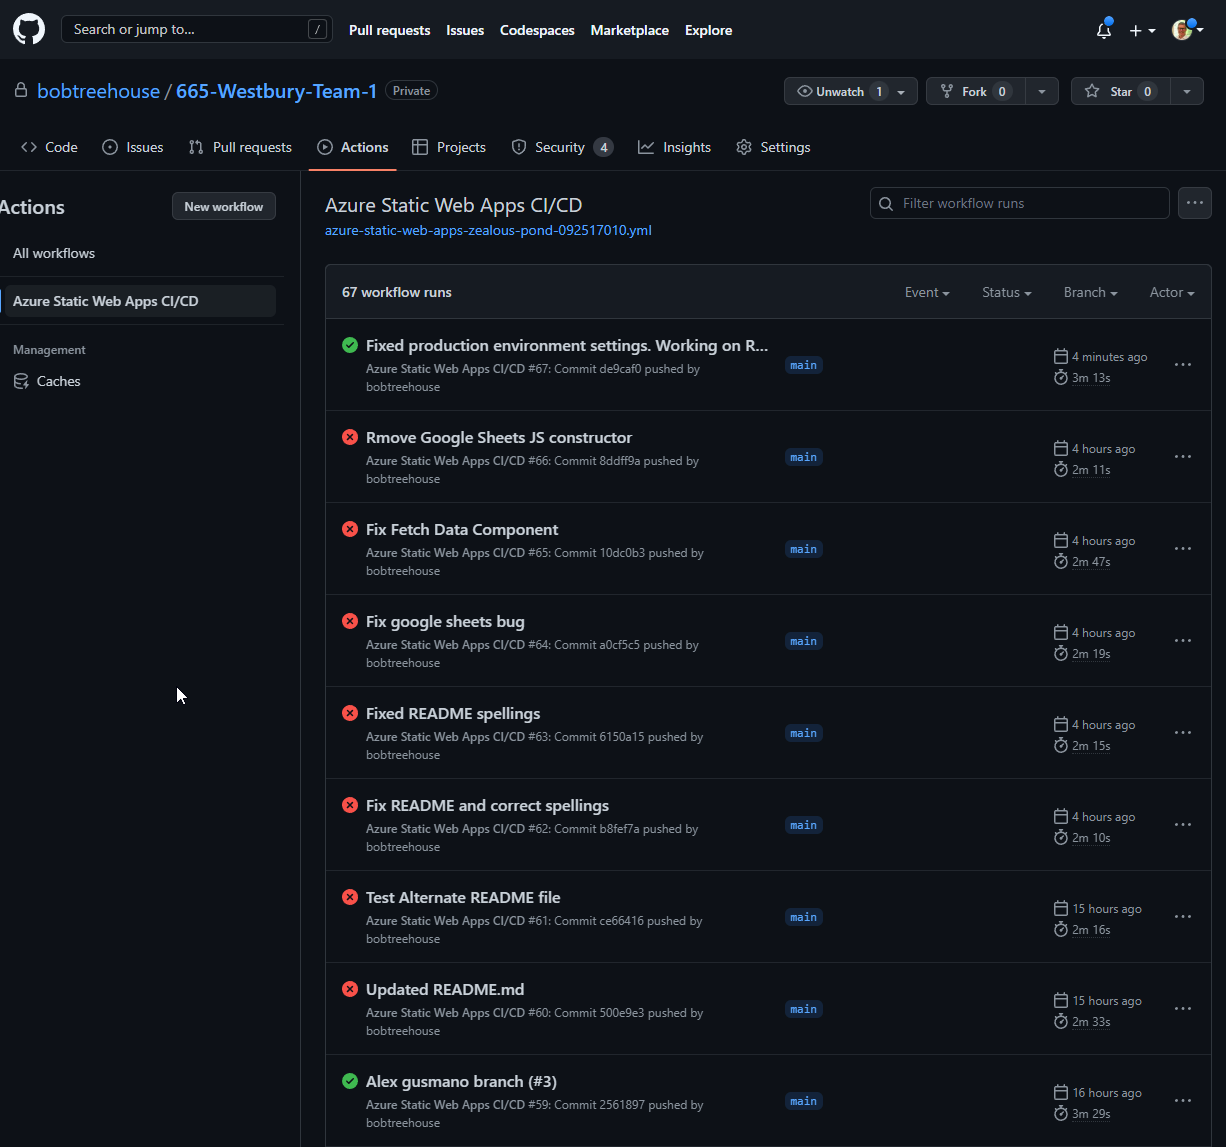
- Microsoft Azure to host and run our static web app with a CI/CD pipeline through Git Hub.
Constructing the application:
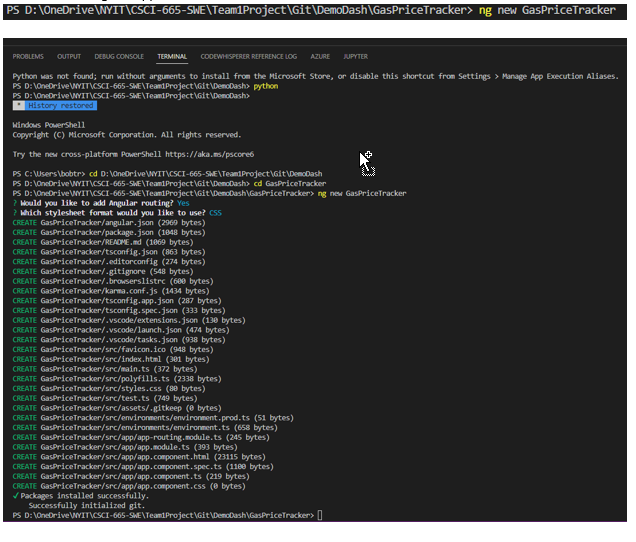
- Built with Visual Studio Code and
- Angular utilizing TypeScript for client-side code.
- VS Code has Angular CLI integration. In development mode, there's no need to run
ng serve.
It runs in the background automatically, so your client-side resources are dynamically built on demand and the page refreshes
when you modify any file. - Efficient production builds. In production mode, development-time features are disabled, and
your
dotnet publishconfiguration
automatically invokesng buildto produce minified, ahead-of-time compiled JavaScript files. - By hosting our application as a Microsoft Azure Static Web App and utilizing GutHub as the codebase repositiory,
we can build with CI/CD through Git Hub actions and employ "Red to Green" development.
Backend:
- The process kicks off daily with CRON
scheduler in EC2 running Python
scripts that collect publicly-available gas price data published
by the American Automobile Association - The first Python script scrapes the gas price data from the web and writes it as a CSV file to Google Sheets through the API with credentials.
- The second Python script reads that CSV into a Pandas dataframe and then uses the open source charting Python library Plotly to create the choropleth heatmap.
- Libraries such as Beautiful Soup, Pandas, Pydrive,
Google Auth, and Google Sheets
API help accomplish all of this and
employ the
software engineering concept of efficient reuse.
Frontend:
- Angular utilizing TypeScript for client-side code. In VS Code creating the app and adding components with Angular 'ng build' directives.
- The Plotly chart is hosted in Chart-Studio from where it is then embedded into our site through the Angular front end.
- Bootstrap for layout and styling.
Team Meetings:
- Ran Angular Test(s) Found Error caused by Change in title (addition of spaces) Ex:"USAGasPriceTracker" -> "USA Gas Price Tracker" Error is purely cosmetic and negligable when it comes to function of the code.
- Also went over how the project works from Frontend To Backend
- Discussed Readme Documentation as well as project FrontEnd to BackEnd Functionality Guided Pranadeep as to how to formatt README.md
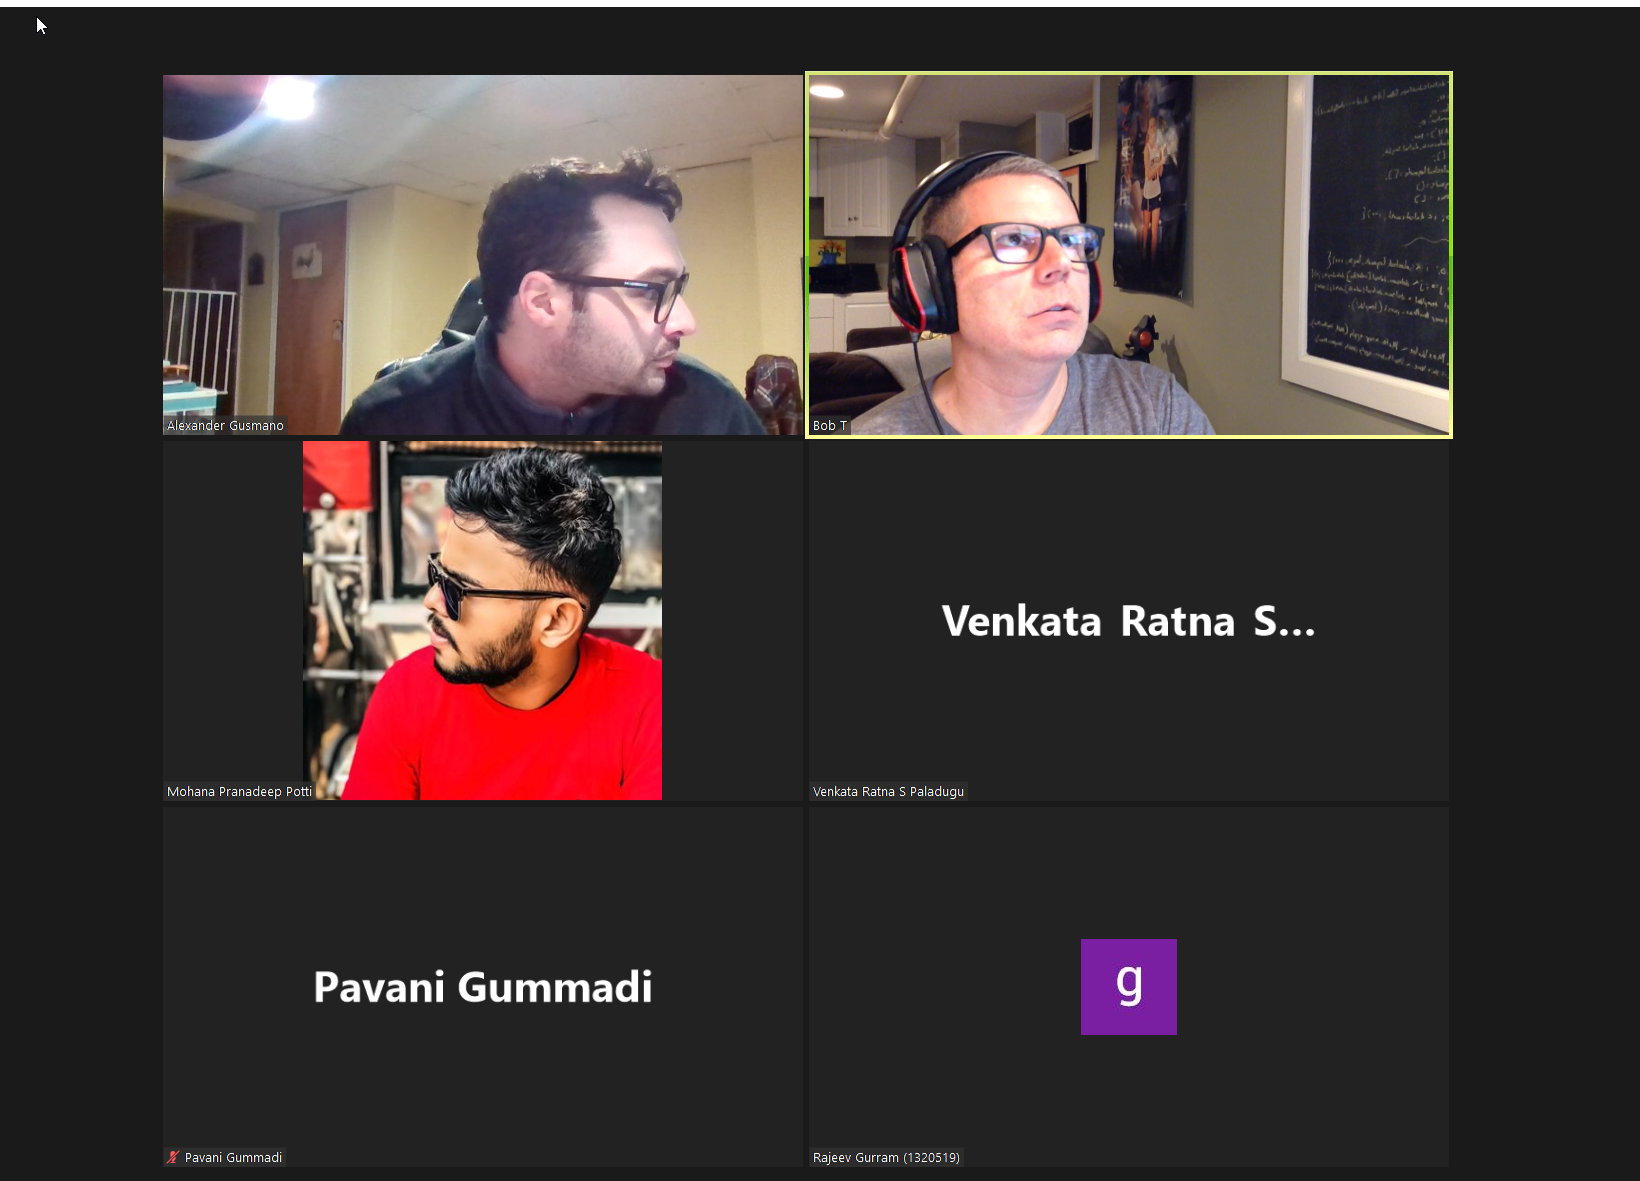
- Our team meet via Zoom video conference and used a private WhatsApp Group to schedule meetings. - We discussed **iterative** approach to building the project.
Jira:
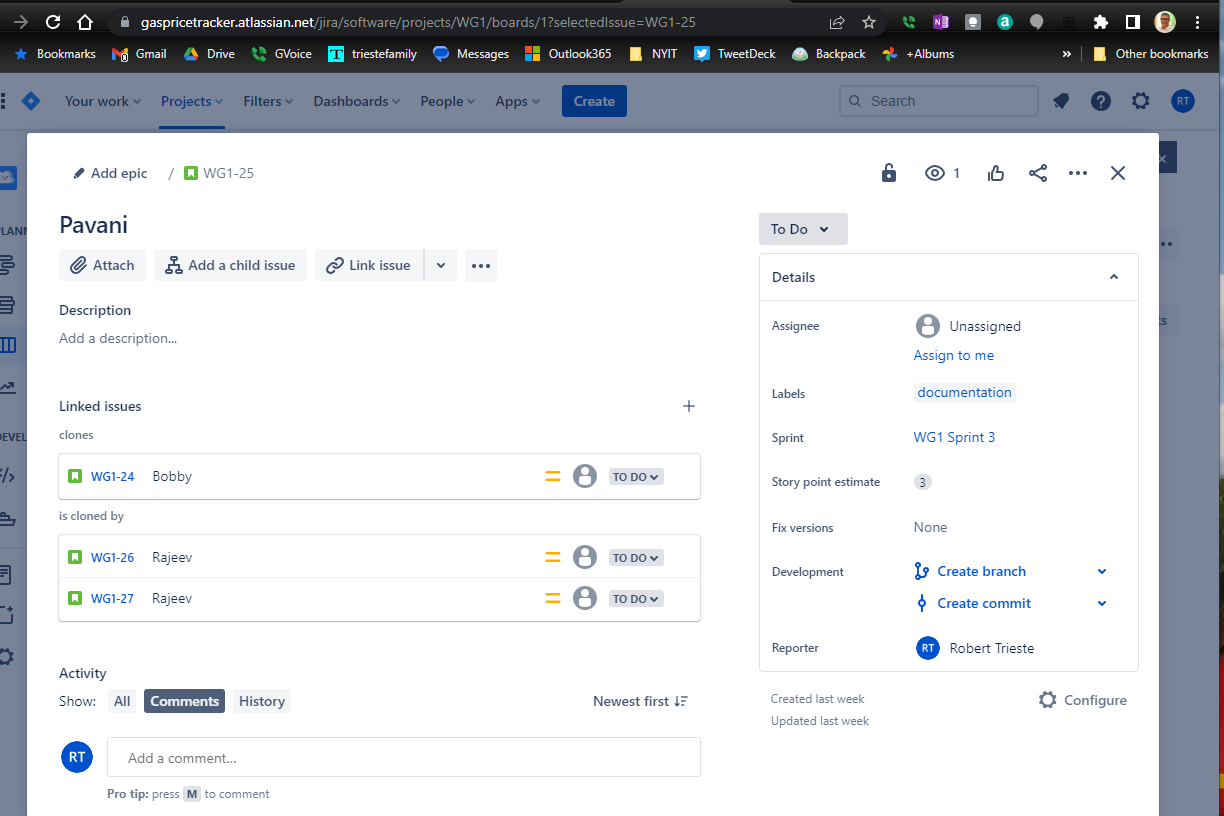
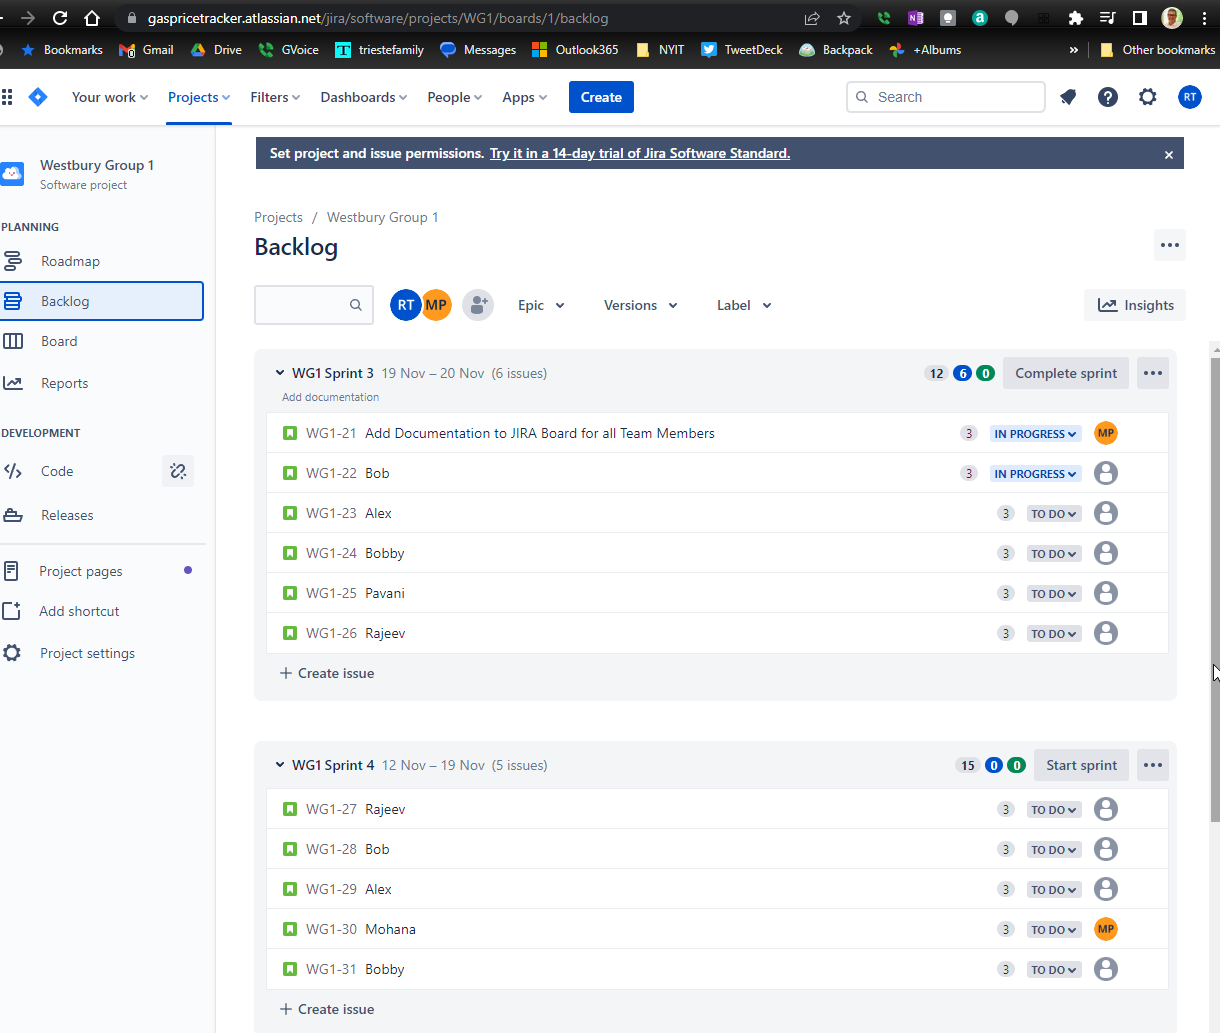
- We utilized Jira boards (Atlassian Software) to add and assign tasks and track progress and backlog.
Confluence:
- We utilized Confluence pages (Atlassian Software) to log supporting research and construct our own 'How-To's' for team knowledge sharing.
