Laplacian structural decomposition music visualization
LSD_VIZ is a web-based, multi-level music structure analysis visualizer. The analysis is based on the spectral clustering algorithm of
McFee, Brian, and Dan Ellis. "Analyzing Song Structure with Spectral Clustering." ISMIR. 2014.
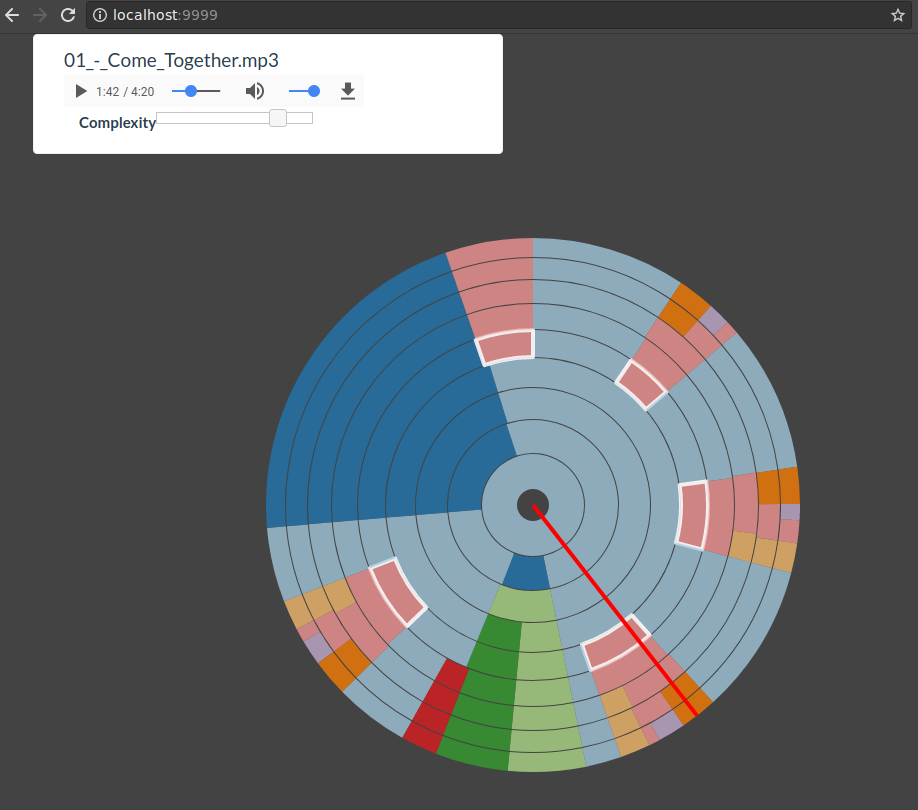
Here's how it looks on The Beatles - Come Together:
Installation
- Clone the repository:
git clone https://github.com/bmcfee/lsd_viz.git lsd_viz - Enter the directory:
cd lsd_viz - Install the requirements:
pip install -r requirements.txt
Usage
To analyze a song, run the following command:
python lsd_viz.py /path/to/your_song.mp3
By default, this will launch a local web server on port 9999. To view the analysis, point your web browser at (http://127.0.0.1:9999/).
To change the port and host configuration, see the command-line options by saying python lsd_viz.py -h.
Description
The visualization presents the song's structure as concentric rings, with time arranged clockwise from the top of the ring. An audio playback widget is provided, and as the song plays, a red play-head will sweep over the visualization. A slider is provided to control the complexity of the display: the center ring is the simplest (fewest distinct component types), and outer rings illustrate more complex or precise structural elements. Similar colors within a ring correspond loosely to repetitions of segments: you can click on any segment to jump directly to its beginning, and it will automatically highlight all other repetitions of that segment.