bmaingret / covid-19

Simple notebook for covid data manipulation

Geek Repo:Geek Repo

Github PK Tool:Github PK Tool

COVID-19 - New case and death rate / Morbidity

We only use ECDC data source for now (c.f. ourworldindata.org

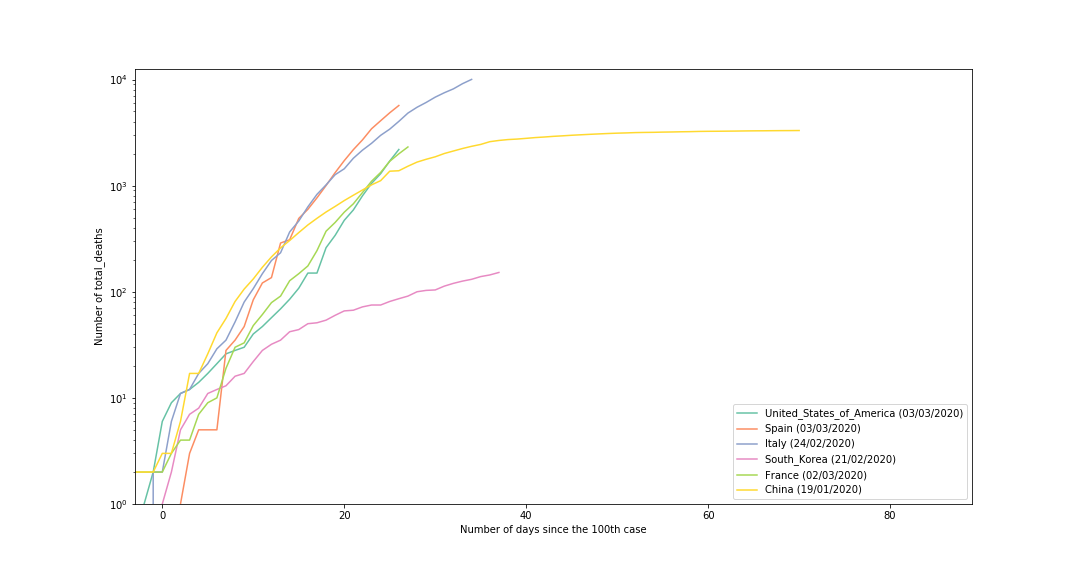
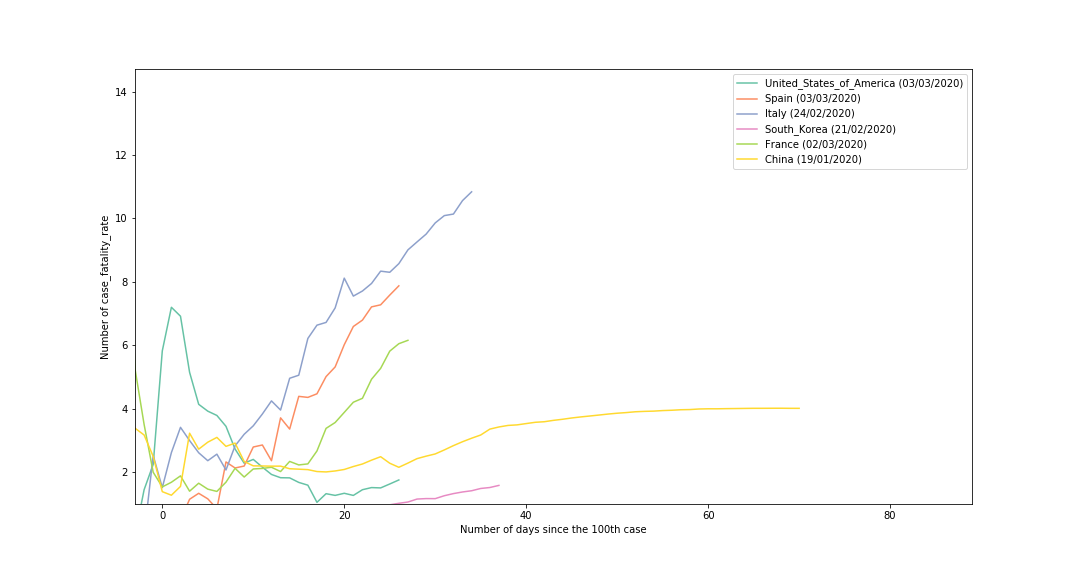
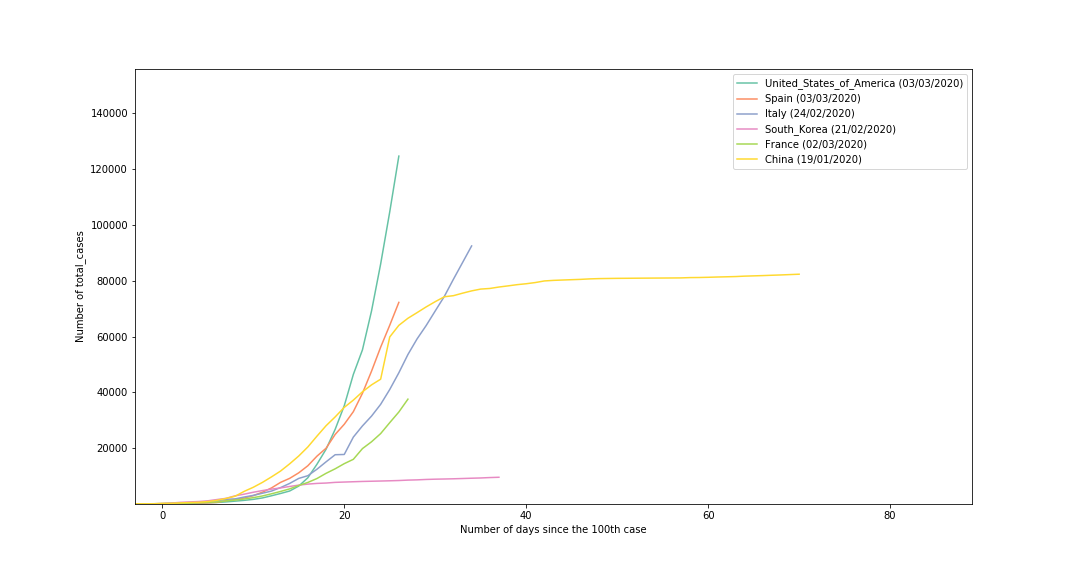
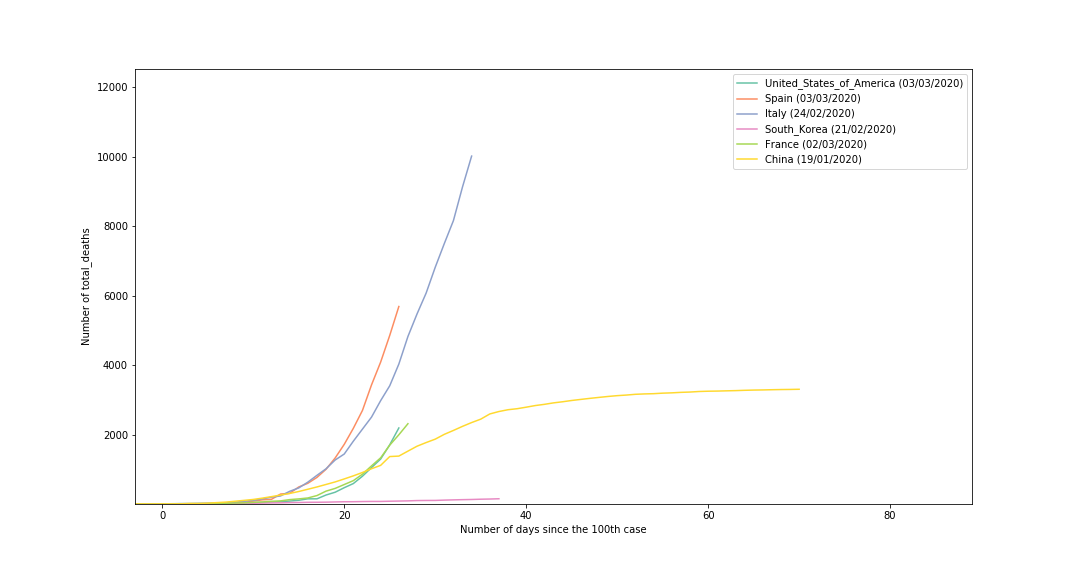
The date are shifted to have a day-0 for each country corresponding to the first x cases indicated in the ECDC dataset.

These start dates are indicated in the legend for each graph.

All the code is in the notebook of this repository. Run and Edit in Google Colab
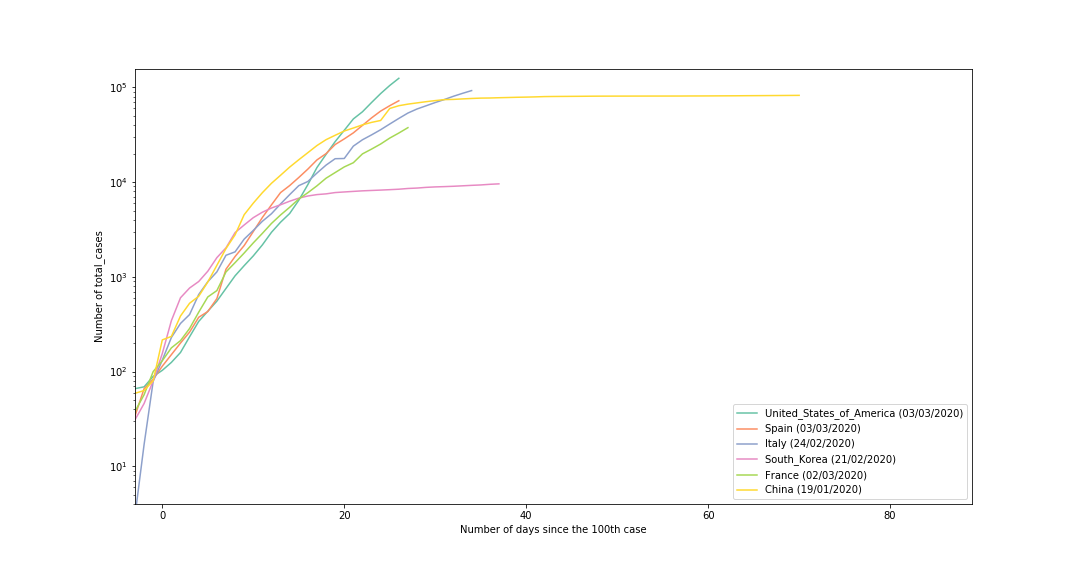
Graphs as of 29/03/2020

Total cases

Total deaths

Morbidity (%of deaths per total cases)

Total cases (linear y-axis)

Total deaths (linear y-axis)

About

Simple notebook for covid data manipulation


Languages

Language:Jupyter Notebook 100.0%