Monitor Flask application through custom StatsD metrics with Prometheus and Grafana.
- Flask app sends StatsD format metrics by UDP to statsd_exporter
- Prometheus scrapes prometheus format metrics from statsd_exporter
- Grafana queries data from Prometheus
+-----------------+                     +-------------------+                        +--------------+               +-----------+
|  Flask(StatsD)  |---(UDP repeater)--->|  statsd_exporter  |<---(scrape /metrics)---|  Prometheus  | <---(query)---|  Grafana  |
+-----------------+ +-------------------+ +--------------+ +-----------+-
Build application image and start all service with docker-compose
docker-compose build
docker-compose up -d
-
Send requests with siege to flask app
bash request-script.sh
-
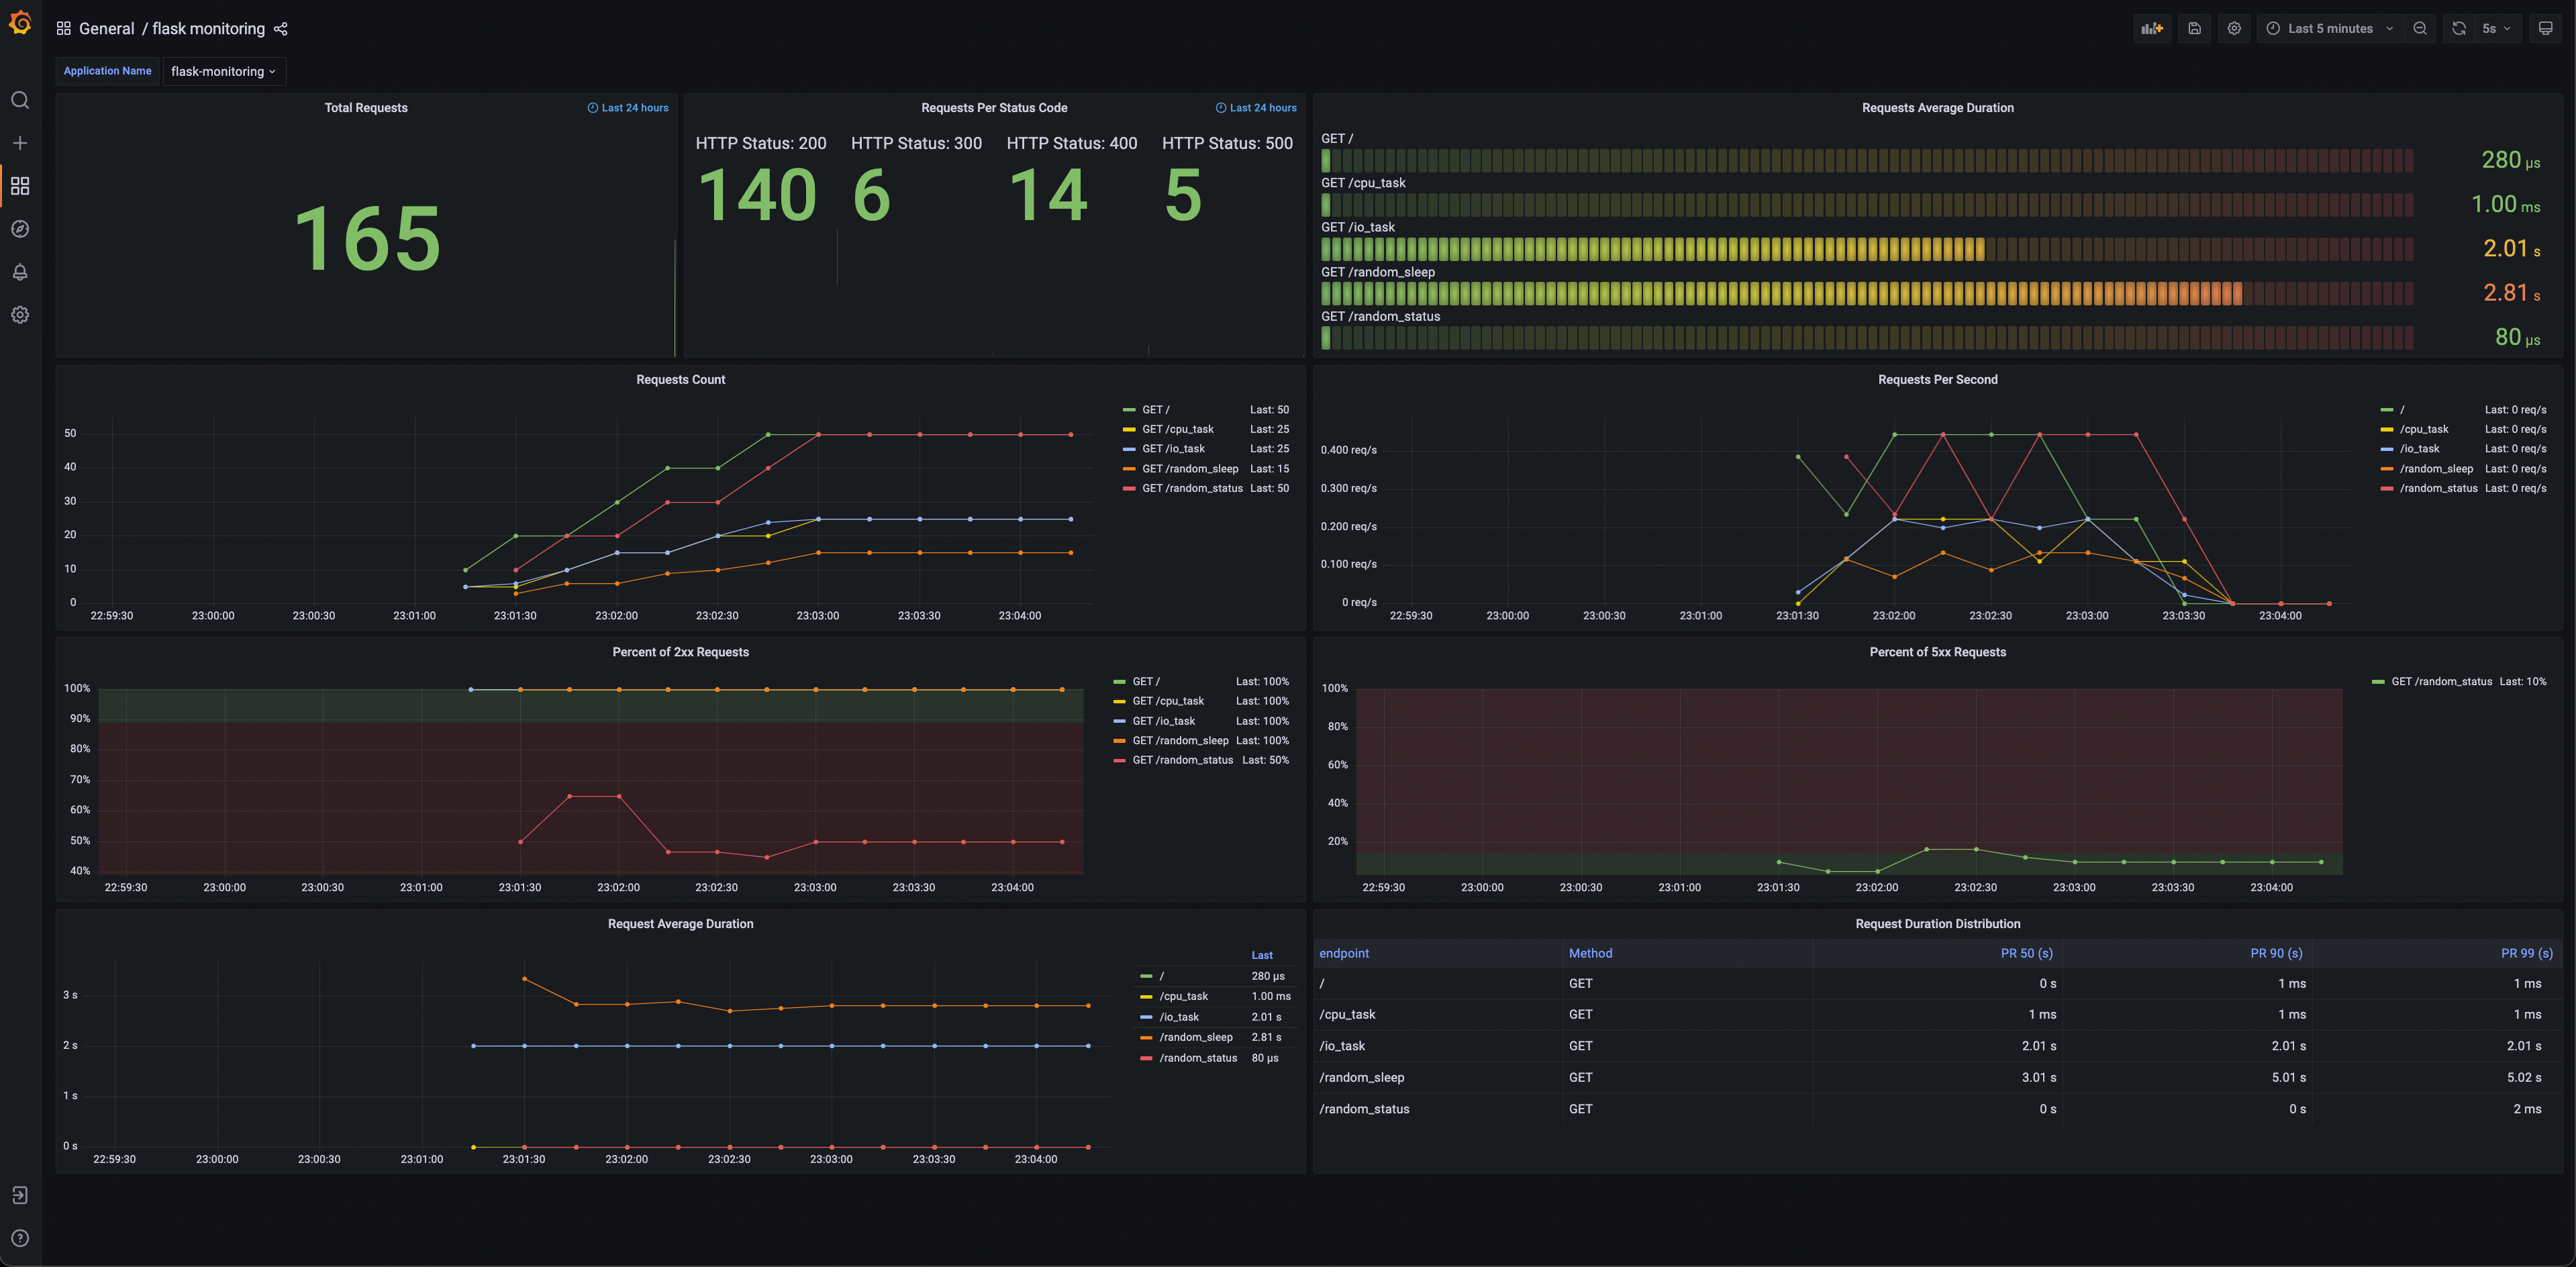
Check predefined dashboard
flask monitoringon Grafana http://localhost:3000/Dashboard screenshot:
Dashboard is also available on Grafana Dashboards.

- Use Datadog Python library to send StatsD format metrics in
flask_app/utils.py.setting_statsd: Register StatsD host and port with environment variableSTATSD_HOST,STATSD_PORTStatsdMiddleware: Add custom metrics
- Initial statsd with
setting_statsd, and addStatsdMiddlewareto flask app inflask_app/app.py.
statsd exporter receives StatsD-style metrics and exports them as Prometheus metrics.
Ports:
- 9125: default StatsD request listen port, send StatsD request to this port
- 9102: Web expose port, get prometheus metrics from this port
Prometheus metrics is available on http://localhost:9102/metrics.
Setting scrape job of statsd-exporter with config file etc/prometheus/prometheus.yml.
scrape_configs:
  - job_name: 'statsd-exporter'
    static_configs:
      - targets: ['statsd-exporter:9102']
Prometheus build-in web UI is available on http://localhost:9090.
Add prometheus to data source with config file etc/grafana/datasource.yml.
datasources:
  # <string, required> name of the datasource. Required
  - name: Prometheus
    # <string, required> datasource type. Required
    type: prometheus
    # <string, required> access mode. proxy or direct (Server or Browser in the UI). Required
    access: proxy
    # <int> org id. will default to orgId 1 if not specified
    orgId: 1
    # <string> custom UID which can be used to reference this datasource in other parts of the configuration, if not specified will be generated automatically
    # uid: my_unique_uid
    # <string> url
    url: http://prometheus:9090
    # <bool> mark as default datasource. Max one per org
    isDefault: true
    version: 1
    # <bool> allow users to edit datasources from the UI.
    editable: false
Load predefined dashboard with etc/dashboards.yaml and etc/dashboards/flask-monitoring.json.
# grafana in docker-compose.yaml
grafana:
    image: grafana/grafana:8.4.3
    volumes:
      - ./etc/grafana/:/etc/grafana/provisioning/datasources
      - ./etc/dashboards.yaml:/etc/grafana/provisioning/dashboards/dashboards.yaml # dashboard setting
- ./etc/dashboards:/etc/grafana/dashboards # dashboard json files directoryFlask monitoring dashboard from etc/dashboards/flask-monitoring.json
This dashboard follows RED method proposed by Weaveworks, and monitors three key metrics:
- Rate: requests rate, request count over past 24 hours
- Errors: 2xx rate, 5xx rate, cumulative number of each status code over past 24 hours
- Duration: average request duration, request duration distribution (PR50, PR90, PR99)