A proof-of-concept to get Azure monitor metrics by Python
You could have a Azure Service principal created and keep yout variables, for example:
az ad sp create-for-rbac --name azure-monitor-test
Maybe you have more than one subscription and would like to use the same SP for both. So try run the comand as presented below:
az ad sp create-for-rbac --name logicalis-maas-azure-monitor \
    --role Reader \
    --scopes /subscriptions/<subscription-1> \
        /subscriptions/<subscription-2> \
        /subscriptions/<subscription-3>
For additional information or do it by Azure panel, go thru this link
And result will be something like:
{
  "appId": "aaaaaa-1234-5c67-0000-abcdefg",
  "displayName": "azure-monitor-test",
  "name": "http://azure-monitor-test",
  "password": "s3cret",
  "tenant": "123az567-89ad-99aa-bbcc1-abvcdfa"
Or declare using environment variables:
export AZ_TENANT_ID="something"
export AZ_APP_ID="something"
export AZ_APP_PASSWORD="something"
export AZ_SUBSCRIPTION_ID="something"
#List AZ Resource Groups #az group list --output table
To discover Available Metrics for a Azure product:
get_azmonitordata.py -M "name,resource_group_name,type"
To get AZ Metric values:
get_azmonitordata.py -m "name,resource_group_name,type,metric_name,aggregation"
type: Azure Components granted by this script. :
- AKS: Azure Kubernetes Services
- ADF: Data Factory
- APIM: API Management
- VM: Virtual Machines
- WEB: App WebServices
- SQL: Azure databases
- CONNECTION: Azure connections [app_gateway or vpn_gateway]
aggregation : metric aggregation, depends of metric
- total: Gets all values in a timerange, and sums it.
- average: presents a mean value in the timerange.
SPECIFIC TIMERANGES (default is 5)
Use the option -t to define a custom time minute range, in minutes. Example:
./az_getmonitormetrics.py -m "cclient-aks-prod,resourcegroup_name,AKS,node_disk_usage_bytes,average" -t 10
TODO:
- Aggregate others Azure components in the list
- AKS: Split metrics by nodes (e.g: node memory, presenting each node separated)
To use in Zabbix, follow these instructions:
- Copy the files in this repository to external scripts folder (usually /usr/lib/zabbix/externalscripts)
- Install the python libraries with
pip install -r requirements.txt
In the frontend, include the template zabbix_template_azure.yaml . There will append all Azure templates.
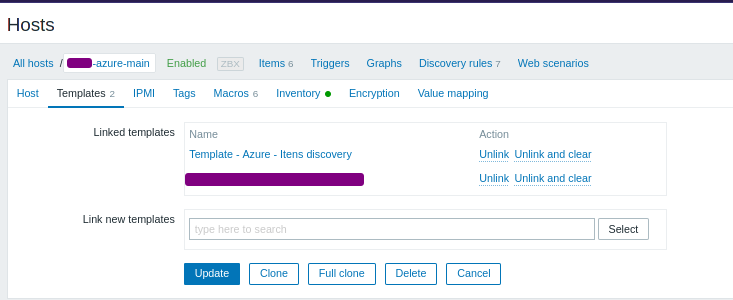
- Create an host and attach the template "Template - Itens Discovery"
- In Macros, put in the values your Azure Service Principal credentials:
-
AZURE_APP_ID
-
AZURE_APP_PASSWORD
-
AZURE_SUBSCRIPTION_ID
-
AZURE_TENANT_ID
-
AZURE CLIENT NAME : This macro exists for Inventory Purposes. The discover will create hosts for each component detected, and add in groups "{$CLIENTNAME} - Azure/ITEM" (E. G.: ClientName - Azure/VirtualMachine) .
Sometimes, you have hosts with same names, like a database and a virtual machine called "foo". Zabbix doesn'allow duplicated names. The way I've found to workaround it was append suffix and prefix on hostnames. So, you'll see hosts with these names:
- sql/foo
- vm/foo
In order to still make sense the names, there's a macro AZURE_xxxx_NAME, where xxxx is the type of item at the macro
