Python-based Monitoring Check Plugins Collection
This Enterprise Class Check Plugin Collection offers a package of more than 130 Python-based, Nagios-compatible check plugins for Icinga, Naemon, Nagios, OP5, Shinken, Sensu and other monitoring applications. Each plugin is a stand-alone command line tool that provides a specific type of check. Typically, your monitoring software will run these check plugins to determine the current status of hosts and services on your network.
The check plugins run on
- Linux - Tested on RHEL 7+, Fedora 30+, Ubuntu Server 16+, Debian 9+, SLES 15+
- Windows - Tested on Windows 10+ and Windows Server 2019+
All plugins are written in Python and licensed under the UNLICENSE, which is a license with no conditions whatsoever that dedicates works to the public domain.
The plugins are fast, reliable and use as few system resources as possible. They uniformly and consistently report the same metrics briefly and precisely on all platforms (for example, always "used" instead of a mixture of "used" and "free"). Automatic detection and Auto-Discovery mechanisms are built-in where possible. Using meaningful default settings, the plugins trigger WARNs and CRITs only where absolutely necessary. In addition they provide information for troubleshooting. We try to avoid dependencies on 3rd party system libraries where possible.
Support & Sponsoring
The source code is published here without support, but Enterprise Support can be obtained via a Service Contract.
If you like to support our work, please consider donating and become a sponsor:

Running the Check Plugins on Linux
Requirements
Install Python 3 (or Python 2, if needed) on the remote host.
Virtual Environment
If you want to use a virtual environment for Python (optional, but recommended), you could create one in the same directory as the check-plugins.
cd /usr/lib64/nagios/plugins

# Python 3
python3 -m venv --system-site-packages monitoring-plugins-venv3

# Python 2
python2 -m virtualenv --system-site-packages monitoring-plugins-venv2
If you prefer to place the virtual environment somewhere else, you can point the MONITORING_PLUGINS_VENV2 or MONITORING_PLUGINS_VENV3 environment variable to your virtual environment. This takes precedence over the virtual environment above.
Caution
Make sure the
bin/activate_this.pyfile is owned by root and not writeable by any other user, as it is executed by the check plugins (where some are executed usingsudo).
Installation
Get the monitoring check plugins from our Git repository to your local machine or deployment host, using git clone git@github.com:Linuxfabrik/monitoring-plugins.git, or by downloading the tar.gz using curl:
REPO='linuxfabrik/monitoring-plugins'
curl --output monitoring-plugins.tar.gz https://codeload.github.com/${REPO}/tar.gz/refs/tags/$(curl --silent https://api.github.com/repos/${REPO}/releases/latest | jq -r '.tag_name')
The check plugins require our Python libraries. The libraries are in a separate Git repository, as we also use them in other projects. Use git clone git@github.com:Linuxfabrik/lib.git, or by downloading the tar.gz using curl:
REPO='linuxfabrik/lib'
curl --output lib.tar.gz https://codeload.github.com/${REPO}/tar.gz/refs/tags/$(curl --silent https://api.github.com/repos/${REPO}/releases/latest | jq -r '.tag_name')
Extract:
tar xf lib.tar.gz
tar xf monitoring-plugins.tar.gz
Copy the libraries onto the remote host to /usr/lib64/nagios/plugins/lib, and copy some or all Python check plugins to /usr/lib64/nagios/plugins while removing the Python version suffix, for example by doing the following:
REMOTE_USER=root
REMOTE_HOST=192.0.2.74
PYVER=3
SOURCE_LIBS=/path/to/lib
SOURCE_PLUGINS=/path/to/monitoring-plugins/check-plugins
TARGET_DIR=/usr/lib64/nagios/plugins

ssh $REMOTE_USER@$REMOTE_HOST 'mkdir -p $TARGET_DIR/lib'
scp $SOURCE_LIBS/* $REMOTE_HOST:$TARGET_DIR/lib/
for f in $(find $SOURCE_PLUGINS -maxdepth 1 -type d); do f=$(basename $f); scp $SOURCE_PLUGINS/$f/$f$PYVER $REMOTE_HOST:$TARGET_DIR/$f; done
We try to avoid dependencies on 3rd party OS- or Python-libraries wherever possible. If we need to use additional libraries for various reasons (for example psutil), we stick with official versions. Some plugins use the following 3rd-party python libraries, so the easiest way is to install them as well:
- BeautifulSoup4 (on RHEL: from EPEL repo)
- lxml
- mysql.connector (on RHEL: only up to RHEL 7, from EPEL repo)
- psutil (on RHEL: from EPEL repo)
That's it. After that your directory on the remote host should look like this:
/usr/lib64/nagios/plugins/
|-- about-me
|-- disk-smart
|-- ...
|-- lib
|   |-- base2.py
|   |-- base3.py
|   |-- globals2.py
|   |-- ...
|-- ...
Tipp
We also provide a Monitoring-Plugins Role within our LFOps Ansible Collection. This Ansible role deploys the Linuxfabik Monitoring Plugins and the corresponding Monitoring Plugin Library to
/usr/lib64/nagios/plugins/and/usr/lib64/nagios/plugins/librespectively, allowing them to be easily executed by a monitoring system.
sudoers
Some check plugins require sudo-permissions to run. To do this, we provide a sudoers file for your operating system in monitoring-plugins/assets/sudoers, for example CentOS8.sudoers. You need to place this file in /etc/sudoers.d/ on the client.
Note
We are always using the path
/usr/lib64/nagios/plugins/on all Linux OS, even ifnagios-plugins-allinstalls itself to/usr/lib/nagios/plugins/there. This is because adding a command withsudoin Icinga Director, one needs to use the full path of the plugin. See the following GitHub issue.
Upgrade
- Overwrite
/usr/lib64/nagios/plugins/libwith the new libraries. - Overwrite
/usr/lib64/nagios/pluginswith the new plugins. - Copy the new sudoers file to
/etc/sudoers.d/ - Delete all SQLite database files (
*.db) in/tmp.
Running the Check Plugins on Windows
Installation
Simply download the latest zip file containing all plugins from https://download.linuxfabrik.ch/monitoring-plugins/windows/latest.zip and unzip it to C:/ProgramData/icinga2/usr/lib64/nagios/plugins/.
Upgrade
Simply download the latest zip file containing all plugins from https://download.linuxfabrik.ch/monitoring-plugins/windows/latest.zip and overwrite your installation directory.
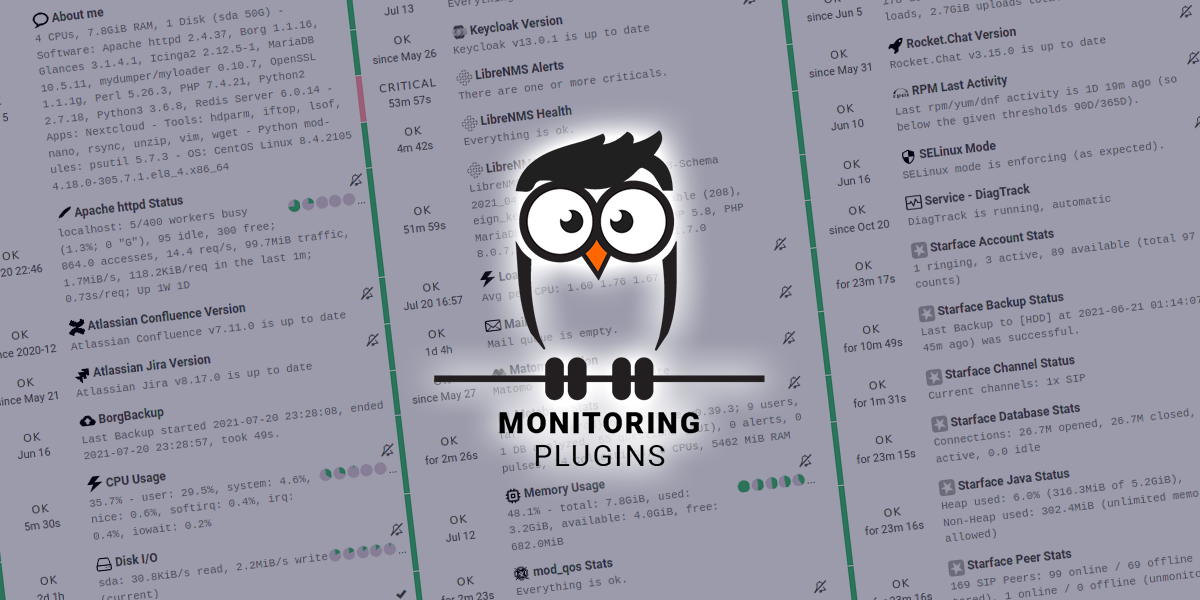
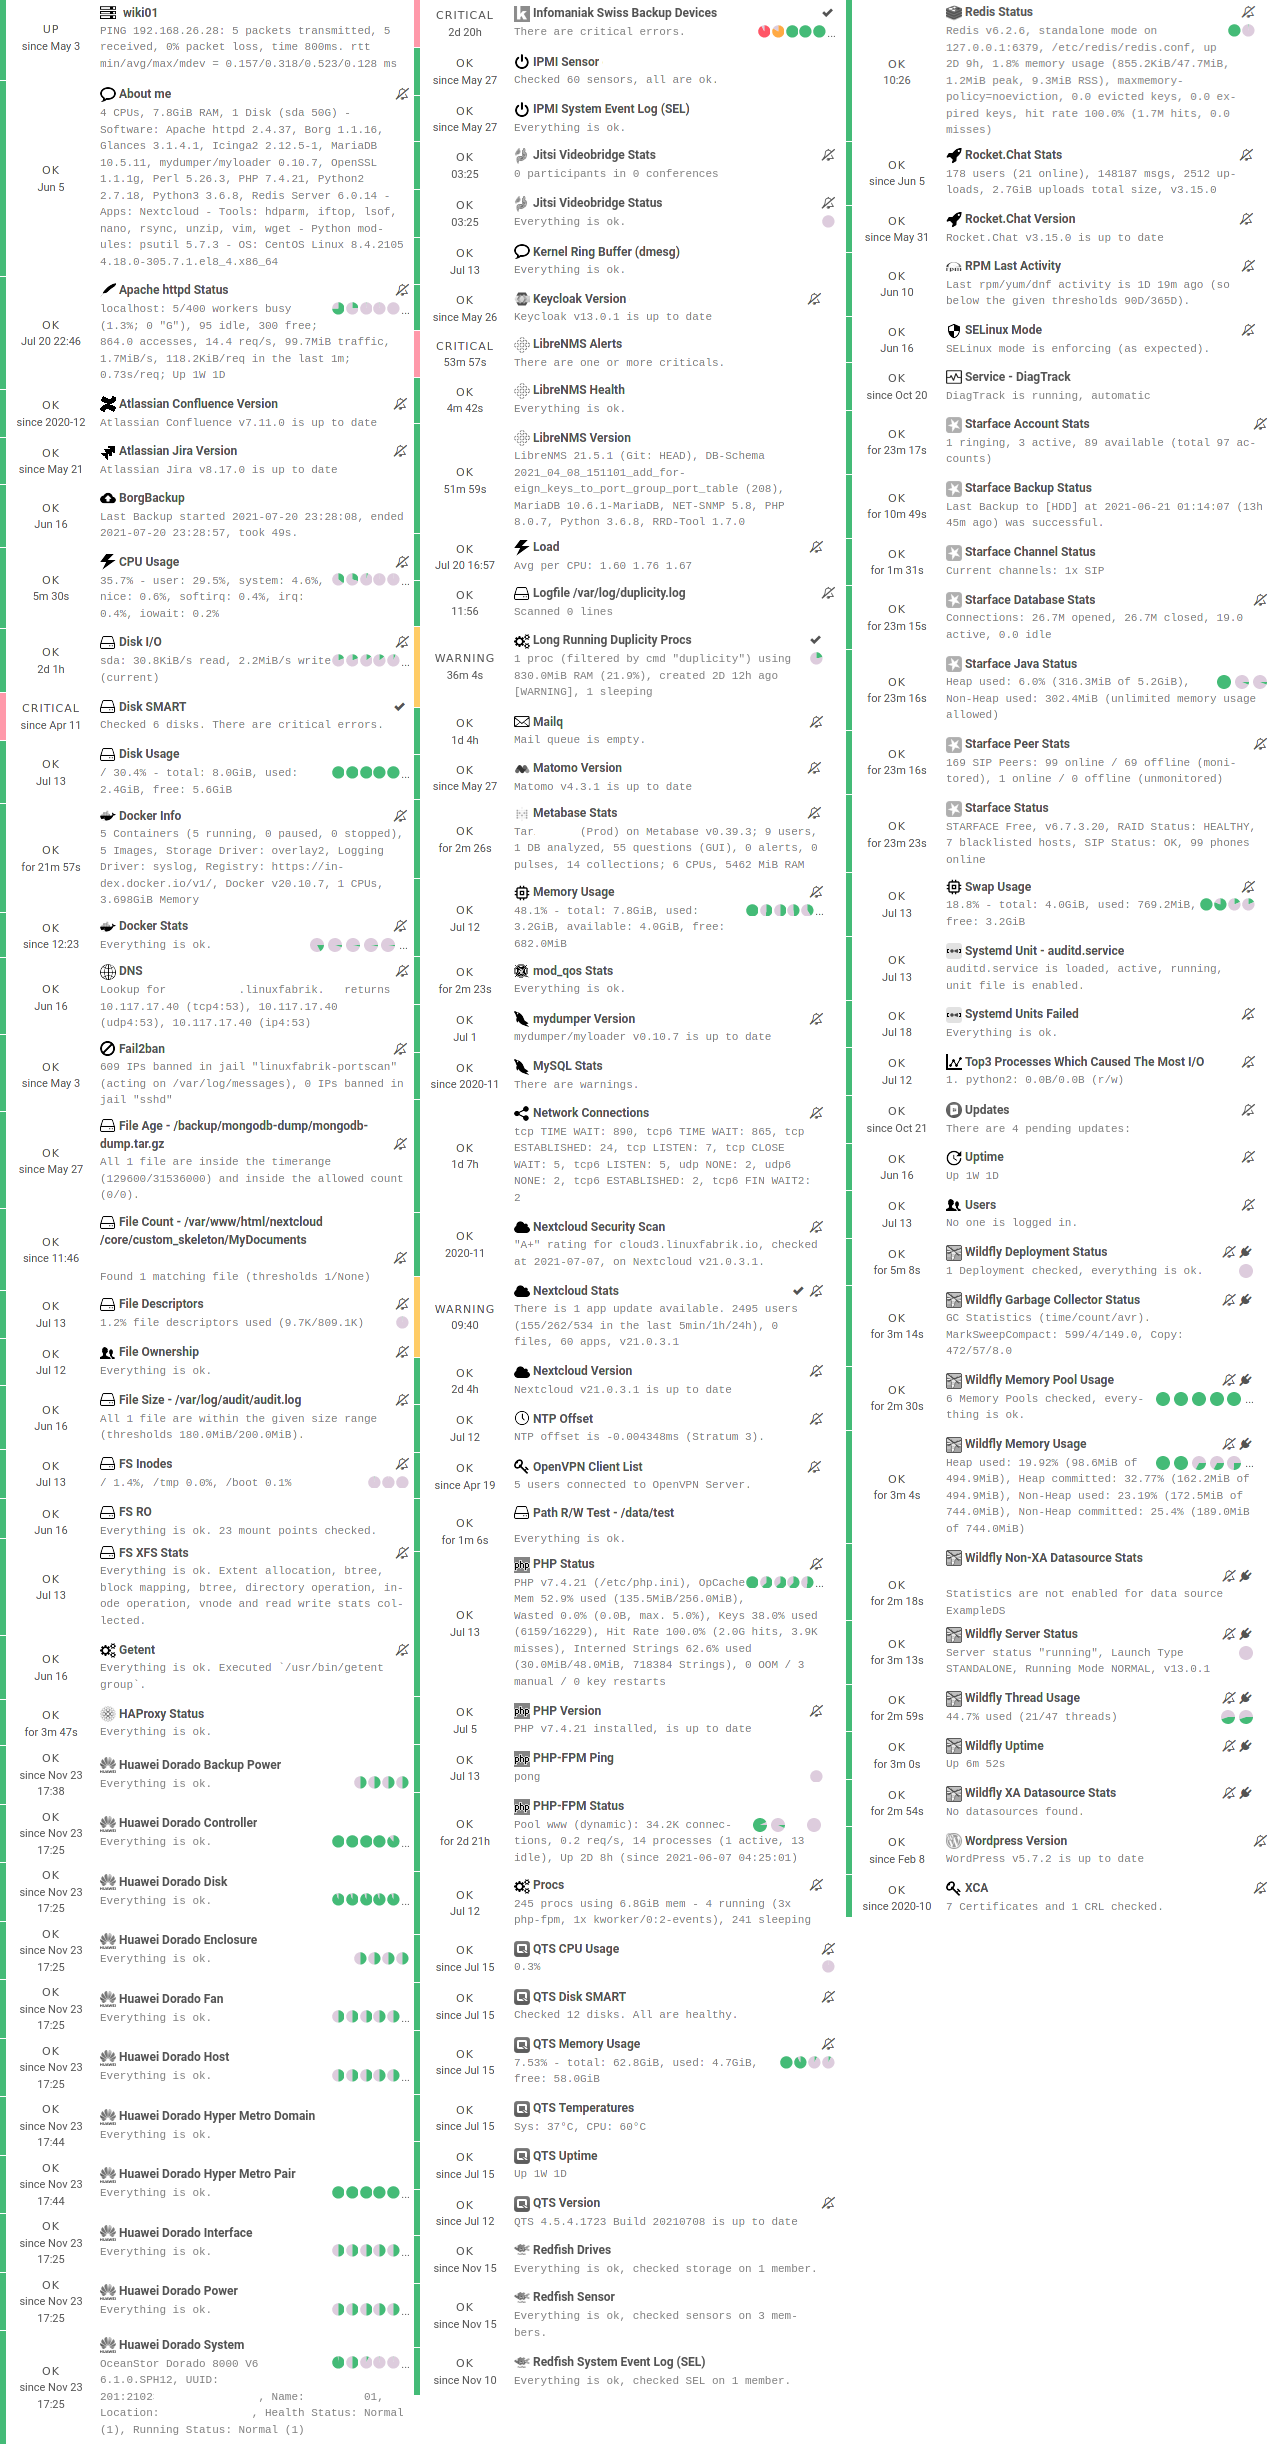
Check Plugin Poster
See most of our check plugins at a glance on an Icinga server:
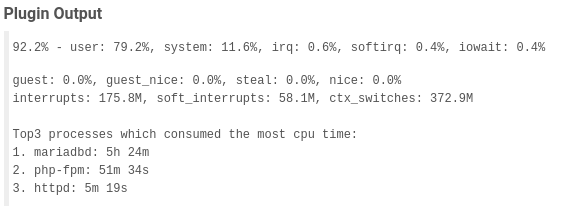
If you zoom in, for example on CPU Usage:
Feedback from our Community
A few comments about our monitoring plugins:
... many thanks for your great collection of monitoring plugins! I've just found them - clean structure and output, cross-platform, Icinga Directory Basket configurations - loving it and currently migrating step by step most of my checks to use them where possible. 😍
-- Bernd Bestel
Nachdem ich beim Versuch, Nagios-Plugins auf VMwares Photon-OS zum laufen zu kriegen, graue Haare gekriegt habe, haben mir eure Plugins zum Ziel verholfen.
-- MajorTwip
A well engineered, regularly updated and maintained collection of plugins. Specially focused on Linux servers/VMs and used at large scale by the company developing it.
-- straessler
Hello, I stumbled across your collection and am thrilled! Especially the extensive documentary and the Director Baskets are a dream.
-- Stefan Beining
In order to keep improving the Monitoring Plugins and better answer your needs, we would like to ask for your help:
- Give feedback: Tell us which check we should develop next.
Human Readable Numbers
Regarding the check plugin output, this is how we convert and append symbols to large numbers in a human-readable format (according to Wikipedia Names of large numbers, and other). The plugins display byte sizes in powers of 2 (KiB, MiB, GiB etc.).
| Value | Symbol | Origin | Type | Description |
|---|---|---|---|---|
| 1000^1 | K | Number | Thousand | |
| 1000^2 | M | SI Symbol | Number | Million ^1^, Million ^2^ |
| 1000^3 | G | SI Symbol | Number | Milliard ^1^, Billion ^2^ |
| 1000^4 | T | SI Symbol | Number | Billion ^1^, Trillion ^2^ |
| 1000^5 | P | SI Symbol | Number | Billiard ^1^, Quadrillion ^2^ |
| 1000^6 | E | SI Symbol | Number | Trillion ^1^, Quintillion ^2^ |
| 1000^7 | Z | SI Symbol | Number | Trilliard ^1^, Sextillion ^2^ |
| 1000^8 | Y | SI Symbol | Number | Quadrillion ^1^, Septillion ^2^ |
| 1024^0 | B | Bytes | Bytes | |
| 1024^1 | KiB | ISQ Symbol | Bytes | Kibibytes |
| 1024^2 | MiB | ISQ Symbol | Bytes | Mebibytes |
| 1024^3 | GiB | ISQ Symbol | Bytes | Gibibytes |
| 1024^4 | TiB | ISQ Symbol | Bytes | Tebibytes |
| 1024^5 | PiB | ISQ Symbol | Bytes | Pebibytes |
| 1024^6 | EiB | ISQ Symbol | Bytes | Exbibytes |
| 1024^7 | ZiB | ISQ Symbol | Bytes | Zebibytes |
| 1024^8 | YiB | ISQ Symbol | Bytes | Yobibytes |
| 1000^1 | KB | Bytes | Kilobytes | |
| 1000^2 | MB | Bytes | Megabytes | |
| 1000^3 | GB | Bytes | Gigabytes | |
| 1000^4 | TB | Bytes | Terrabytes | |
| 1000^5 | PB | Bytes | Petabytes | |
| 1000^6 | EB | Bytes | Exabytes | |
| 1000^7 | ZB | Bytes | Zetabytes | |
| 1000^8 | YB | Bytes | Yottabytes | |
| 1000^1 | Kbps | Bits per Second | Kilobits | |
| 1000^2 | Mbps | Bits per Second | Megabits | |
| 1000^3 | Gbps | Bits per Second | Gigabits | |
| 1000^4 | Tbps | Bits per Second | Terrabits | |
| 1000^5 | Pbps | Bits per Second | Petabits | |
| 1000^6 | Ebps | Bits per Second | Exabits | |
| 1000^7 | Zbps | Bits per Second | Zetabits | |
| 1000^8 | Ybps | Bits per Second | Yottabits | |
| 1..59 | s | Time | Seconds | |
| 60 | m | Time | Minutes | |
| 60*60 | h | Time | Hours | |
| 60*60*24 | D | Time | Days | |
| 60*60*24*7 | W | Time | Weeks | |
| 60*60*24*30 | M | Time | Months | |
| 60*60*24*365 | Y | Time | Years |
- 1: Traditional European (Peletier, long scale)
- 2: US, Canada and modern British (short scale)
Threshold and Ranges
If a check supports ranges, they can be used as follows:
- Simple value: A range from 0 up to and including the value
- A "Range" is the same as on nagios-plugins.org: ... defined as a start and end point (inclusive) on a numeric scale (possibly negative or positive infinity)., in the format
start:end - Empty value after
:: positive infinity ~: negative infinity@: if range starts with@, then alert if inside this range (including endpoints)
Examples:
| -w, -c | OK if result is | WARN/CRIT if |
|---|---|---|
| 10 | in (0..10) | not in (0..10) |
| -10 | in (-10..0) | not in (-10..0) |
| 10: | in (10..inf) | not in (10..inf) |
| : | in (0..inf) | not in (0..inf) |
| ~:10 | in (-inf..10) | not in (-inf..10) |
| 10:20 | in (10..20) | not in (10..20) |
| @10:20 | not in (10..20) | in 10..20 |
| @~:20 | not in (-inf..20) | in (-inf..20) |
| @ | not in (0..inf) | in (0..inf) |
Command, Parameters and Arguments
Shell commands like ./file-age --filename='/tmp/*' have two basic parts:
- Command name of the program to run (
./file-age). May be followed by one or more options, which adjust the behavior of the command or what it will do. - Options/Parameters normally start with one or two dashes to distinguish them from arguments (parameter
--filename, value'/tmp/*'). They adjust the behavior of the command. Parameters may be short (-w) or long (--warning). We prefer and often offer only the long version.
Many shell commands may also be followed by one or more arguments, which often indicate a target that the command should operate upon (useradd linus for example) . This does not apply to the check-plugins.
To avoid problems when passing parameter values that start with a -, the command line call must look like this:
- Long parameters:
./file-age --warning=-60:3600(use--param=valueinstead of--param value). - Short parameters:
./file-age -w-60:3600(so simply not putting any space nor escaping it in any special way).
Python 3 vs Python 2
All check plugins are available for Python 3.6+, and most of them also for Python 2.7. The Python 2 check plugins have the suffix "2" (for example cpu-usage2), the Python 3 plugins have the suffix "3" (for example cpu-usage3).
The Python 3-based check plugins use #!/usr/bin/env python3, while the Python 2-based check plugins use #!/usr/bin/env python2 explicitly.
We stopped maintaining the Python 2-based plugins on 2021-12-31.
Icinga Director
For a single Plugin
For each check, we provide an Icinga Director Basket that contains at least the Command definition and a matching Service Template (for example, check-plugins/cpu-usage/icingaweb2-module-director/cpu-usage.json). Import this via the WebGUI using Icinga Director > Configuration Baskets > Upload, select the latest entry in the Snapshots tab and restore it.
Alternatively, you can manually configure the plugin as follows.
Create a command for "cpu-usage" in Icinga Director > Commands > Commands:
- Click "+Add", choose Command type:
Plugin Check Command - Command name:
cmd-check-cpu-usage - Command:
/usr/lib64/nagios/plugins/cpu-usage - Timeout: set it according to hints in the check's README (usually
10seconds) - Click the "Add" button
Tab "Arguments":
- Run
/usr/lib64/nagios/plugins/cpu-usage --helpto get a list of all arguments. - Create those you want to be customizable:
- Argument name
--always-ok, Value type: String, Condition (set_if):$cpu_usage_always_ok$ - Argument name
--count, Value type: String, Value:$cpu_usage_count$ - Argument name
--critical, Value type: String, Value:`$cpu_usage_critical$ - Argument name
--warning, Value type: String, Value:`$cpu_usage_warning$
- Argument name
Tab "Fields":
- Label "CPU Usage: Count", Field name "cpu_usage_count", Mandatory "n"
- Label "CPU Usage: Critical", Field name "cpu_usage_critical", Mandatory "n"
- Label "CPU Usage: Warning", Field name "cpu_usage_warning", Mandatory "n"
Now use this command within a Service Template, a Service Set and/or a Single Service.
Linuxfabrik's Director Configuration
To use our Icinga Director Configuration including Host Templates, Notifcation Templates and Service Sets, you can generate a single Basket file.
If you are using our Fork of the Icinga Director, you can use the following command:
./tools/basket-joinIf not, generate a Basket without guids:
./tools/basket-join --without-guidsImport the resulting icingaweb2-module-director-basket.json via the WebGUI using Icinga Director > Configuration Baskets > Upload, select the latest entry in the Snapshots tab and restore it.
Grafana
There are two options to import the Grafana dashboards. You can either import them via the WebGUI or use provisioning.
When importing via the WebGUI simply import the plugin-name.grafana-external.json file.
If you want to use provisioning, take a look at Grafana Provisioning. Beware that you also need to provision the datasources if you want to use provisioning for the dashboards.
If you want to create a custom dashboards that contains a different selection of panels, you can do so using the tools/grafana-tool utility.
# interactive usage
./tools/grafana-tool assets/grafana/all-panels-external.json
./tools/grafana-tool assets/grafana/all-panels-provisioning.json

# for more options, see
./tools/grafana-tool --help
Reporting Issues
For now, there are two ways:
- Submit an issue (preferred).
- Contact us by email or web form and describe your problem.