Delta Live Tables is a new framework designed to enable customers to successfully declaratively define, deploy, test & upgrade data pipelines and eliminate operational burdens associated with the management of such pipelines.
This repo contains Delta Live Table examples designed to get customers started with building, deploying and running pipelines.
-
Connect your Databricks workspace using the
feature to this repo
-
Choose one of the examples and create your pipeline!

The Wikipedia clickstream sample is a great way to jump start using Delta Live Tables (DLT). It is a simple bificating pipeline that creates a table on your JSON data, cleanses the data, and then creates two tables.

This sample is available for both SQL and Python.
1. Create your pipeline using the following parameters
-
From your Databricks workspace, click Jobs and then Pipelines; click on Create Pipeline
-
Fill in the Pipeline Name, e.g.
Wikipedia -
For the Notebook Path, fill in the path of the notebook such as
/Repos/michael@databricks.com/delta-live-tables-notebooks/SQL/Wikipedia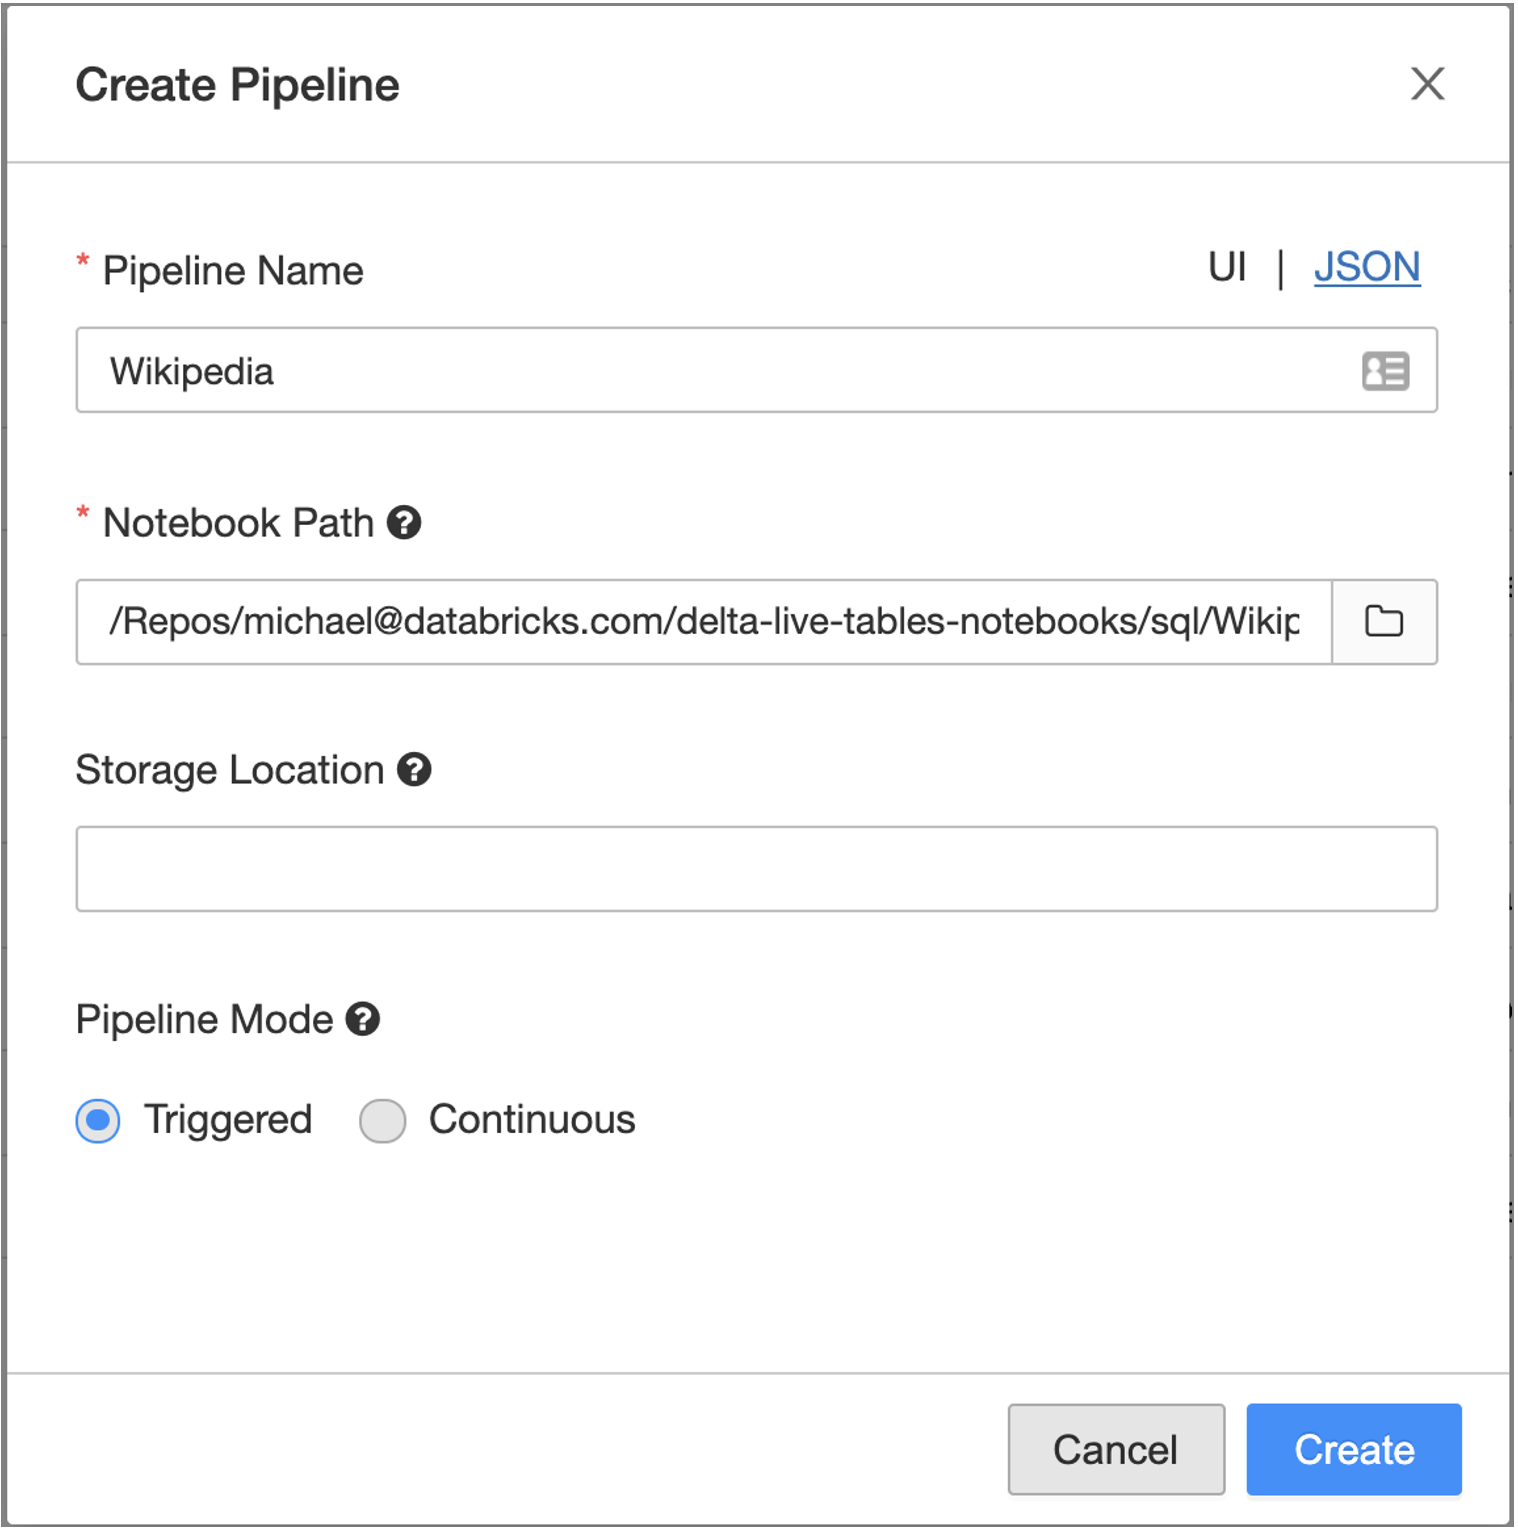

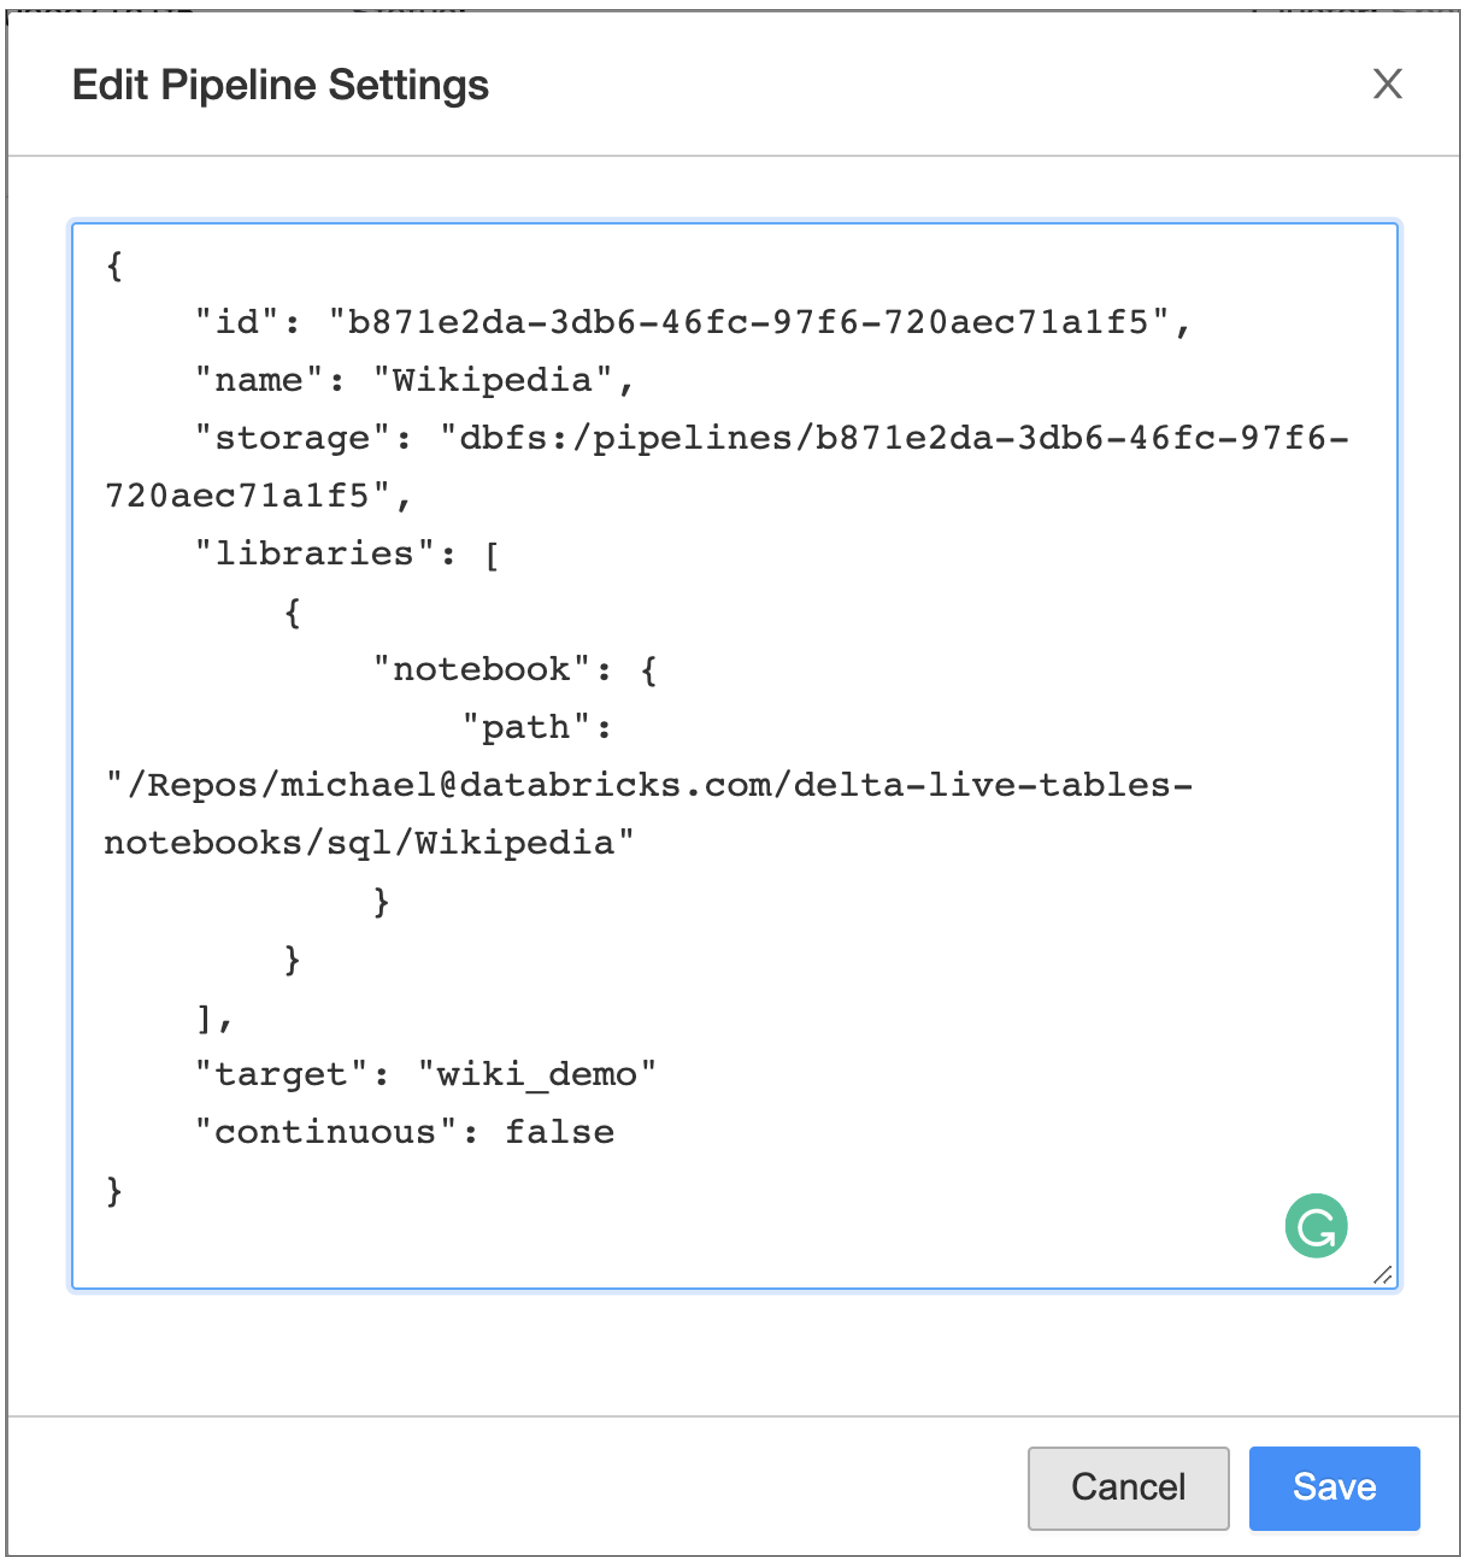
2. Edit your pipeline JSON
-
Once you have setup your pipeline, click Edit Settings near the top, the JSON will look similar to below
-
To publish your tables, add the
targetparameter to specify which database you want to persist your tables, e.g.wiki_demo.

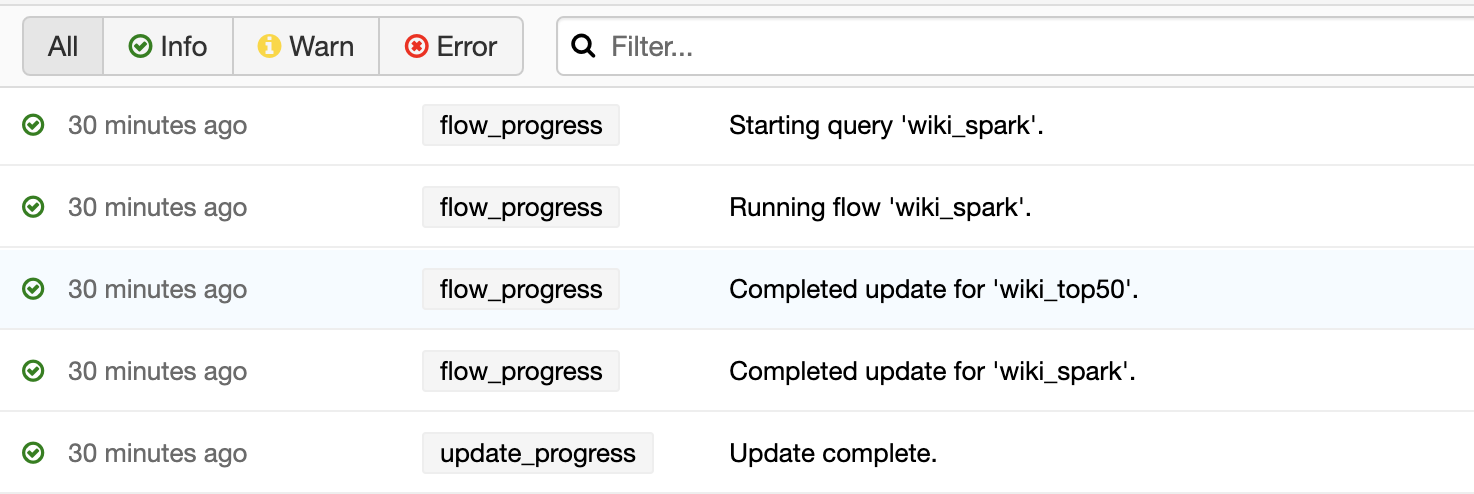
3. Click Start
-
To view the progress of your pipeline, refer to the progress flow near the bottom of the pipeline details UI as noted in the following image.
4. Reviewing the results
-
Once your pipeline has completed processing, you can review the data by opening up a new Databricks notebook and running the following SQL statements:
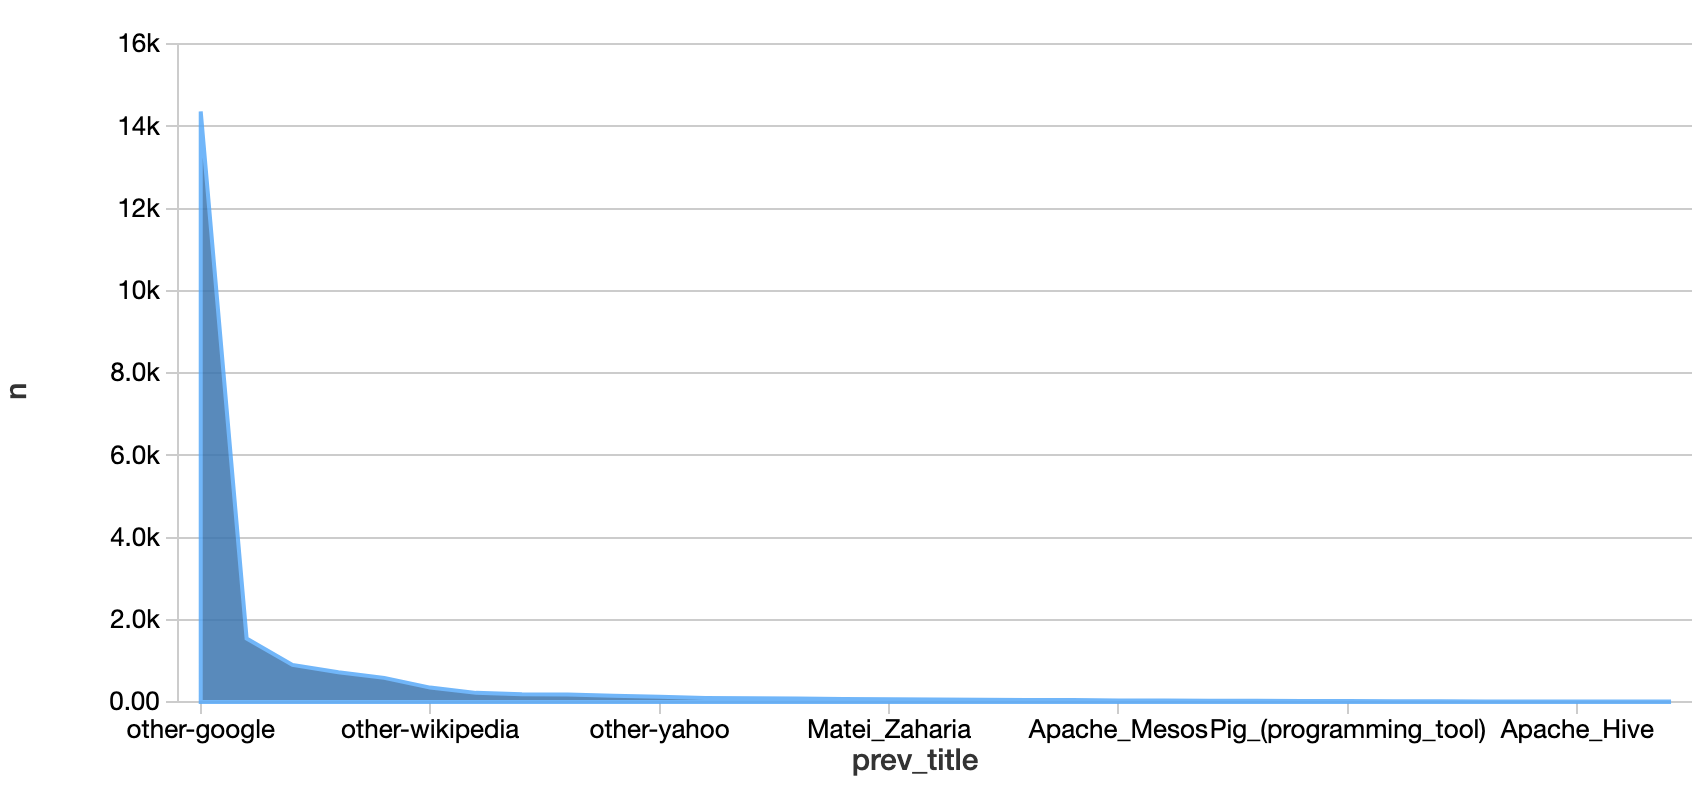
%sql -- Review the top referrers to Wikipedia's Apache Spark articles SELECT * FROM wiki_demo.wiki_spark -
Unsurprisingly, the top referrer is "Google" which you can see graphically when you convert your table into an area chart.