Javaflame
Capture all function calls including argument and return values.
No servers or open connections, just plug the agent and get the results.
See function calls, parameters and return values all at once.
Latest release v16.1.0
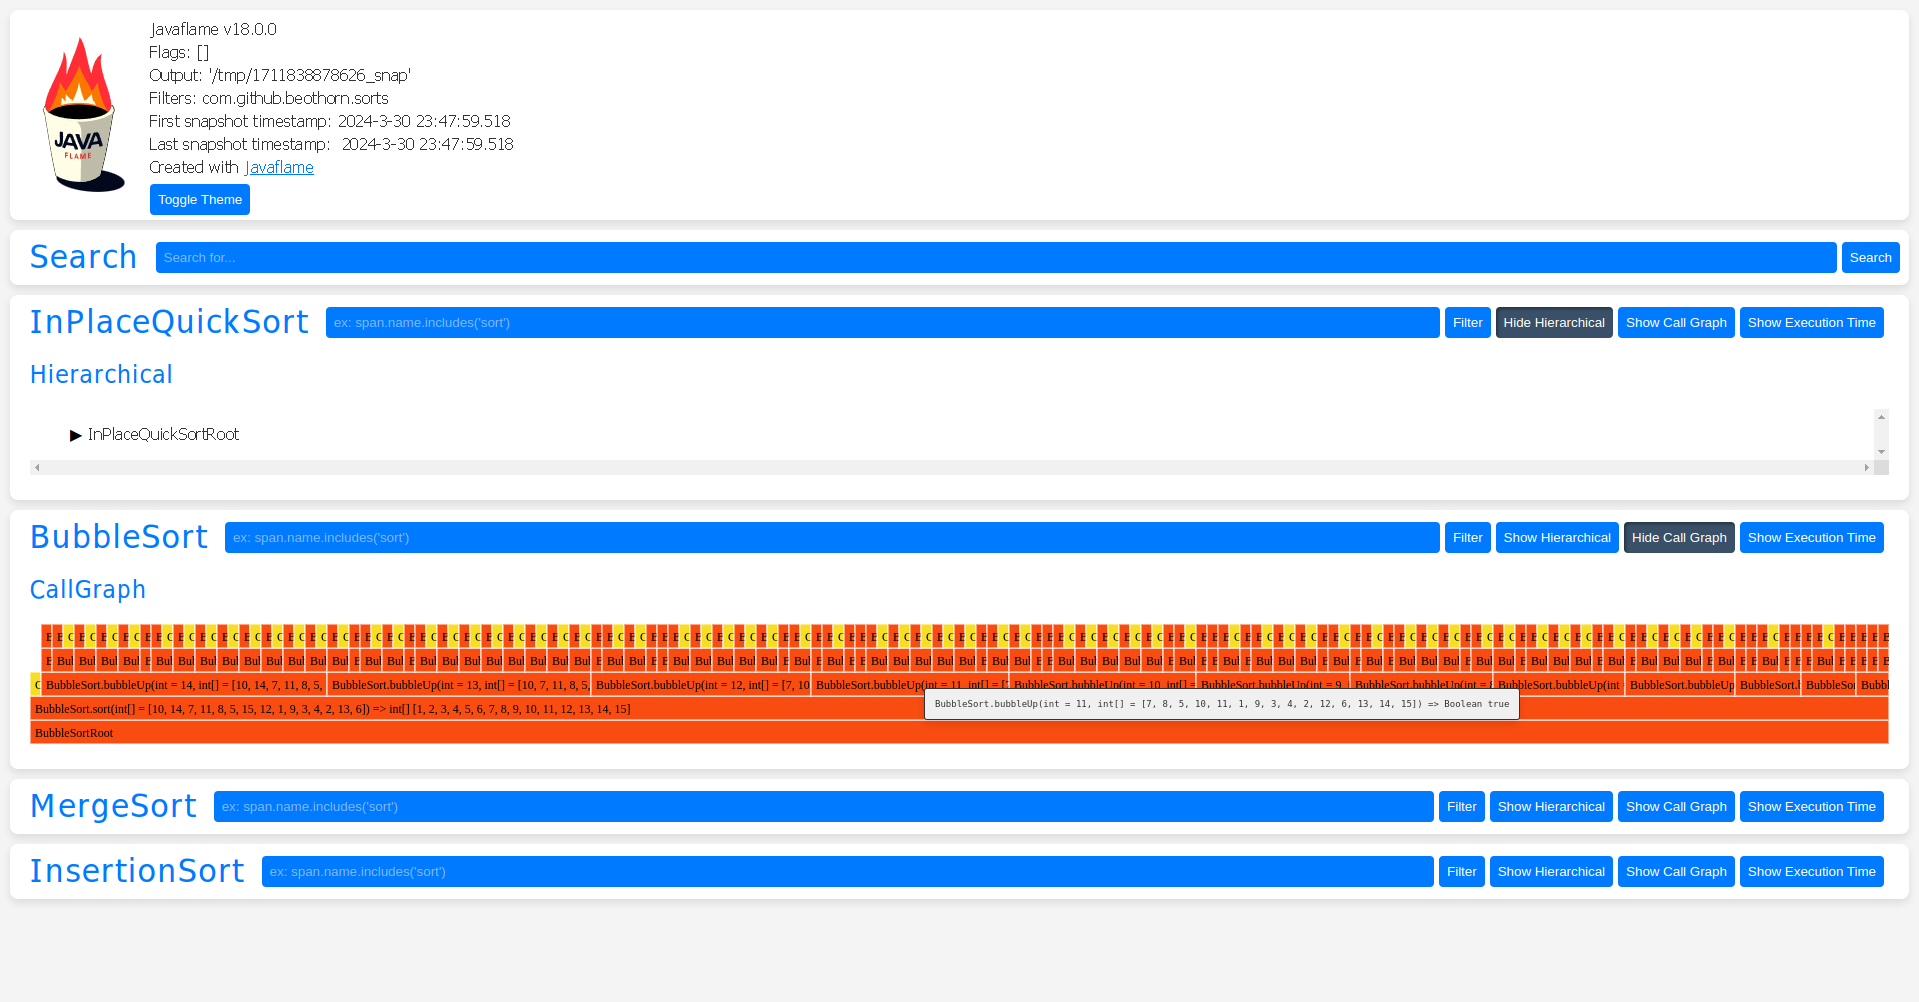
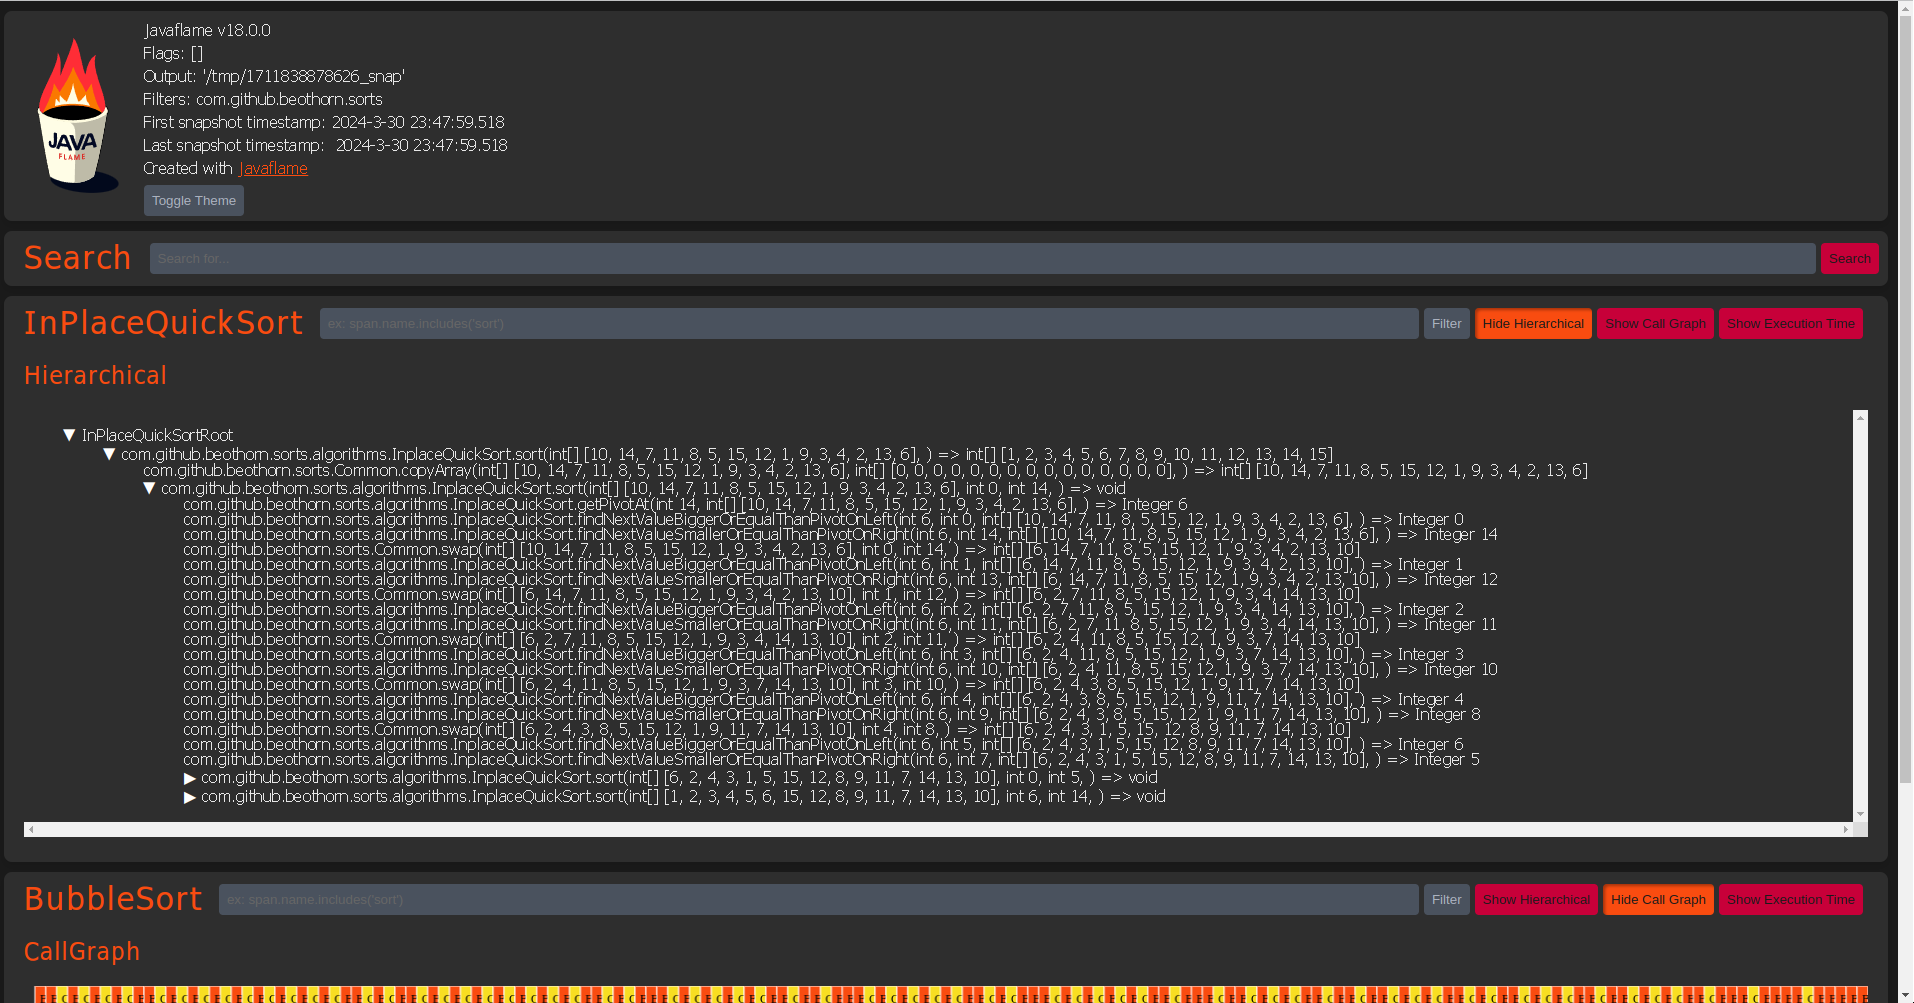
Want to see it in action? Check out this rendering of some sort algorithms flamegraphs.
Screenshots
What is this for?
This is mainly a debugging tool. The motivation behind it is to have a quick way to get a glimpse of how some logic is handled by looking at the values that are passed around between functions. It is specially nice to use together with your automated tests.
Is this a profiler?
No. A profiler, either for memory or performance, tries to have as little impact as possible on the execution of the process.
Usually, the way it works is by sampling the executon stack (either inside the JVM or the OS kernel) and using it to acess how long a call took. The stack is the very stack of the process.
That is not what javaflame does. Javaflame injects some bytecode on every function call that matches the filter on its arguments. This bytecode will store the function name on a separate stack and will use reflection to get the parameters. It will also call the toString function for each argument and store the result on the separate stack.
That means Javaflame impacts performance (because of the time it takes to process toString) and memory (because it stores the argument values).
You still can use it to have some idea about the performance, if you assume the time it takes to execute the toString and the size of the stack is negligible. This is not guaranteed to be true. If what you need is to be as precise as possible, consider other tools like async-profiler
Features
- One Flamegraph per thread.
- Value capturing, all parameters and return are captured as string.
- Filtering on instrumentation, bytecode transformation is only done on classes that match the filter.
- Exclude classes and packages.
- Continuous snapshots.
- Pure html output in a simple file and all captured data available as a JSON at data.js.
- Optional, start and stop recording whenever a method with a certain name is called
Use cases
Usually without filtering too much data is generated.
You may start by finding what class you want to understand and filter its namespace and the namespaces of the classes it calls.
So for example lets say I want to see what functions are called from the example MergeSort and the helper Class Common.java.
I can use the command:
java -javaagent:/PathTo/javaAgent.jar=filter:com.github.beothorn.sorts.Common,filter:com.github.beothorn.sorts.algorithms.MergeSort -jar ./javaExampleApp/build/libs/javaExampleApp.jar
And all calls coming from MergeSort will show up on the graph, including arguent and return values.
The nice thing is that this is not restricted to classes on your code. You can filter third party libraries.
That means if you know where some network call is done, or a GRPC or whatever else, you can build a graph listing all external calls. For example, to log postgres sql calls yoou could do:
java -javaagent:/PathTo/javaAgent.jar=filter:org.postgresql.jdbc.PgConnection:prepareStatement -jar yourapp.jar
Usage
java -javaagent:javaAgent.jar -jar yourApp.jar
or with arguments:
java -javaagent:javaAgent.jar=flags,configuration:value -jar yourApp.jar
For example, this will silently output a flame graph including function parameter values and the return.
java -javaagent:javaAgent.jar=log:NONE,out:C:/graphs -jar yourApp.jar
Anything without exclusions will generate lots of data. Either it will not render or you will need to filter it first.
Arguments
Arguments
| Flag | Description | Example |
|---|---|---|
| no_capturing_values | Record only function call, no parameter value or return value will be recorded. This is faster and measures performance more accurately. | java -javaagent:javaAgent.jar=no_capturing_values -jar yourApp.jar |
| no_constructor | Will ignore constructors | java -javaagent:javaAgent.jar=no_constructor -jar yourApp.jar |
| core_classes | Will include Java core classes. More useful in conjunction with filters to check, for example, network calls. | java -javaagent:javaAgent.jar=core_classes -jar yourApp.jar |
| no_snapshots | Dump the stack only when JVM goes down. Beware, this will use a lot of memory! You probably don't want that. | java -javaagent:javaAgent.jar=no_snapshots -jar yourApp.jar |
| qualified_functions | Print the qualified function name, ownerClass.functionName | java -javaagent:javaAgent.jar=qualified_functions -jar yourApp.jar |
| exclude:qualified.name.part:optionalMethodName | Will exclude classes which contain the qualified name on them. If method name is specified, it will only exclude that method. More than one exclude is supported by repeating the flag. | java -javaagent:javaAgent.jar=exclude:com.github.myApp,exclude:com.foo.bar -jar yourApp.jar |
| filter:qualified.name.part:optionalMethodName | Will instrument only classes that contains this string on their qualified name. If method name is specified, it will only instrument that method. You probably want to set this to you app package to avoid out of memory with huge spans. More than one filter is supported by repeating the flag. | java -javaagent:javaAgent.jar=filter:com.github.myApp,filter:com.github.other -jar yourApp.jar |
| startRecordingTriggerFunction:method | Will start recording the stack only when the function with this name is called. This checks only the method name. | java -javaagent:javaAgent.jar=startRecordingTriggerFunction:afterSetup -jar yourApp.jar |
| stopRecordingTriggerFunction:method | Will stop recording the stack when the function with this name is called. This checks only the method name. | java -javaagent:javaAgent.jar=stopRecordingTriggerFunction:afterJobIsDone -jar yourApp.jar |
| out:path | Specifies the output directory. | java -javaagent:javaAgent.jar=out:/tmp/flameOut -jar yourApp.jar |
Known issues
- May conflict with libraries that do bytecode manipulation (For example: Guice)
- Debugging will not match the source code for methods that match the filter, so turn it off when debugging on IDE.