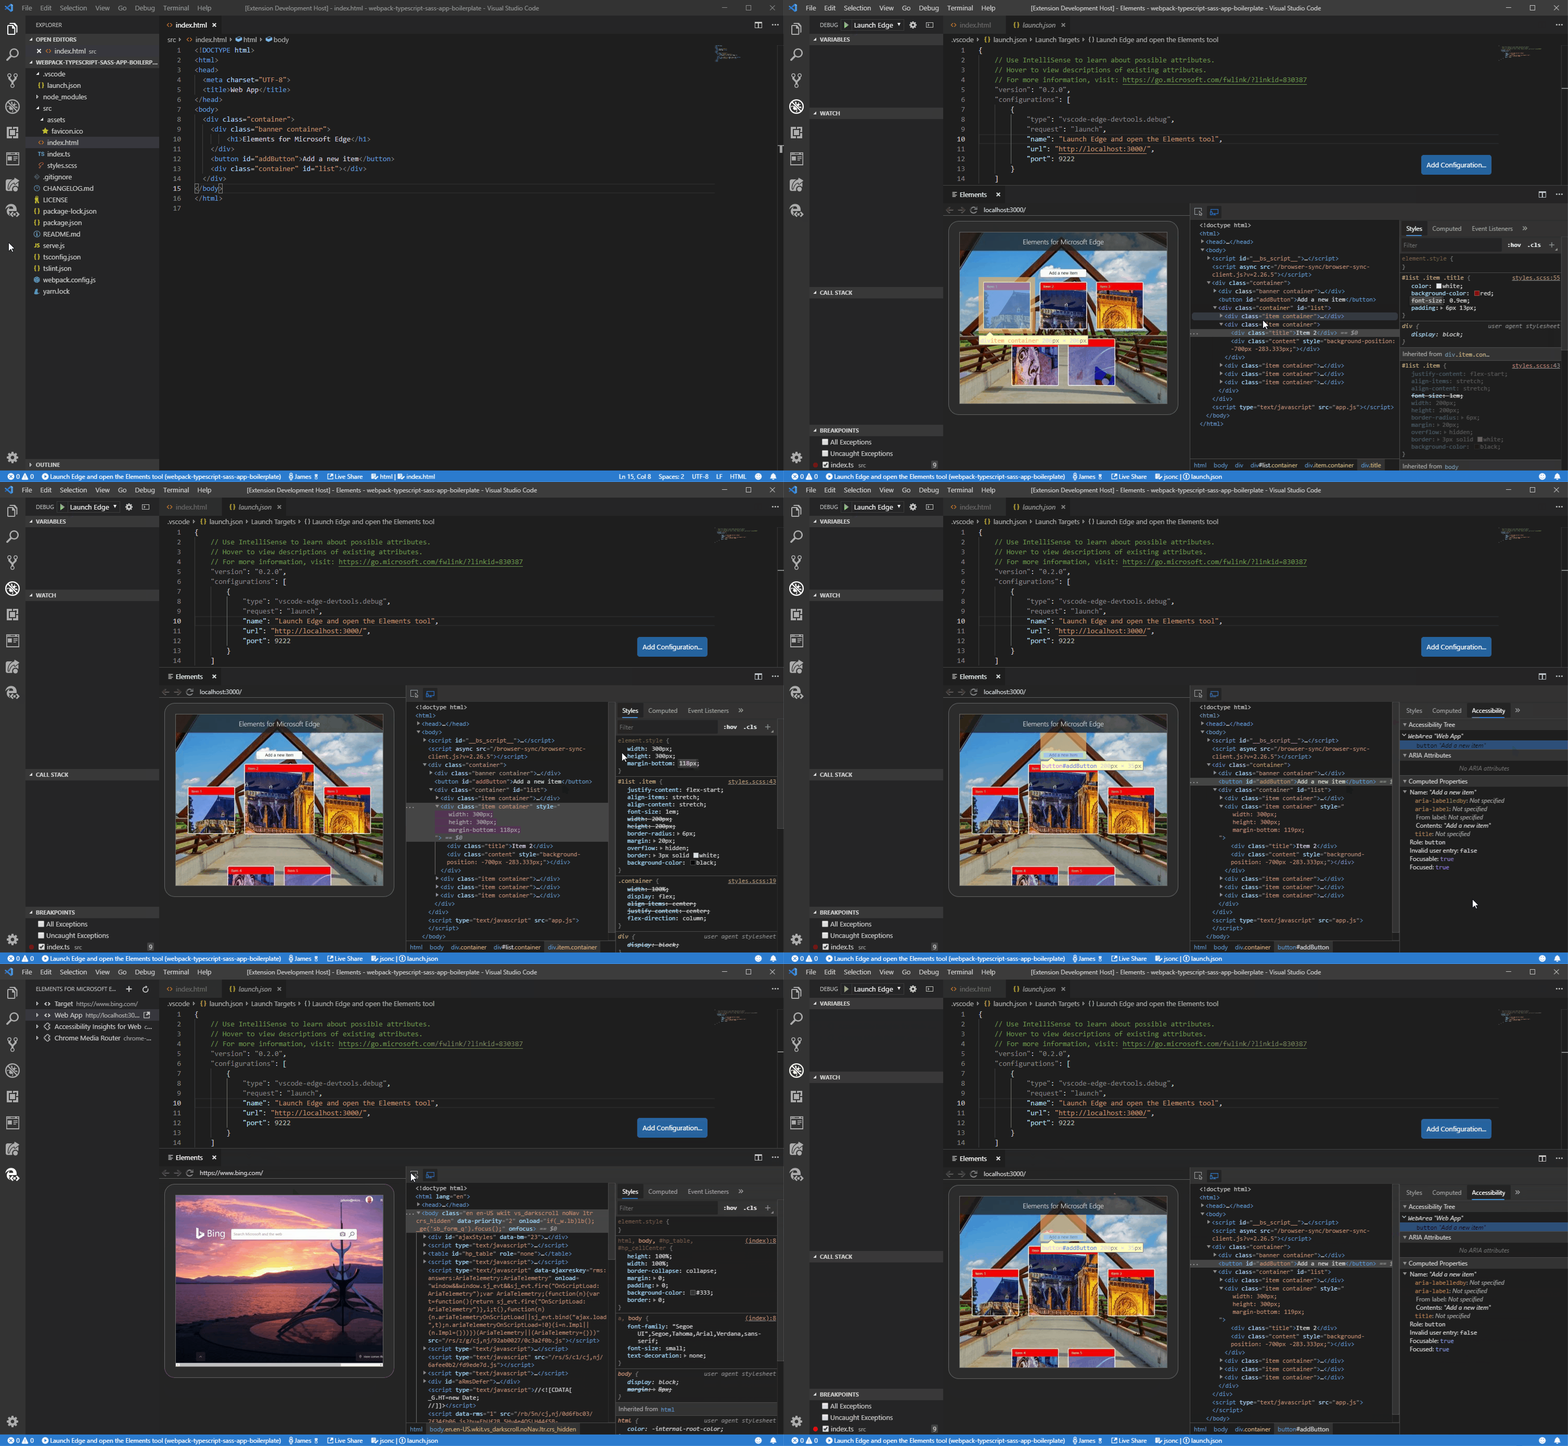
Show the browser's Elements tool inside the VSCode editor and use it to fix styling, layout, and CSS issues with your site.
A VS Code extension that allows you to use the browser's Elements tool from within the editor. The Elements tool will connect to an instance of Microsoft Edge giving you the ability to see the runtime HTML structure, alter layout, and fix styling issues. All without leaving VS Code.
Note: This extension only supports Microsoft Edge (Chromium)
Supported Features
- Debug configurations for launching Microsoft Edge browser in remote-debugging mode and auto attaching the tools,
- Side Bar view for listing all the debuggable targets, including tabs, extensions, service workers, etc.
- Fully featured Elements tool with views for HTML, CSS, accessibility and more.
- Screen-casting feature to allow you to see your page without leaving VSCode.
For use inside VS Code:
- Install any channel (Canary/Dev/etc.) of Microsoft Edge (Chromium).
- Install the extension.
- Open the folder containing the project you want to work on.
The extension operates in two modes - it can launch an instance of Microsoft Edge navigated to your app, or it can attach to a running instance of Microsoft Edge. Both modes requires you to be serving your web application from local web server, which is started from either a VS Code task or from your command-line. Using the url parameter you simply tell VS Code which URL to either open or launch in the browser.
You can launch the Elements for Microsoft Edge extension like you would a debugger, by using a launch.json config file. However, Elements for Microsoft Edge isn't a debugger and so any breakpoints set in VS Code won't be hit, you can of course use a different debug extension instead and attach the Elements for Microsoft Edge extension once debugging has started.
To add a new debug configuration, in your launch.json add a new debug config with the following parameters:
type- The name of the debugger which must bevscode-edge-devtools.debug.Required.request-launchto open a new browser tab orattachto connect to an existing tab. Required.name- A friendly name to show in the VS Code UI. Required.url- The url for the new tab or of the existing tab. Optional.file- The local file path for the new tab or of the existing tab. Optional.
{
    "version": "0.1.0",
    "configurations": [
        {
            "type": "vscode-edge-devtools.debug",
            "request": "launch",
            "name": "Launch Microsoft Edge and open the Elements tool",
            "file": "${workspaceFolder}/index.html"
        },
        {
            "type": "vscode-edge-devtools.debug",
            "request": "attach",
            "name": "Attach to Microsoft Edge and open the Elements tool",
            "url": "http://localhost:8000/"
        }
    ]
}
- Start Microsoft Edge via the side bar
- Click the
Elements for Microsoft Edgeview in the side bar. - Click the
Open a new tabicon to launch the browser (if it isn't open yet) and open a new tab.
- Click the
- Attach the Elements tool via the side bar view
- Click the
Attachicon next to the tab to open the Elements tool.
- Click the
- Start Microsoft Edge with remote-debugging enabled on port 9222:
msedge.exe --remote-debugging-port=9222- Navigate the browser to the desired URL.
- Attach the Elements tool via a command:
- Run the command
Elements for Microsoft Edge: Attach to a target - Select a target from the drop down.
- Run the command
This project welcomes contributions and suggestions. Most contributions require you to agree to a Contributor License Agreement (CLA) declaring that you have the right to, and actually do, grant us the rights to use your contribution. For details, visit https://cla.microsoft.com.
See CONTRIBUTING.md for more information.
This project collects usage data and sends it to Microsoft to help improve our products and services. Read Microsoft's privacy statement to learn more.
Security issues and bugs should be reported privately, via email, to the Microsoft Security Response Center (MSRC) at secure@microsoft.com. You should receive a response within 24 hours. If for some reason you do not, please follow up via email to ensure we received your original message. Further information, including the MSRC PGP key, can be found in the Security TechCenter.
