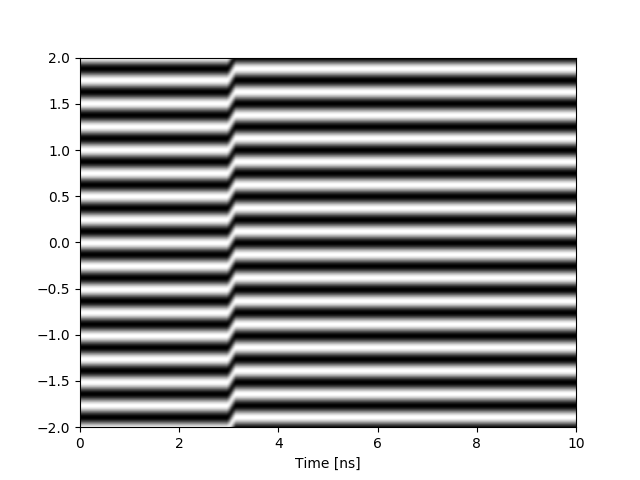
Building simulated data from a velocity profile.
target = Target(velocity_equation="step")

ray = Ray(pulse_length=10)
ray = target.reflect_off_target(ray)

etalon = Etalon(1, 1.5195)
etalon.set_VPF(2., lambda0=.532)
interferometer = Interferometer(etalon=etalon)

sweep = interferometer.output(ray, target)

plt.figure()
plt.imshow(sweep, aspect='auto', cmap="gray", extent=(0, 10, -2, 2))
plt.xlabel("Time [ns]")The target class defines the velocity profile that will be recorded by the visar system (i.e. the shock front moving / interface velocity of a target of interest).
This velocity profile is loaded during the initialization of the target instance. Two built-in profiles are available for testing.
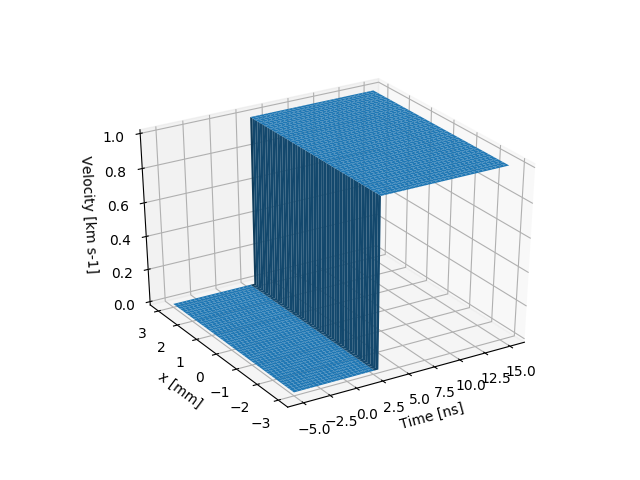
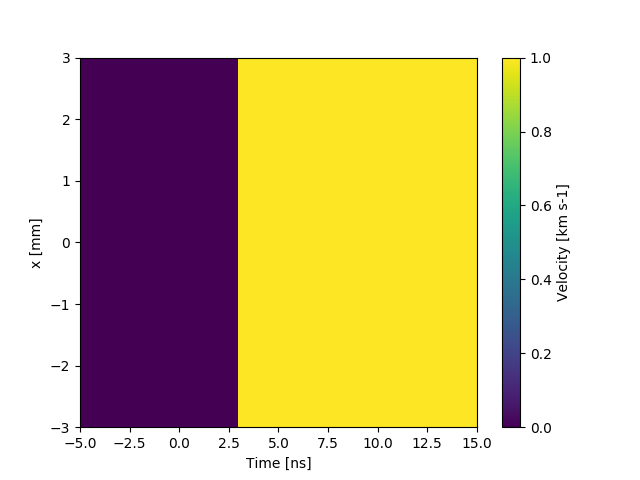
step: a discontinuous velocity jumpsigmoid: a sigmoid-shaped velocity jumpstationary: 0 velocity change, used in generating reference images
To help visualize the velocity profile, a helper plotting function is available, and can be called via the following command:
target.plot_velocity()This generates two plots: a 3D plot of the velocity profile, and a 2D color plot. The 2D should be identical to what the "Visar analysis" script would return for the velocity map, if this simulated data were to be analyzed.
User-defined velocity profiles can be loaded. An example of how this is done is demonstrated in the functions
sin_stepspatial_var_step
In this case, a callable function is defined, which must except a time value, and a spatial location. If the user defined function requires more arguments, this can be simplified with use of a lambda function. e.g.
velocity_equation = lambda t, y : sin_step(20, .5, t, y, max_velocity=1)the function is then loaded into the target during the initialization of the target instance.
target = Target(velocity_equation=velocity_equation)The ray instance defines the duration, as well as the spatial location over which the velocity profile will be recorded.
The values must be less than target._t and target._y, currently these are hard-coded into the Target.__init__, feel free to change them.
The etalon instance sets the VPF of the generated visar data, determined by twice the thickness (two passes through the etalon for a Mach-Zehnder interferometer) and the index of refraction:
etalon = Etalon(thickness=1, n=1.5195)If you would like to explicitly set the VPF instead, this can be done with the helper function set_VPF, this then chanced the etalon thickness:
etalon.set_VPF(2, labda0=.532)Similarly, this can be done with the etalon tau (temporal delay, in ns), set_tau
The interferometer instance will carry out the mechanics of generating the fringe-comb pattern.
Initilization of the interferometer instance requires 2 arguments.
Interferometer(
    etalon,
    tau,
)etalonAn Etalon instance, used in determining the VPF of the generated datatauthe slit opening on the streak camera, this sets the temporal resolution.
Generation of the desired data is then accomplished by calling the output class method.
sweep = interferometer.output(ray, target, noise=False)output excepts a Ray argument and a Target argument, and optional boolean argument to add noise to the generated data is also available; however, this method is still in development.
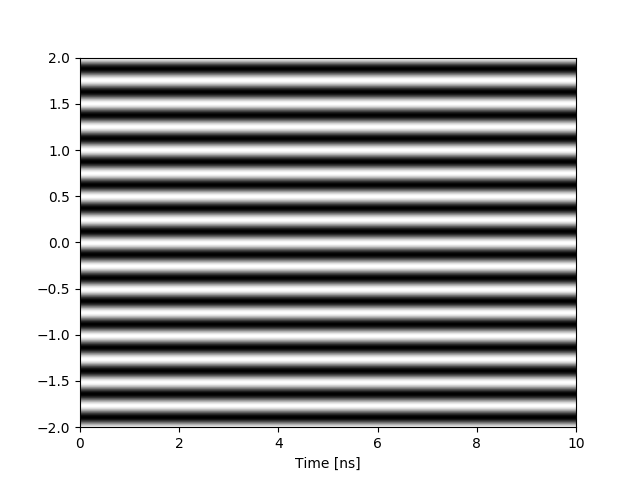
A helper function is included to quickly generate a reference shot. This just generates the output from a stationary target.
reference_shot(
    save=False,
    noise=False
)


