Update: Prometheus now natively support Eureka as a service discovery mechanism.
See: Prometheus Config for Eureka
A previous version of this project used Eureka Consul Exporter to expose Eureka metadata via Consul apis and using Consul metadata.
This was before Eureka was added as a discovery mechanism for Prometheus.
That code can still be found on the consul_adapter branch of this project.
To build use: mvn clean package
Then docker-compose up to bring up
- Prometheus (port 9090)
- Grafana (port 3000)
- Blackbox Exporter (port 9115)
- Eureka (port 8761)
- Spring Boot Demo app registered with Eureka (port 8080)
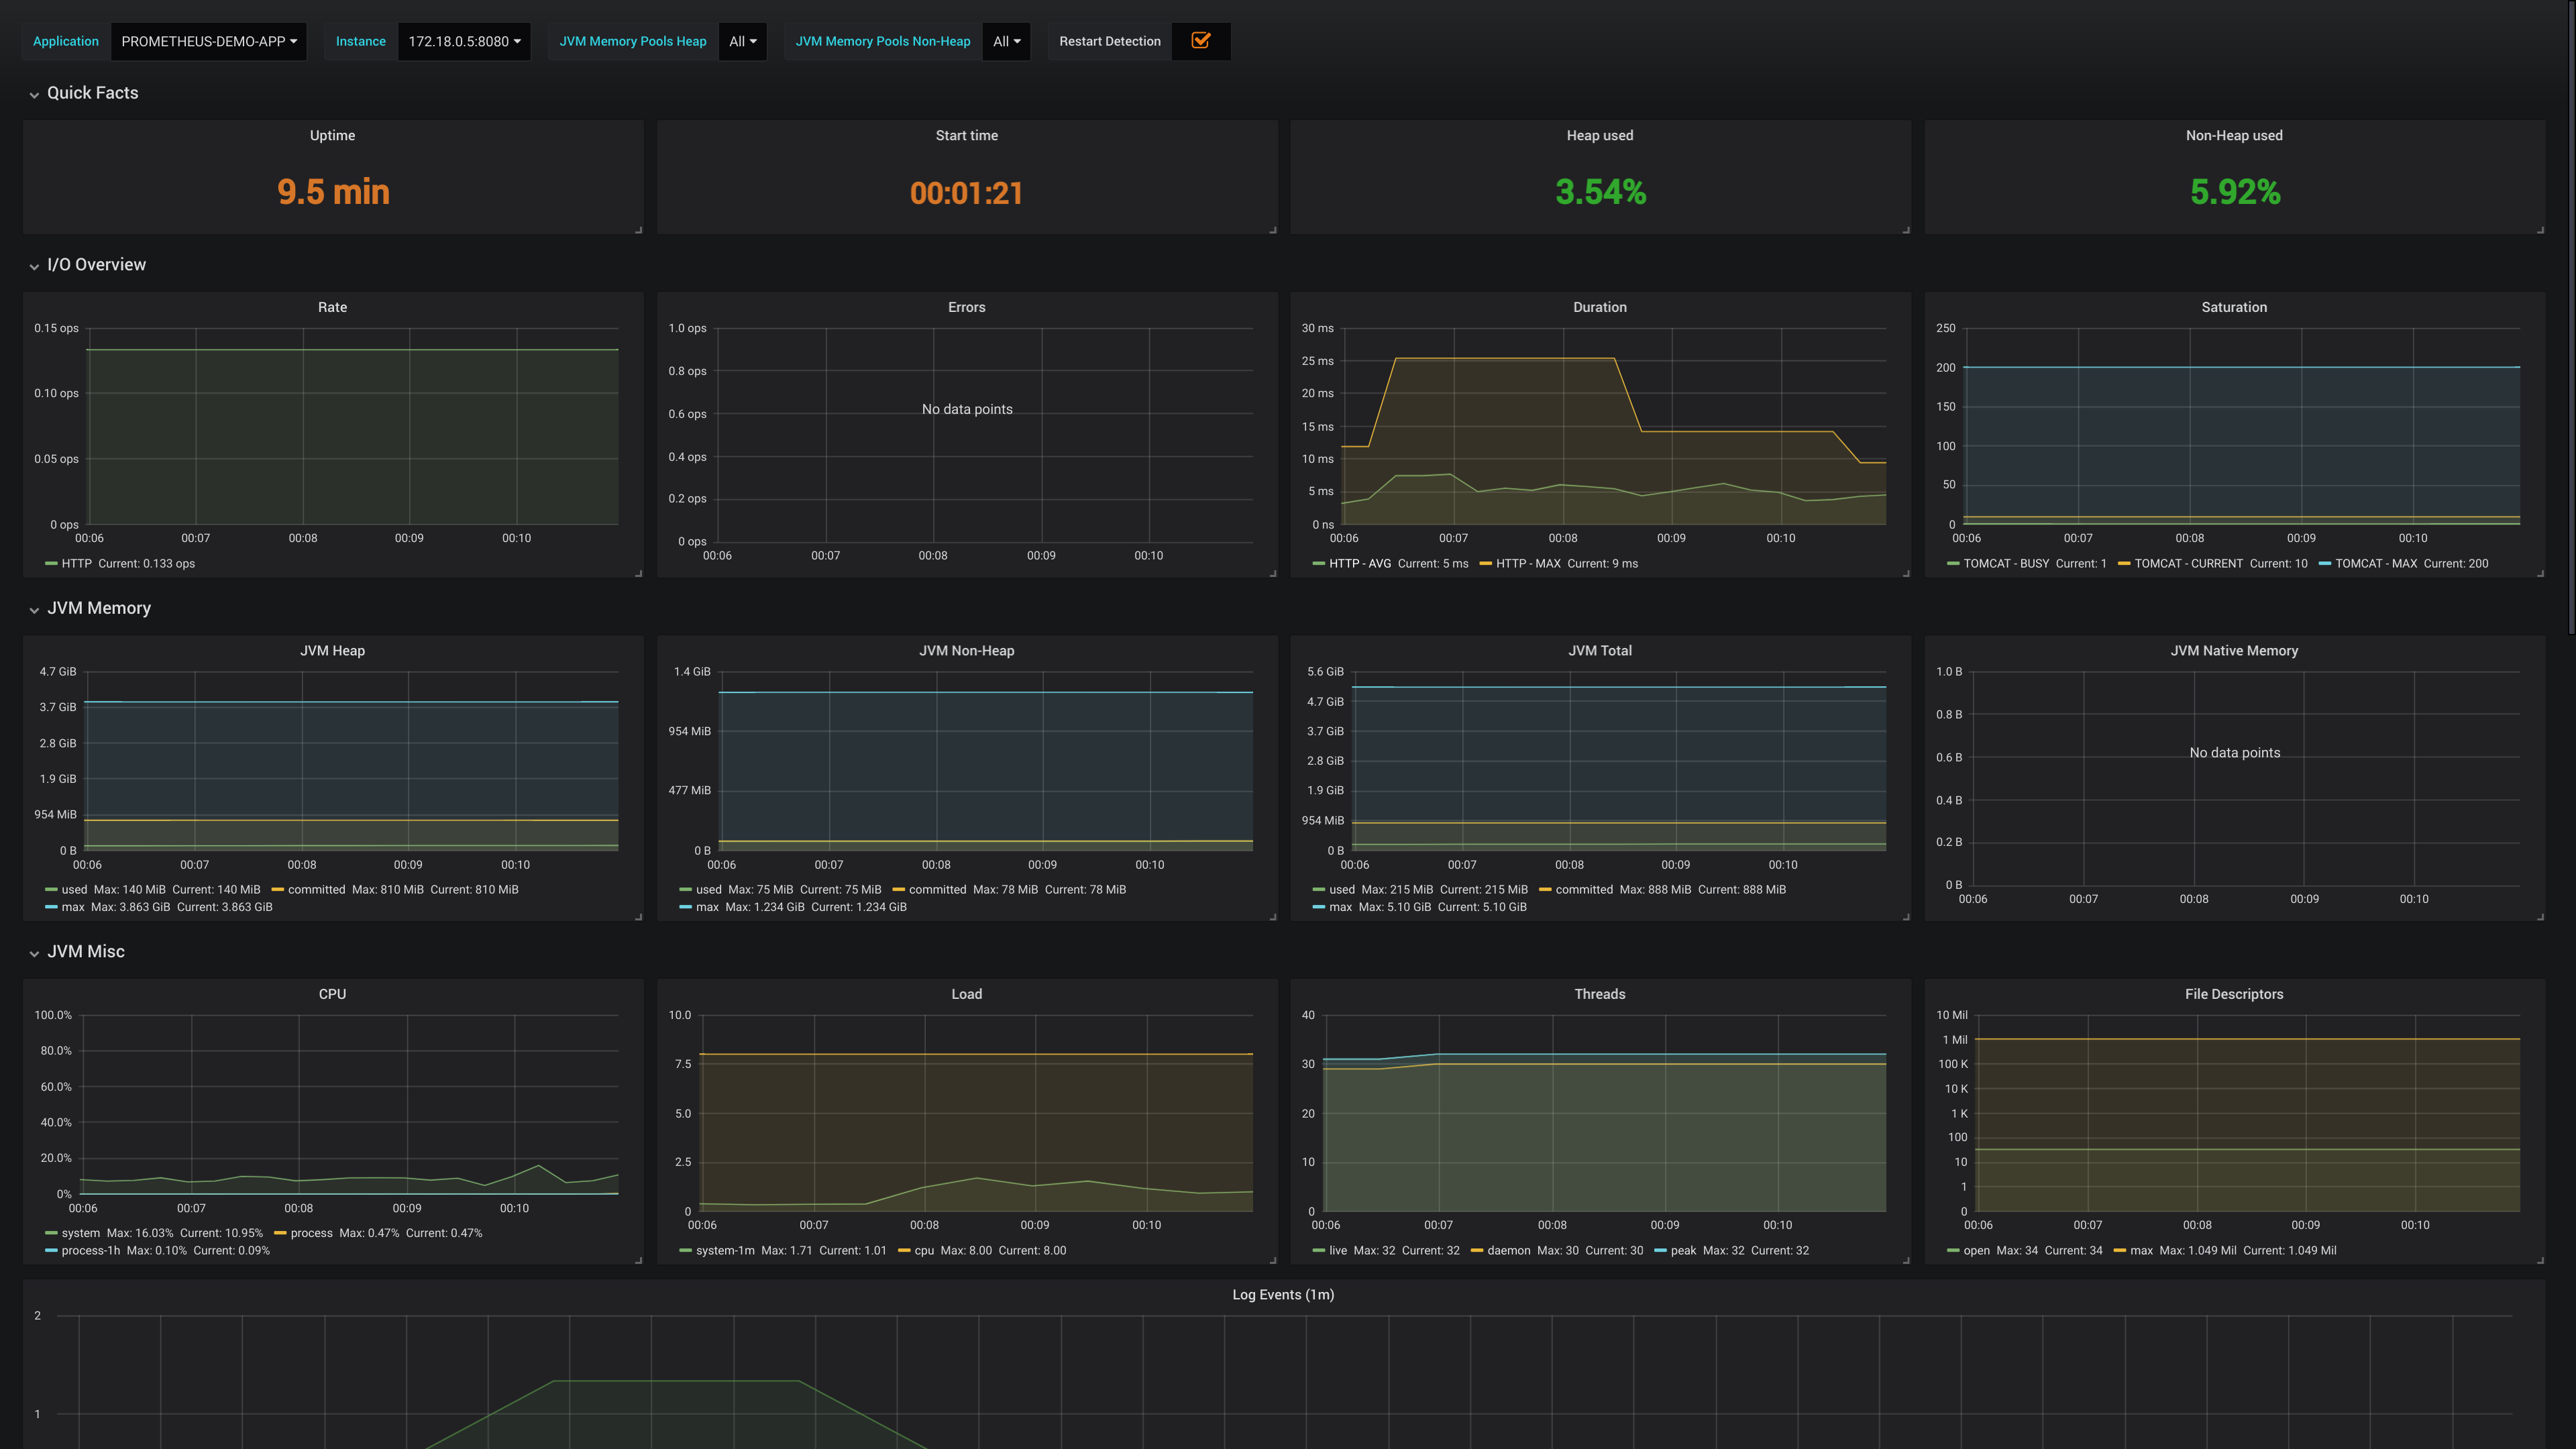
Go to Grafana Dashboard
to see a dashboard with the currently discovered applications. (allow a minute of two for some data to be collected)
(username/password is admin/admin)
Dashboard taken from https://grafana.com/dashboards/4701
The Prometheus config has two service discovery config sections. One for monitoring metrics via the application's /actuator/prometheus endpoint, the other for monitoring the application via the blackbox exporter, which pings the application's /actuator/health endpoint.
This isn't entirely necessary, but is sometimes useful to probe an application both internally (whitebox monitoring) and externally (blackbox monitoring).
