Python utilities for reading and plotting TOLNet data.
TOLNet data provides information on the vertical evolution of ozone at sites around the country. The recent API makes accessing the data easier, and this utility provides an interface for the API to connect TOLNet to xarray and pandas. This simplifies comparison of TOLNet to other datasets.
To Install: python -m pip install --user git+https://github.com/barronh/pytolnet.git
Documentation:
https://barronh.github.io/pytolnet
Example:
import pytolnet

api = pytolnet.TOLNetAPI()

# Find newest data from UAH
cldf = api.data_calendar('UAH')
newest_data_id = cldf.index.values[0]

# Retrieve data
ds = api.to_dataset(newest_data_id)

# Print statistics (including coordinates)
print(ds.to_dataframe().reset_index().describe())
#                                 time      altitude  derived_ozone
# count                         174096  174096.00000   63538.000000
# mean   2023-08-16 19:17:36.874643968       7.72500      48.525455
# min              2023-08-16 13:06:59       0.30000       0.015444
# 25%              2023-08-16 16:10:39       4.01250      40.799999
# 50%              2023-08-16 19:18:37       7.72500      47.500000
# 75%              2023-08-16 22:24:22      11.43750      55.299999
# max              2023-08-17 01:31:57      15.15000     100.000000
# std                              NaN       4.29549      13.209246

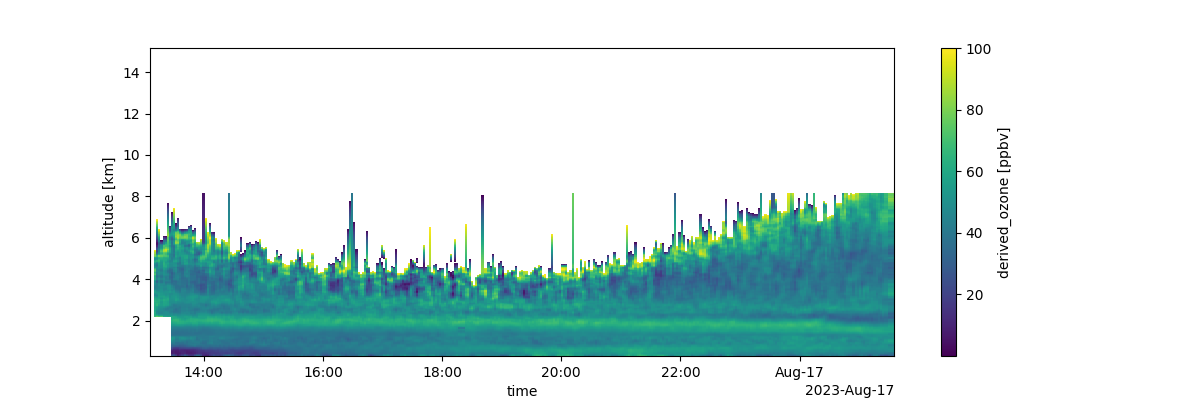
# Make a curtain plot
qm = ds['derived_ozone'].T.plot(figsize=(12, 4))
qm.figure.savefig('pytolnet.png')
