Multispecies Stratified Survey Optimization for Gulf of Alaska Groundfishes
This repository is provides the code used for an In Prep NOAA Technical Memorandum manuscript by Zack Oyafuso, Lewis Barnett, Margaret Siple, and Stan Kotwicki temporarily entitled "The expected performance and feasibility of a Gulf of Alaska groundfish bottom trawl survey optimized for abundance estimation."
Requirements
A handful of R packages are required. Some conventional ones:
library(sp)
library(raster)
library(RColorBrewer)
The bulk of the optimization is done within the SamplingStrata R Package (https://github.com/barcaroli/SamplingStrata). There is one function in the package, BuildStrataDF() that I modify for this analysis, so it is best to use a forked version of the package that I modified:
library(devtools)
devtools::install_github(repo = "zoyafuso-NOAA/SamplingStrata")
library(SamplingStrata)
Species Included
The species set included in the manuscript are a complex of Gulf of Alaska cods, flatfishes, and rockfishes. Some species are included in the survey optimizations (Optimized = T) while others are excluded but are still included when simulating surveys (Optimized = F).
| Scientific Name | Common Name | Optimized |
|---|---|---|
| Atheresthes stomias | arrowtooth flounder | T |
| Gadus chalcogrammus | Alaska or walleye pollock | T |
| Gadus macrocephalus | Pacific cod | T |
| Glyptocephalus zachirus | rex sole | T |
| Hippoglossoides elassodon | flathead sole | T |
| Hippoglossus stenolepis | Pacific halibut | T |
| Lepidopsetta bilineata | southern rock sole | T |
| Lepidopsetta polyxystra | northern rock sole | T |
| Microstomus pacificus | Pacific Dover sole | T |
| Sebastes alutus | Pacific ocean perch | T |
| Sebastes melanostictus/aleutianus | blackspotted and rougheye rockfishes* | T |
| Sebastes brevispinis | yellowfin sole | T |
| Sebastes polyspinis | northern rockfish | T |
| Sebastes variabilis | dusky rockfish | T |
| Sebastolobus alascanus | shortspine thornyhead | T |
| Anoplopoma fimbria | sablefish | F |
| Beringraja spp. | skates spp. | F |
| Enteroctopus dofleini | giant octopus | F |
| Pleurogrammus monopterygius | Atka mackerel | F |
| Sebastes borealis | shortraker rockfish | F |
| Sebastes variegatus | harlequin rockfish | F |
| Squalus suckleyi | spiny dogfish | F |
*Due to identification issues between two rockfishes these two species were combined into a species group we will refer as "Sebastes B_R" (blackspotted rockfish and rougheye rockfish, respectively) hereafter.
Input Data -- Spatial Domain
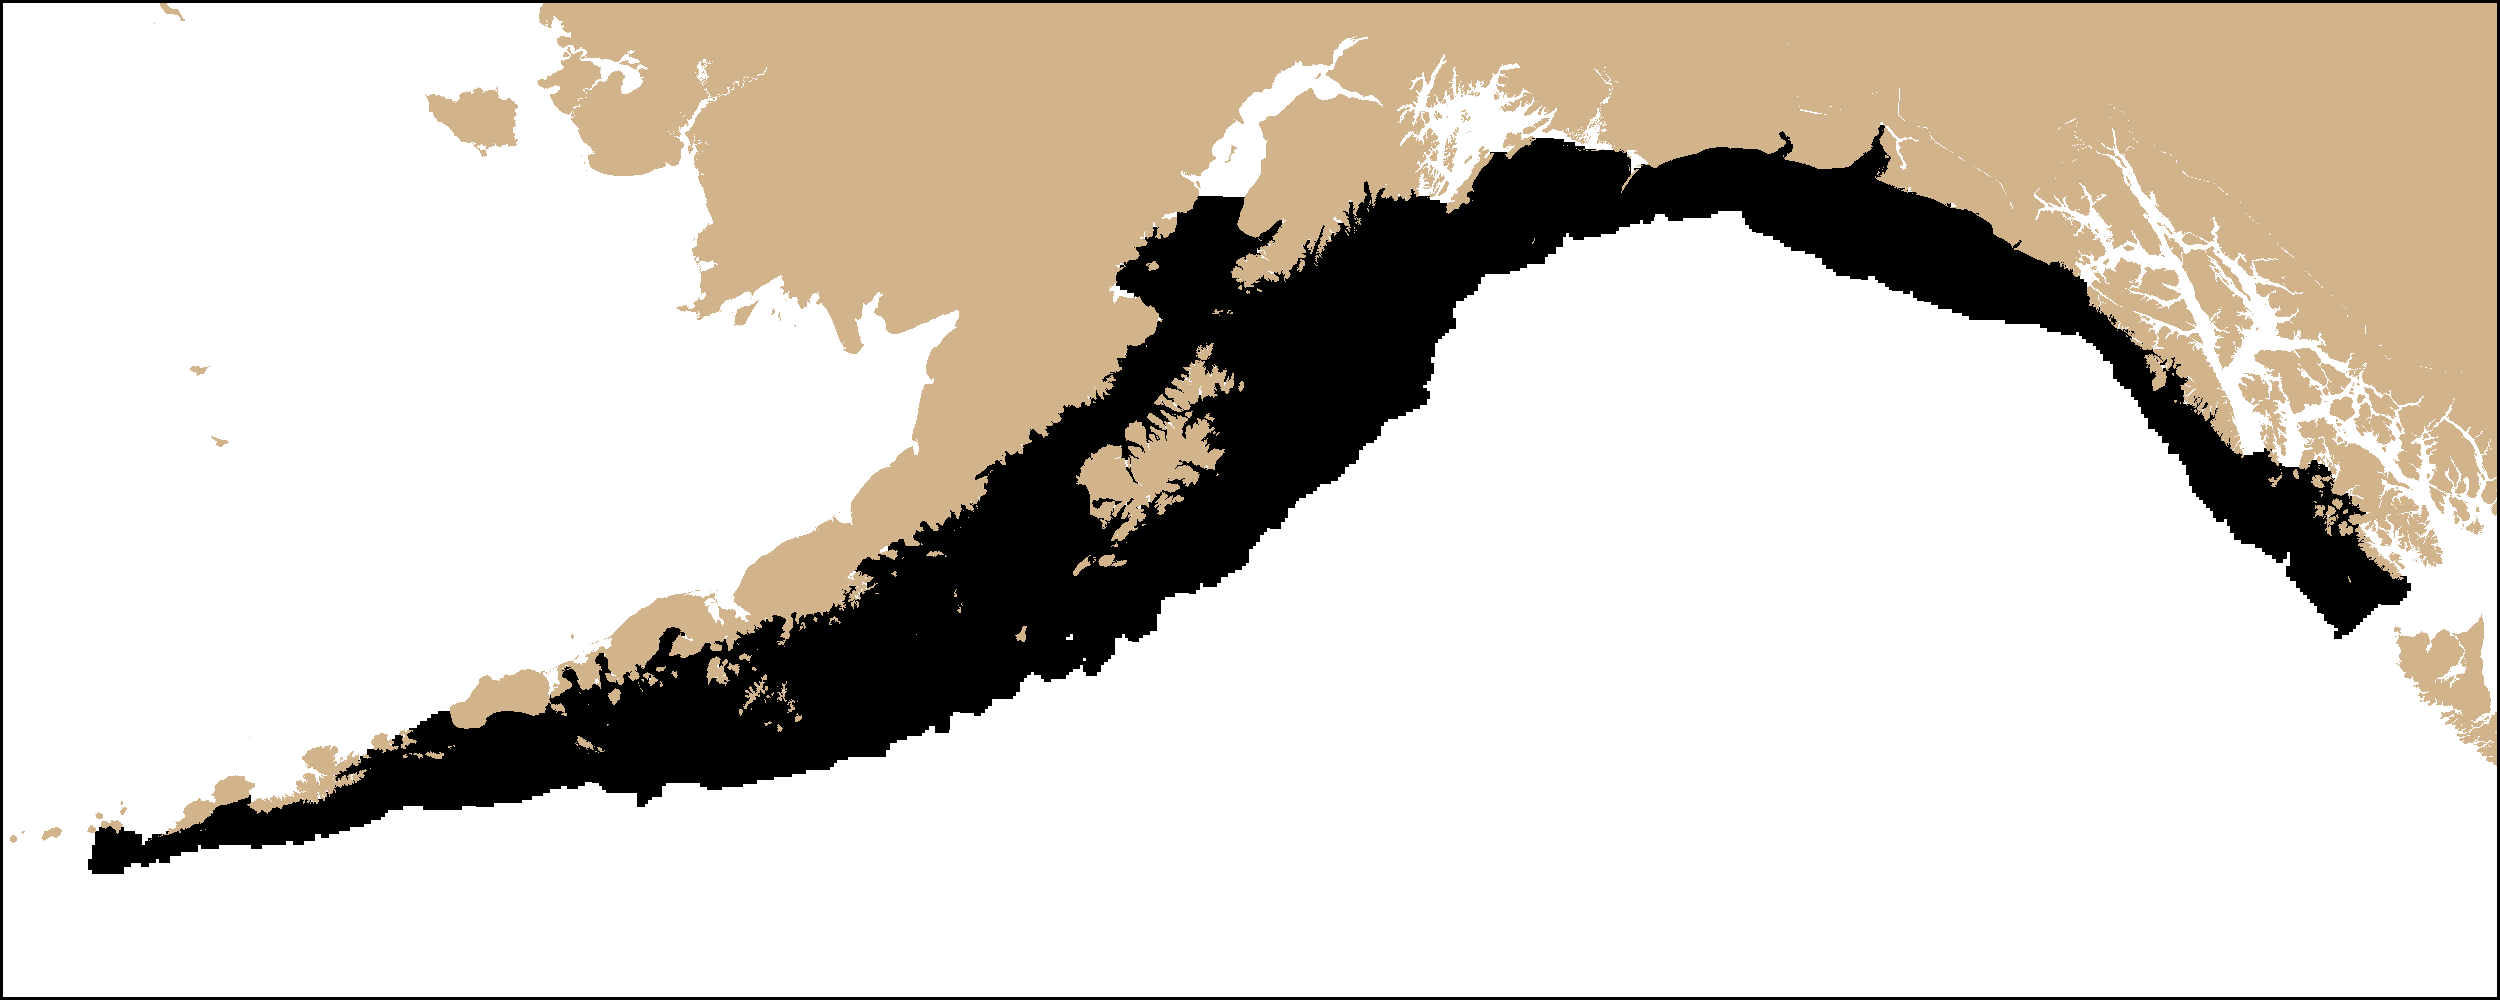
The spatial domain of the survey optimization is the Gulf of Alaska
divided into a roughly 5 km resolution grid resulting in n_cells = 22832 total
survey cells. The script used to create the survey grid is contained in the MS_OM_GoA
repo. That script produces an RData product called
Extrapolation_depths.RData that is contained within the data/
directory in this repo. Extrapolation_depths.RData contains a variable
called Extrapolation_depths which is a dataframe of N rows. Useful fields for
this analysis are stated in the table below:
| Field Name | Description |
|---|---|
| Area_km2 | num, Area of grid cell in square kilometers |
| Lon | num, Longitude |
| Lat | num, Latitude |
| Depth_EFH | num, Depth in meters |
| E_km | num, Eastings in kilometers, 5N UTM |
| N_km | num, Northings in kilometers, 5N UTM |
| stratum | int, Stratum ID in current STRS design |
Input Data -- Predicted denisity
Density of each species was predicted across the spatiotemporal domain using a
vector autoregressive spatiotemporal model using the VAST package
(https://github.com/James-Thorson-NOAA/VAST). Gulf of Alaska bottom-trawl
catch-per-unit area survey data were used from years 1996, 1999, and the odd
years from 2003-2019. Code in the repository zoyafuso-NOAA/MS_OM_GoA/
(https://github.com/zoyafuso-NOAA/MS_OM_GoA) was used to run the VAST models
and the output was saved in this repo (data/fit_density.RData). This .RData
file contains a variable called "D_gct" which is a 3-D array of dimension
(n_cells, ns_all, 24). There are 24 total years (1996-2019), but only
n_years = 11 survey years.
Script Overview (Optimal_Allocation_GoA/analysis_scripts/)
The survey optimization framework is modularized into separate scripts. These are the scripts used below and the sections following are the order in which the optimization is conducted. As of now, there are no high-level wrapper functions that may ease wider general use.
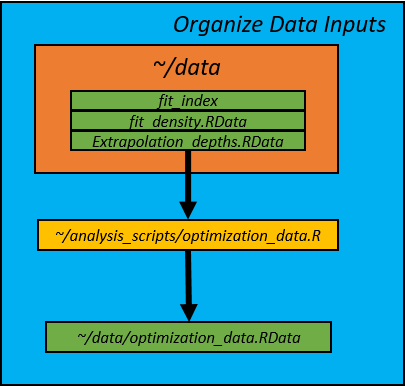
optimization_data.R : Synthesizes data inputs and constants common to all subsequent scripts.
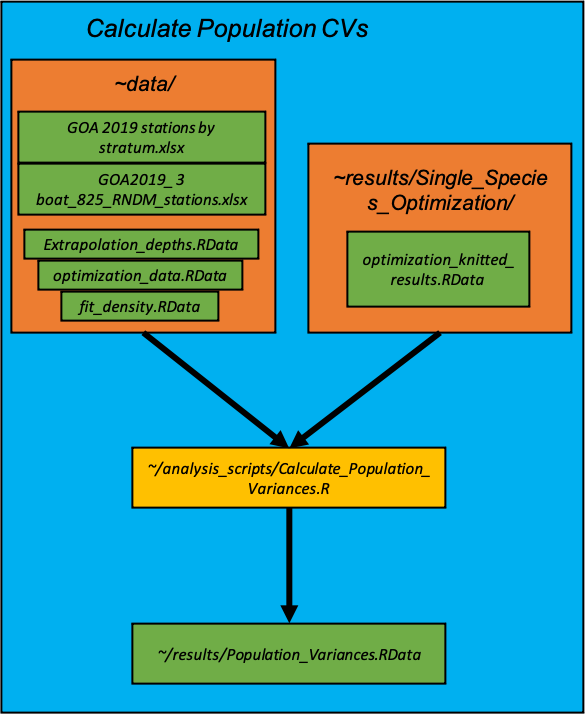
Calculate_Population_Variances.R : Calculates population variances of simple random, optimized single-species stratified random, and current stratified random surveys.
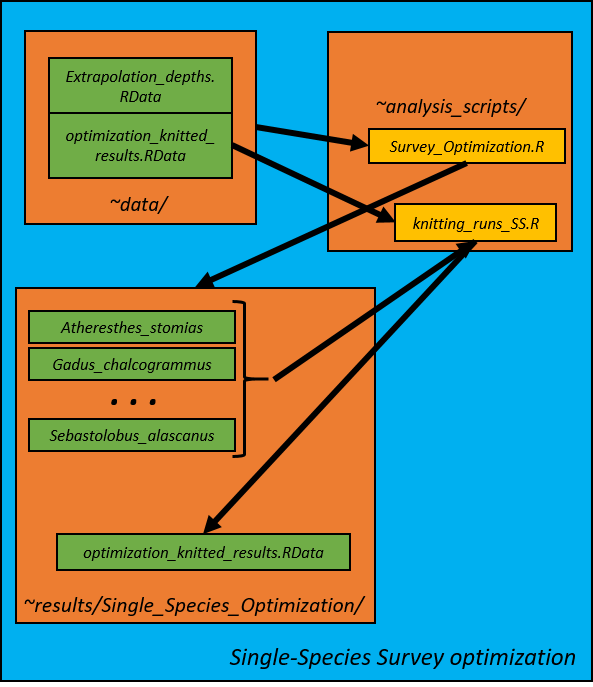
Survey_Optimization.R : Conducts the multi- and single-species survey optimization.
knitting_runs.R : knits all the optimization runs into neat result outputs.
knitting_runs_SS.R : knits all the single-species optimization runs into neat result outputs.
Simulate_Surveys.R : Simulates current and optimized stratified random surveys.
1. Input Data and constants (optimization_data.R)
Data for the optimization were synthesized in the optimization_data.R script.
It's purpose is to take the VAST model density predictions and create an input
dataset in the form that is used in the SamplingStrata package. The depth and
E_km fields are used as strata variables. The script creates an .RData file
called optimization_data.RData is saved in the data/
directory. Many of the constants used throughout the subsequent scripts are
also assigned here. The output of this script is an RData file called
optimization_data.RData
and contains the following variables and constants:
| Variable Name | Description | Class Type and Dimensions |
|---|---|---|
ns_opt |
Number of species included in optimization | numeric vector, length 1 |
ns_eval |
Number of species excluded in optimization | numeric vector, length 1 |
ns_all |
sum of ns_opt and ns_eval |
numeric vector, length 1 |
sci_names_opt |
Scientific names of species included in optimization | character vector, length ns_opt |
sci_names_eval |
Scientific names of species excluded in optimization | character vector, length ns_eval |
sci_names_all |
Scientific names of all species considered | character vector, length ns_all |
common_names_opt |
Common names of species included in optimization | character vector, length ns_opt |
common_names_eval |
Common names of species excluded in optimization | character vector, length ns_eval |
common_names_all |
Common names of all species considered | character vector, length ns_all |
spp_idx_opt |
indices of the order of species included in optimization | numeric vector, length ns_opt |
spp_idx_eval |
indices of the order of species excluded in optimization | numeric vector, length ns_eval |
n_boats |
Total number of sample sizes of interest, (n_boats = 3) |
numeric vector, length 1 |
samples |
Range of sample sizes of interest, corresponding to 1 (n = 280), 2 (n = 550), and 3 (n = 820) boats | numeric vector, length n_boats |
n_strata |
Total number of strata scenarios, (n_strata = 6) |
numeric vector, length 1 |
stratas |
Range of number of strata, (stratas <- c(5, 10, 15, 20, 30, 60)) |
numeric vector, length n_strata |
n_cells |
Total number of grid cells in the spatial domain, (n_cells = 23339 cells) |
numeric vector, length 1 |
n_years |
Total number of years with data, (n_years = 11 years between 1996-2019) |
numeric vector, length 1 |
year_set |
Sequence of years over the temporal domain (1996 - 2019) | numeric vector, length 24 |
years_included |
Indices of years with data | numeric vector, length n_years |
n_dom |
Total number of management districts, (n_dom = 5) |
numeric vector, length 1 |
n_iters |
Total number of times a survey is simulated, (n_iters = 1000) |
numeric vector, length 1 |
true_mean |
True mean densities for each species and year. This is the "truth" that is used in the performance metrics when simulating surveys | numeric matrix, ns_all rows, n_years columns |
true_index |
True abundance index for each species and year. This is the "truth" that is used in the performance metrics when simulating surveys | numeric matrix, ns_all rows, n_years columns |
true_index_district |
True abundance index for each species and year for each management district. This is the "truth" that is used in the performance metrics when simulating surveys | numeric array, dimensions: ns_all, n_years, n_dom |
frame_all and frame_district are the main data input used in the
gulf-wide and district-level optimizations, respectively. Both dataframes had
n_cells rows with useful fields:
| Field Name | Description |
|---|---|
| domain | management district id (1, 2, ..., 5 for frame_district or 1 for frame_all) |
| id | unique ID for each sampling cell |
| X1 | strata variable 1: longitude in eastings (km). Because the optimization does not read in negative values, the values so that the lowest value is 0 |
| X2 | strata variable 2: depth of cell (m) |
| WEIGHT | number of observed years |
| Y1, Y2, ... | density for a given cell summed across observed years for each species |
| Y1_SQ_SUM, Y2_SQ_SUM | density-squared for a given cell, summed across observed years for each species |
2. Survey Optimization--Single Species Optimizations (Survey_Optimization_SS.R)
Gulf-wide and district-level single-species optimizations are first conducted. Ten strata are used for the gulf-wide optimization and five strata per distict are used for the district-level optimization. Optimized single-species CVs are used as the lower limit for the subsequent multispecies survey optimizations, so we need to conduct these single-species analyses first. Optimizations were conducted for at boat effort level (../boat1, ../boat2, ../boat3). Each run of the optimization is saved in its own directory with the code template of StrXRunY where X is the number of strata in the solution and Y is the run number. Within each run folder contains:
| File Name | Description |
|---|---|
| output/plotdom1.png | Genetic algorithm results |
| output/outstrata.txt | Stratum-level means and variances for each species |
| solution.png | Low-quality snapshot of the solution mapped onto the spatial domain |
| result_list.RData | Result workspace of the optimization |
The result_list.RData workspace contains a named list called result_list,
which consists of the elements:
| Variable Name | Description | Class Type and Dimensions |
|---|---|---|
result_list$solution$indices |
Solution indexed by strata, contained in the X1 column | dataframe, n_cells rows and 2 columns |
result_list$solution$aggr_strata |
Stratum-level means and variances for each species | dataframe, variable number of rows, 37 columns |
result_list$solution$frame_new |
Original data, along with the solution in the STRATO column. | dataframe, n_cells rows and 21 columns |
result_list$sum_stats |
Characteristics of the optimized strata, e.g., allocated sampling, population size, strata variable characteristics | dataframe, variable number of rows, 9 columns |
result_list$CV_constraints |
Expected CV across species | numeric vector, length ns_opt |
result_list$n |
Optimized total sample size | numeric, length 1 |
3. Knit Single-Species Optimization Results (knitting_runs_SS.R)
The results from each run are synthesized in the knitting_runs_SS.R script. Four variables are saved in the gulf-wide optimization_knitted_results.RData workspace:
| Variable Name | Description | Class Type and Dimensions |
|---|---|---|
settings_agg_full_domain |
Optimized population CV for each species and number of boat scenario (sample sizes are approximate to the expected 280, 550, or 820 stations) | dataframe, ns_all*n_boats rows, 5 columns |
res_df_full_domain |
Solutions for each run | dataframe, n_cells rows, ns_all*n_boats columns |
strata_list_full_domain |
Collection of result_list$solution$aggr_strata from each run |
list of length ns_all*n_boats |
strata_stats_list_full_domain |
Collection of stratum-level means and variances across species for each run | list of length ns_all*n_boats |
Five variables are saved in the district-level optimization_knitted_results.RData workspace:
| Variable Name | Description | Class Type and Dimensions |
|---|---|---|
settings_district |
Optimized population CV for each species and number of boat scenario calculated by district (sample sizes are approximate to the expected 280, 550, or 820 stations) | dataframe, ns_all*n_boats rows, 8 columns |
settings_agg_district |
Optimized population CV for each species and number of boat scenario calculated on the full domain (sample sizes are approximate to the expected 280, 550, or 820 stations) | dataframe, ns_all*n_boats rows, 5 columns |
res_df_district |
Solutions for each run | dataframe, n_cells rows, ns_all*n_boats columns |
strata_list_district |
Collection of result_list$solution$aggr_strata from each run |
list of length ns_all*n_boats |
strata_stats_list_district |
Collection of stratum-level means and variances across species for each run | list of length ns_all*n_boats |
4. Survey Optimization--Multi-Species Optimizations (Survey_Optimization.R)
Multispecies optimizations are conducted with 10, 15, and 20 strata for the gulf-wide optimization and 3, 5, and 10 strata per district for the district- level optimizations. Optimizations were conducted for at boat effort level (../boat1, ../boat2, ../boat3). Each run of the optimization is saved in its own directory with the code template of StrXRunY where X is the number of strata in the solution and Y is the run number. Within each run folder contains:
5. Knit Multispecies Optimization Results (knitting_runs.R)
The results from each run are synthesized in the knitting_runs_SS.R script. Four variables are saved in the optimization_knitted_results.RData workspace:
Survey Simulation and Performance Metrics (work in progress)...
Graphic Workflow
Calculate population variances of different survey types
After the single-species optimizations are conducted, we calculate the population variances under different survey designs under the three boat scenarios: 1) simple random sampling, 2) stratified random sampling using the current strata and effort allocations and 3) stratified random sampling using the stratification and effort allocation from the optimized single-species survey optimizations from the previous section.


