Grafana's Agent for device monitoring, packaged as a balenaBlock per architecture (aarch64, amd64, armv7hf).
Getting Started
There are two parts to getting started: setting up the server integration at Grafana Cloud, and configuring the agent for your fleet.
First, create a free account at Grafana Cloud. Note the team name is used in the URL for your Grafana account, like https://grafana.com/orgs/{team}, and in the URL for your cloud dashboards, like https://{team}.grafana.net .
After registering, install the Linux Server integration (instructions) for your cloud, which will create pre-configured dashboards. On the setup page, don't install the agent. Instead, at the bottom of the page, select Install in the section Install Dashboards and Alerts (screenshot). Then you can view your dashboards although they are not receiving data yet.
Next, create a fleet for your devices in the balenaCloud dashboard. Set fleet variables for the Prometheus username, password, and remote write URL using the values from your Grafana Cloud Prometheus service page (screenshot). The service page is available from your Grafana account site (grafana.com/orgs/{team}), not the cloud dashboard.
| Variable | Prometheus service page reference |
|---|---|
| PROMETHEUS_URL | Remote Write Endpoint |
| PROMETHEUS_USER | Username / Instance ID |
| PROMETHEUS_PASSWORD | An API key you must create |
Finally, create a grafana-agent service entry in your docker-compose that references the block, like this example, and push that service composition to your fleet.
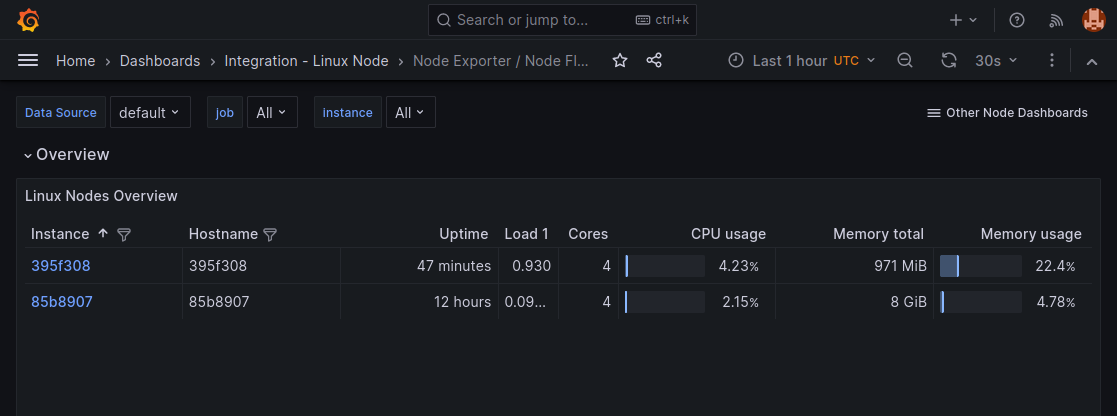
With this setup in place, you should see devices in your fleet also appear in the Grafana Cloud fleet overview dashboard, like below.
