A solution for Lemmy end-users, like me, to check the health of their favourite instance in 3 levels of details.
This is the source repository which is used to build and deploy lemmy-meter.info.
lemmy-meter provides 3 levels of reports.
This is what you are, almost always, interested in.

| Colour | Meaning | Interpretation |
|---|---|---|
| 🟢 Green | none of the health checks are failing 🙂 | Your instance is healthy and doing well. |
| 🟠 Orange | some of the health checks are failing 🫤 | Your instance may be partially down; for example mobile APIs may not be working. |
| 🔴 Red | all health checks are failing 🙁 | Your instance may be completely down; for example during a planned maintenance. |
A breakdown of overall health by few, subjectively, important endpoints:
- Landing page: the web page users when they visit the instance.
- Select API endpoints which are used by mobile (and desktop) applications:
- getPosts
- getComments
- getCmmunities

- A visual representation of how much the average response time has changed over time.
- A flat line indicates a consistent response time, regardless of being slow or fast.
- Spikes or changes in elevation mean changes in the response time.
NB: It does not represent the actual response times but only the fluctuations.

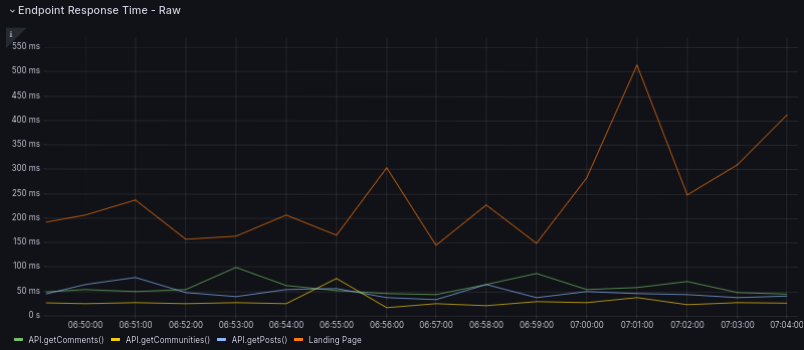
- The raw response time per endpoint as it happend.
- Lower is better. Anything below 500ms is quite decent.
- Don't read too much into the actual values.
The server is currently located in Germany which means non-EU instances will always be slightly slower than you'd expect.
The only dependency is bmakelib.
Simply run make up and make down to start the cluster and tear it down.
You can access Grafana at http://localhost:3000 (admin/admin)
Run make deploy to, well, deploy lemmy-meter to the remote server.