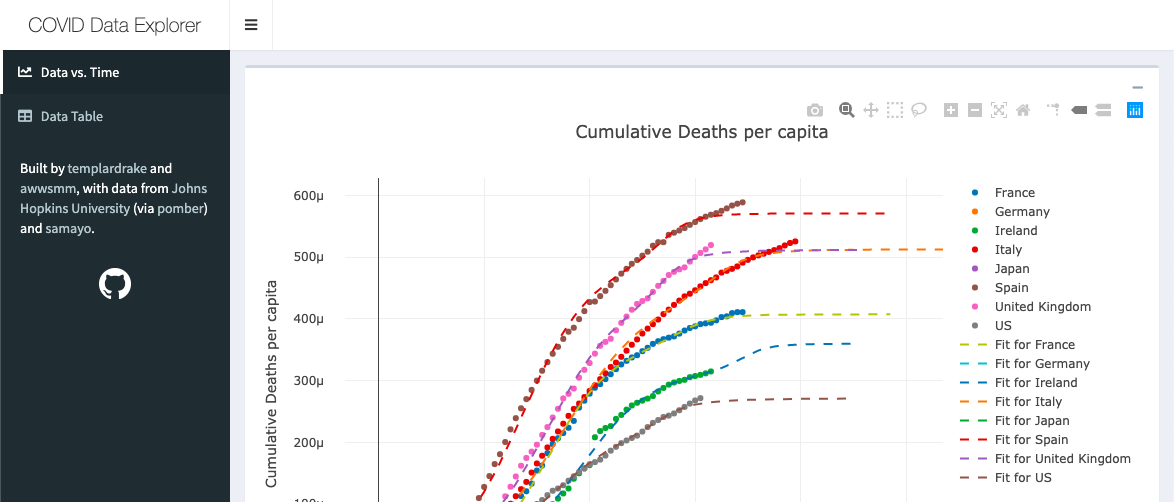
A shiny app for investigating COVID-19 data.
Built by templardrake and awwsmm.
Thanks to pomber for maintaining an up-to-date, JSON-formatted version of Johns Hopkins' COVID-19 data.
Thanks to samayo for the demographic data.
-
finish Bhatia page
- use new modules
- best-fit curve on Bhatia plot
-
add "days since" selection into x-axis title
-
fix weird loading of table page
-
add warning about forecast
-
make accumulation of data optional in data controls box
-
add errors functionality; depends on "Plot Line"
- interp => statistical band
- logistic curve => +/- 1.96 * se.fit
- none => statistical bars
-
add "postcast"
- previous forecasts compared to current data
-
use animationOptions() with sliderInput() on rewind data
-
mirror pomber's JSON file