This is the implementation for the solution architecture introduced in the blog post about monitoring the Java Virtual Machine garbage collection on AWS Lambda.
When you want to optimize your Java application on AWS Lambda for performance and cost the general steps are: Build, measure, then optimize! To accomplish this, you need a solid monitoring mechanism. Amazon CloudWatch and AWS X-Ray are well suited for this task since they already provide lots of data about your AWS Lambda function. This includes overall memory consumption, initialization time, and duration of your invocations. To examine the Java Virtual Machine (JVM) memory you require garbage collection logs from your functions. Instances of an AWS Lambda function have a short lifecycle compared to a long-running Java application server. It can be challenging to process the logs from tens or hundreds of these instances.
With this solution you emit and collect data to monitor the JVM garbage collector activity. Having this data, you can visualize out-of-memory situations of your applications in a Kibana dashboard like in the following screenshot. You gain actionable insights into your application’s memory consumption on AWS Lambda for troubleshooting and optimization.

To start, launch the solution architecture described above as a prepackaged application from the AWS Serverless Application Repository. It contains all resources ready to visualize the garbage collection logs for your Java 11 AWS Lambda functions in a Kbana dashboard. The search cluster consists of a single t3.small.elasticsearch instance with 10GB of EBS storage. It is protected with Amazon Cognito User Pools so you only need to add your user(s). The application template prefixes the search domain and the Amazon Cognito Hosted UI with a string that you can define with the applicationPrefix template parameter.

You deploy the template through the AWS Cloud Development Kit (CDK). You must install and configure the AWS CLI and the CDK.
The CDK template is written in TypeScript. TypeScript sources must be compiled to JavaScript initially and after each modification. Open a new terminal and keep this terminal open in the background if you like to change the source files. Change the directory to the one where cdk.json is and execute:
npm install
npm run watch
Read the CDK developer guide for more information.
Create or update the application with cdk deploy.
cdk deploy --parameters applicationPrefix=<PREFIX>-
As soon as the application is deployed completely the outputs of the AWS CloudFormation stack provides the links for the next steps. You will find two URLs in the AWS CloudFormation console called
createUserUrlandkibanaUrl.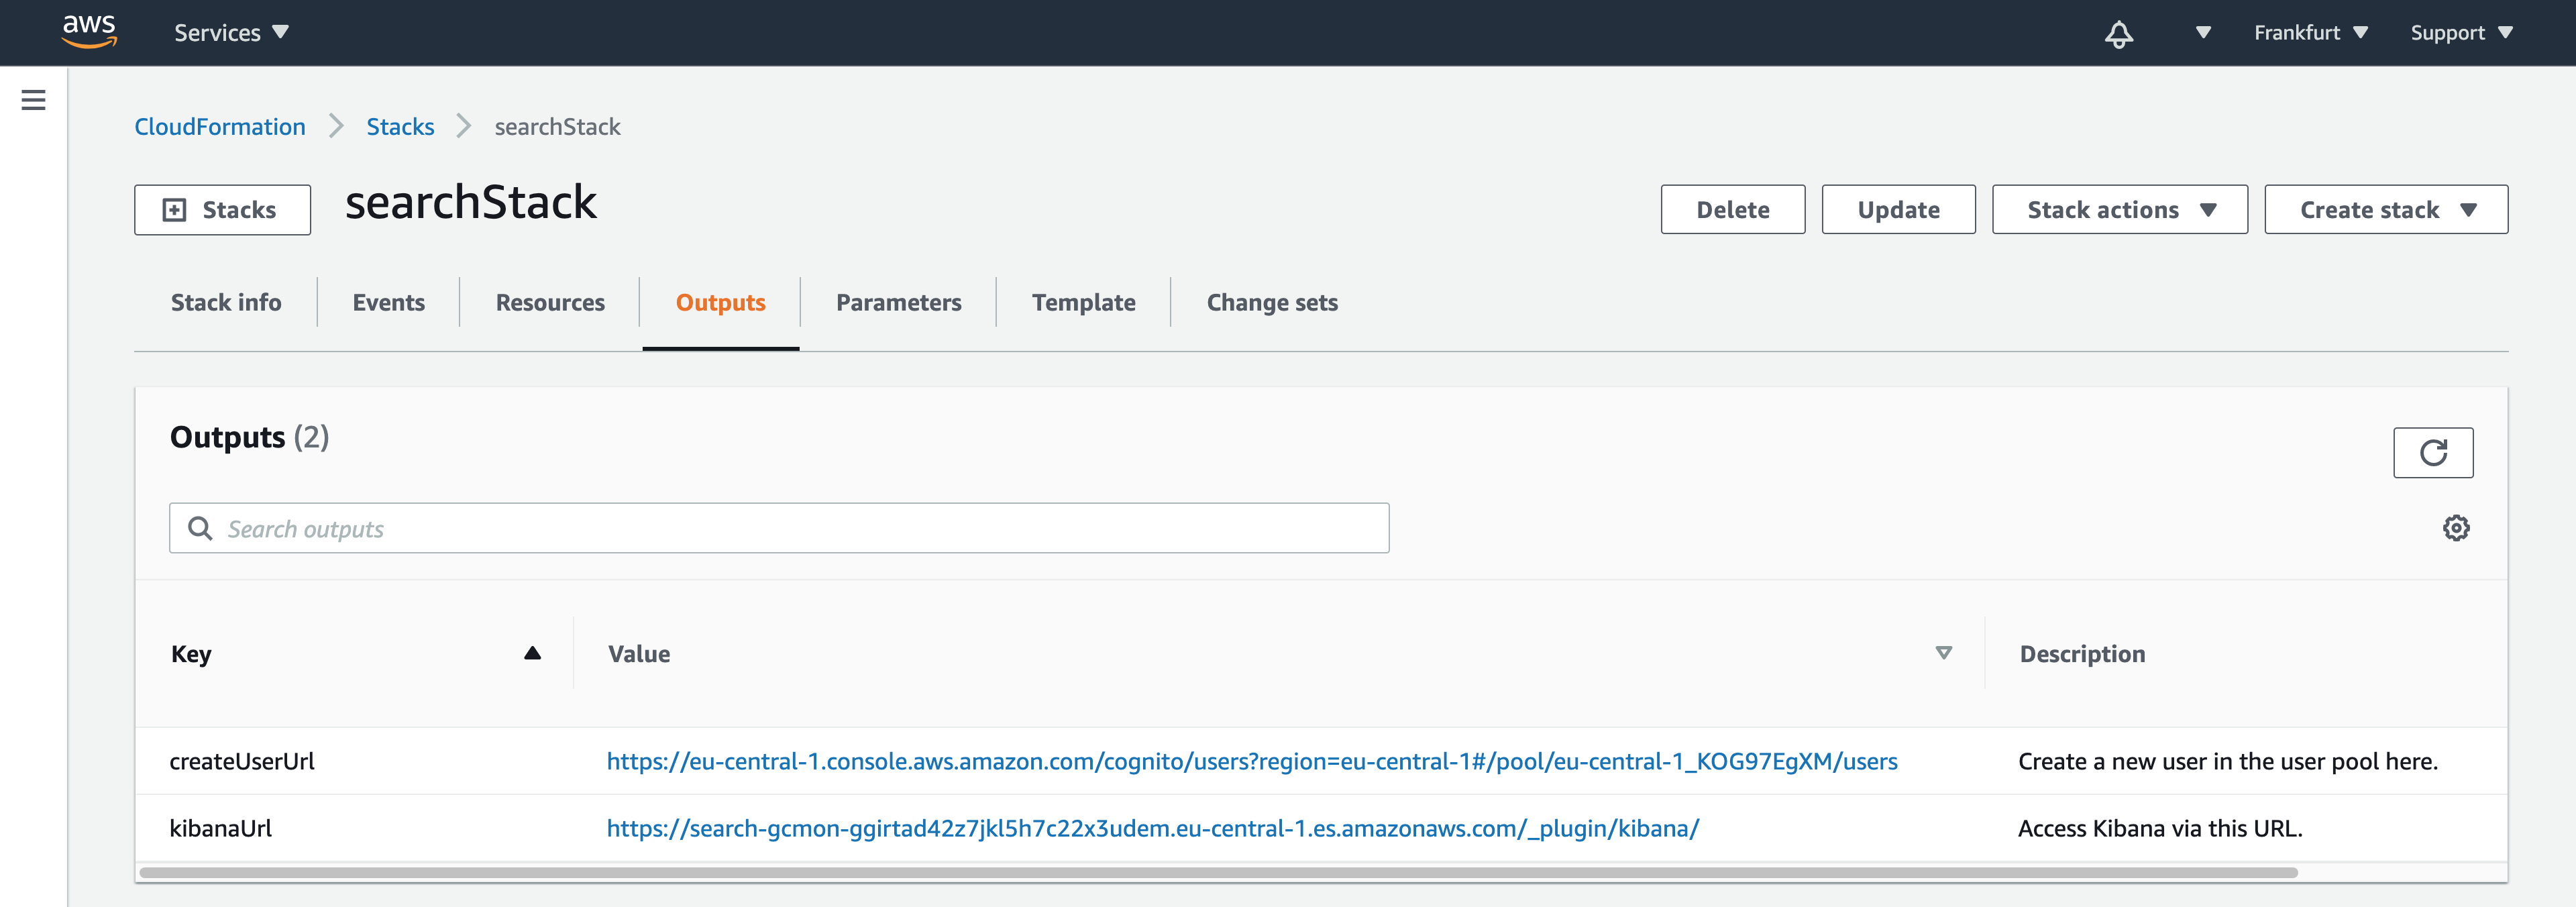
-
Use the
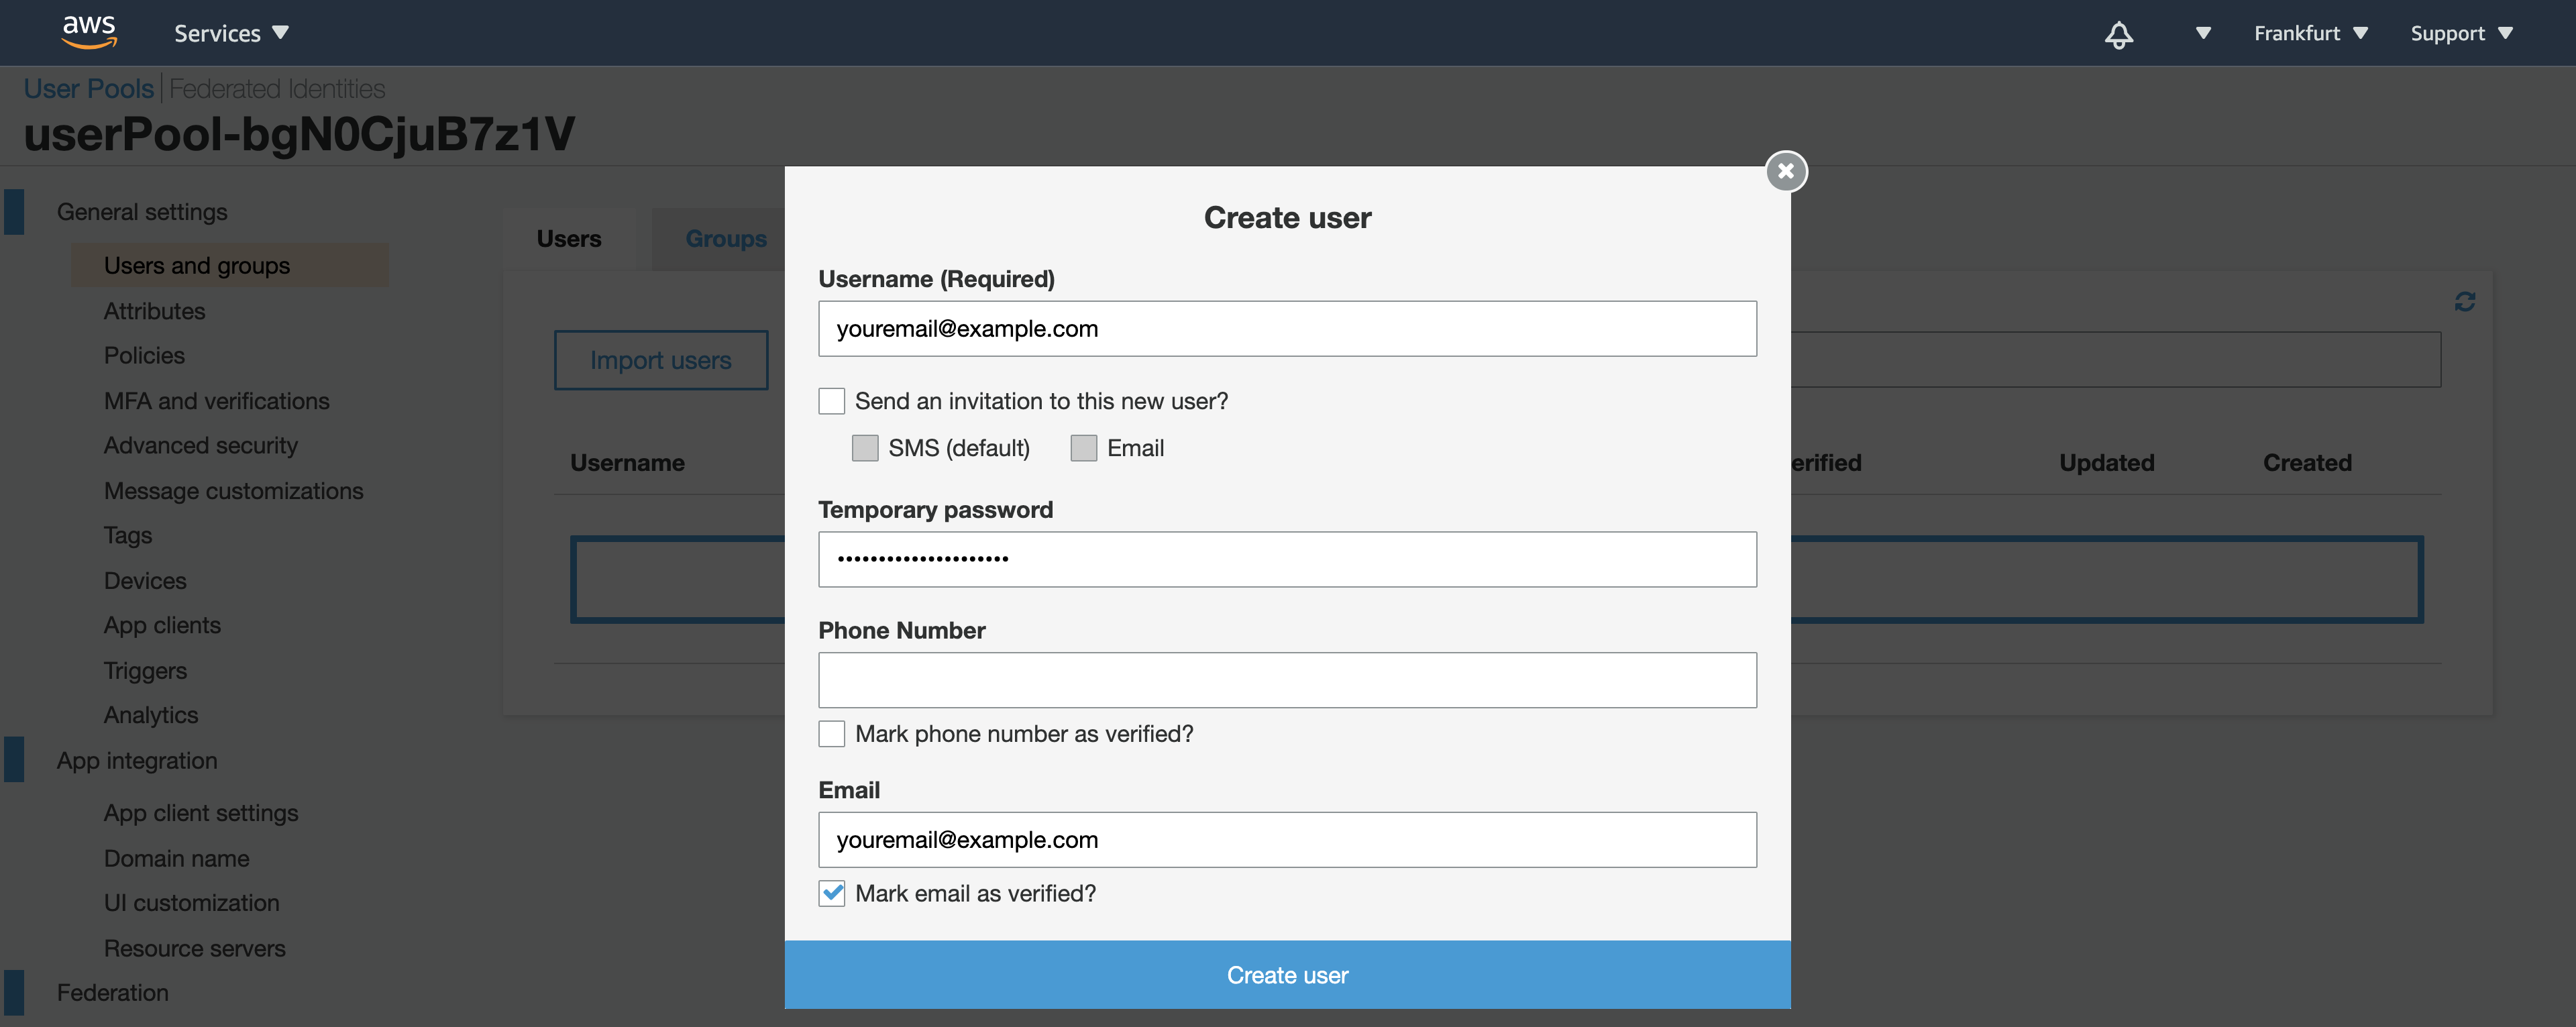
createUserUrllink from the outputs, or navigate to the Amazon Cognito user pool in the console to create a new user in the pool.- Enter an email address as username and email. Enter a temporary password of your choice with at least 8 characters.
- Leave the phone number empty and uncheck the checkbox to mark the phone number as verified.
- If necessary, you can check the checkboxes to send an invitation to the new user or to make the user verify the email address.
- Choose Create user.
-
Access the Kibana dashboard with the
kibanaUrllink from the AWS CloudFormation stack outputs, or navigate to the Kibana link displayed in the Amazon Elasticsearch Service console.- In Kibana, choose the Dashboard icon in the left menu bar
- Open the Lambda GC Activity dashboard.
-
You can test that new events appear by using the Kibana Developer Console:
POST gc-logs-2020.09.03/_doc
{
"@timestamp": "2020-09-03T15:12:34.567+0000",
"@gc_type": "Pause Young",
"@gc_cause": "Allocation Failure",
"@heap_before_gc": "2",
"@heap_after_gc": "1",
"@heap_size_gc": "9",
"@gc_duration": "5.432",
"@owner": "123456789012",
"@log_group": "/aws/lambda/myfunction",
"@log_stream": "2020/09/03/[$LATEST]123456"
}
-
When you go to the Lambda GC Activity dashboard you can see the new event. You must select the right timeframe with the Show dates link.
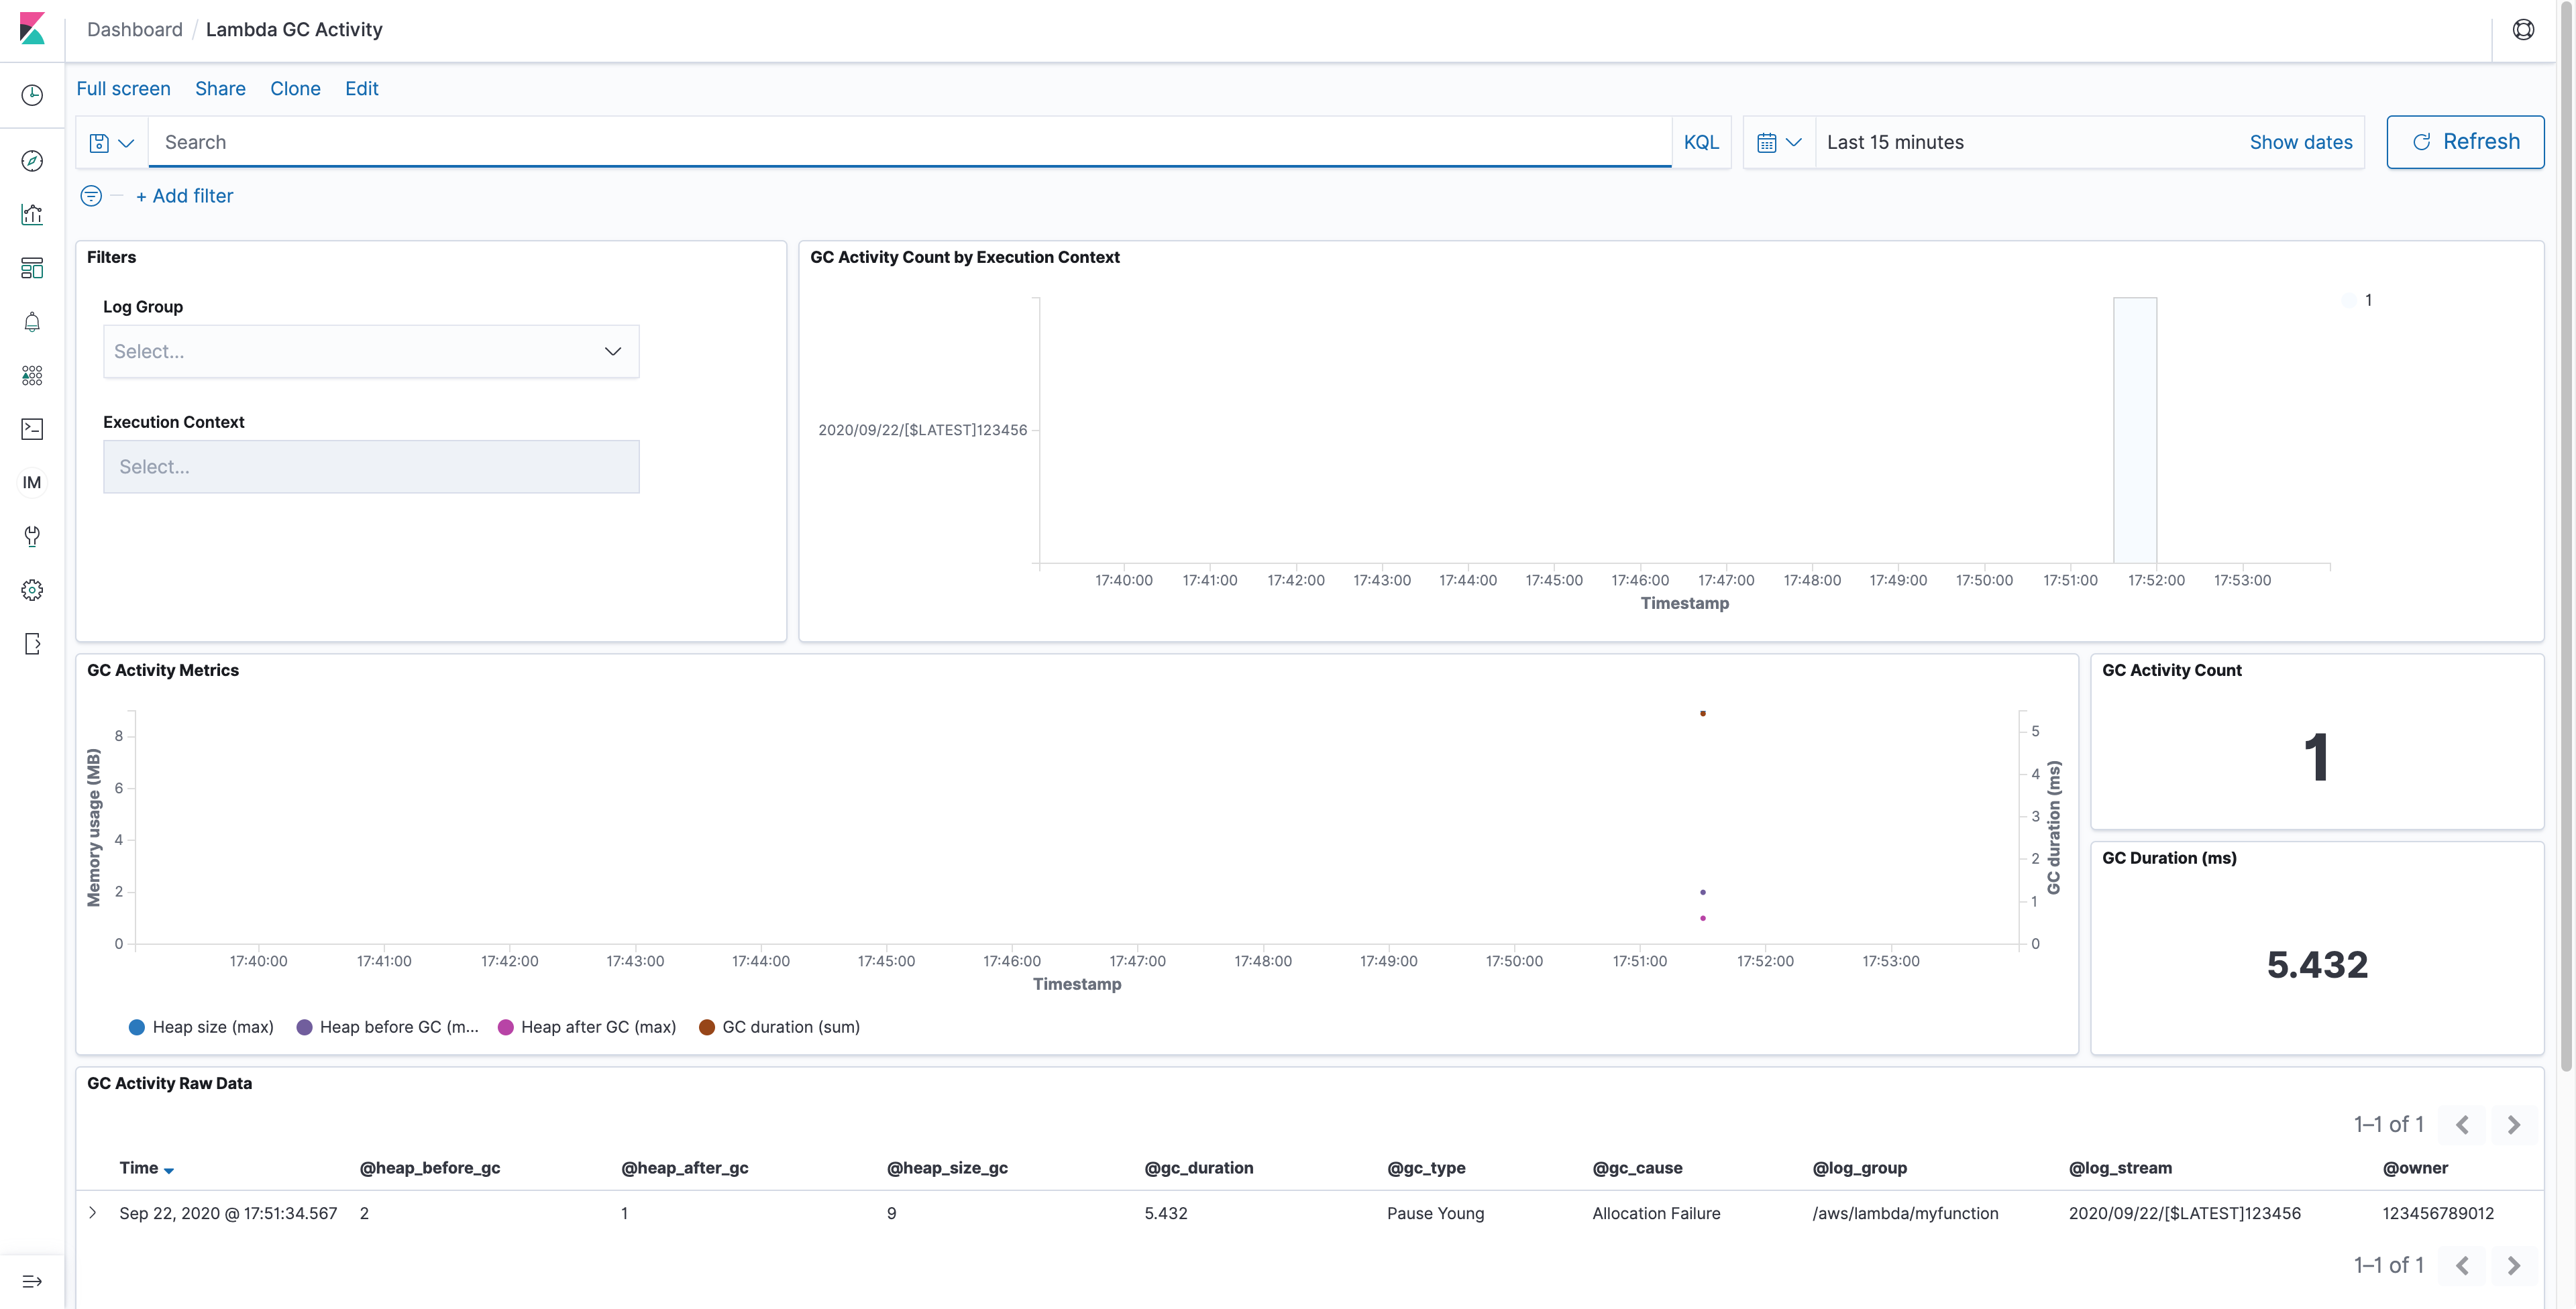


The dashboard consists of six tiles:
- In the Filters you can optionally select the log group and filter for a specific AWS Lambda function execution context by the name of its log stream.
- In the GC Activity Count by Execution Context you see a heatmap of all filtered execution contexts by garbage collection activity count.
- The GC Activity Metrics display a graph for the metrics for all filtered execution contexts.
- The GC Activity Count shows the amount of garbage collection activities that are currently displayed.
- The GC Duration show the sum of the duration of all displayed garbage collection activities.
- The GC Activity Raw Data at the bottom displays the raw items as ingested into the search cluster for a further drill down.
-
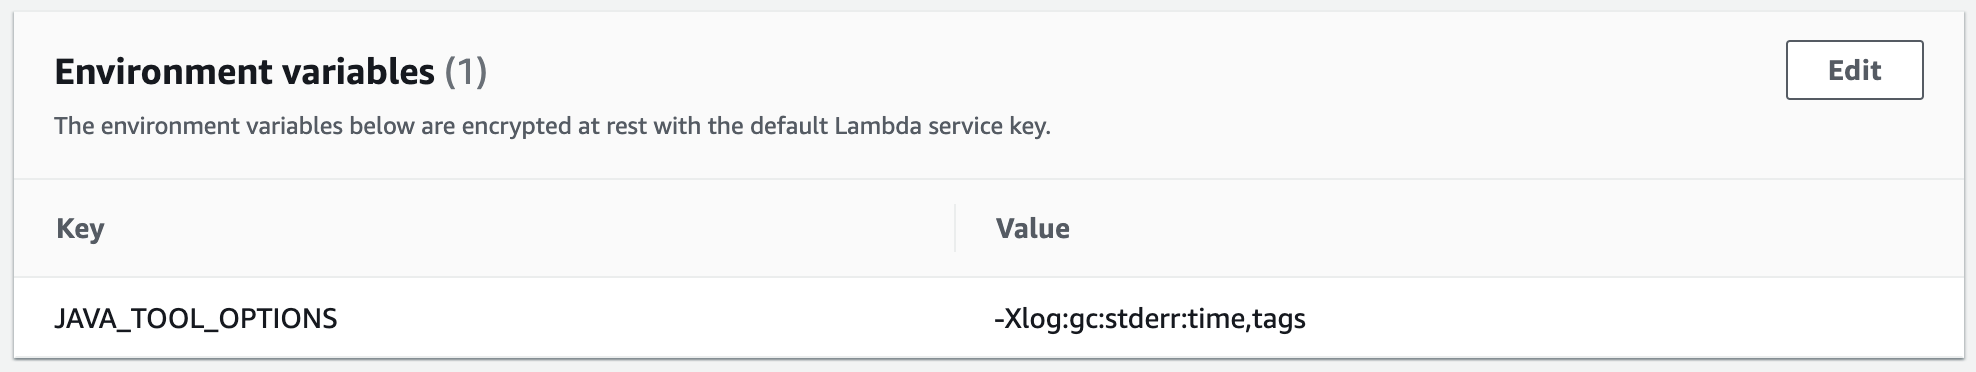
The application that you want to monitor needs to log garbage collection activities. Currently the solution supports logs from Java 11. Add the following environment variable to your AWS Lambda function to activate the logging.
JAVA_TOOL_OPTIONS=-Xlog:gc:stderr:time,tags
The environment variables must reflect this parameter like the following screenshot:
-
Go to the
streamLogsfunction in the AWS Lambda console that has been created by the stack, and subscribe it to the log group of the function you want to monitor.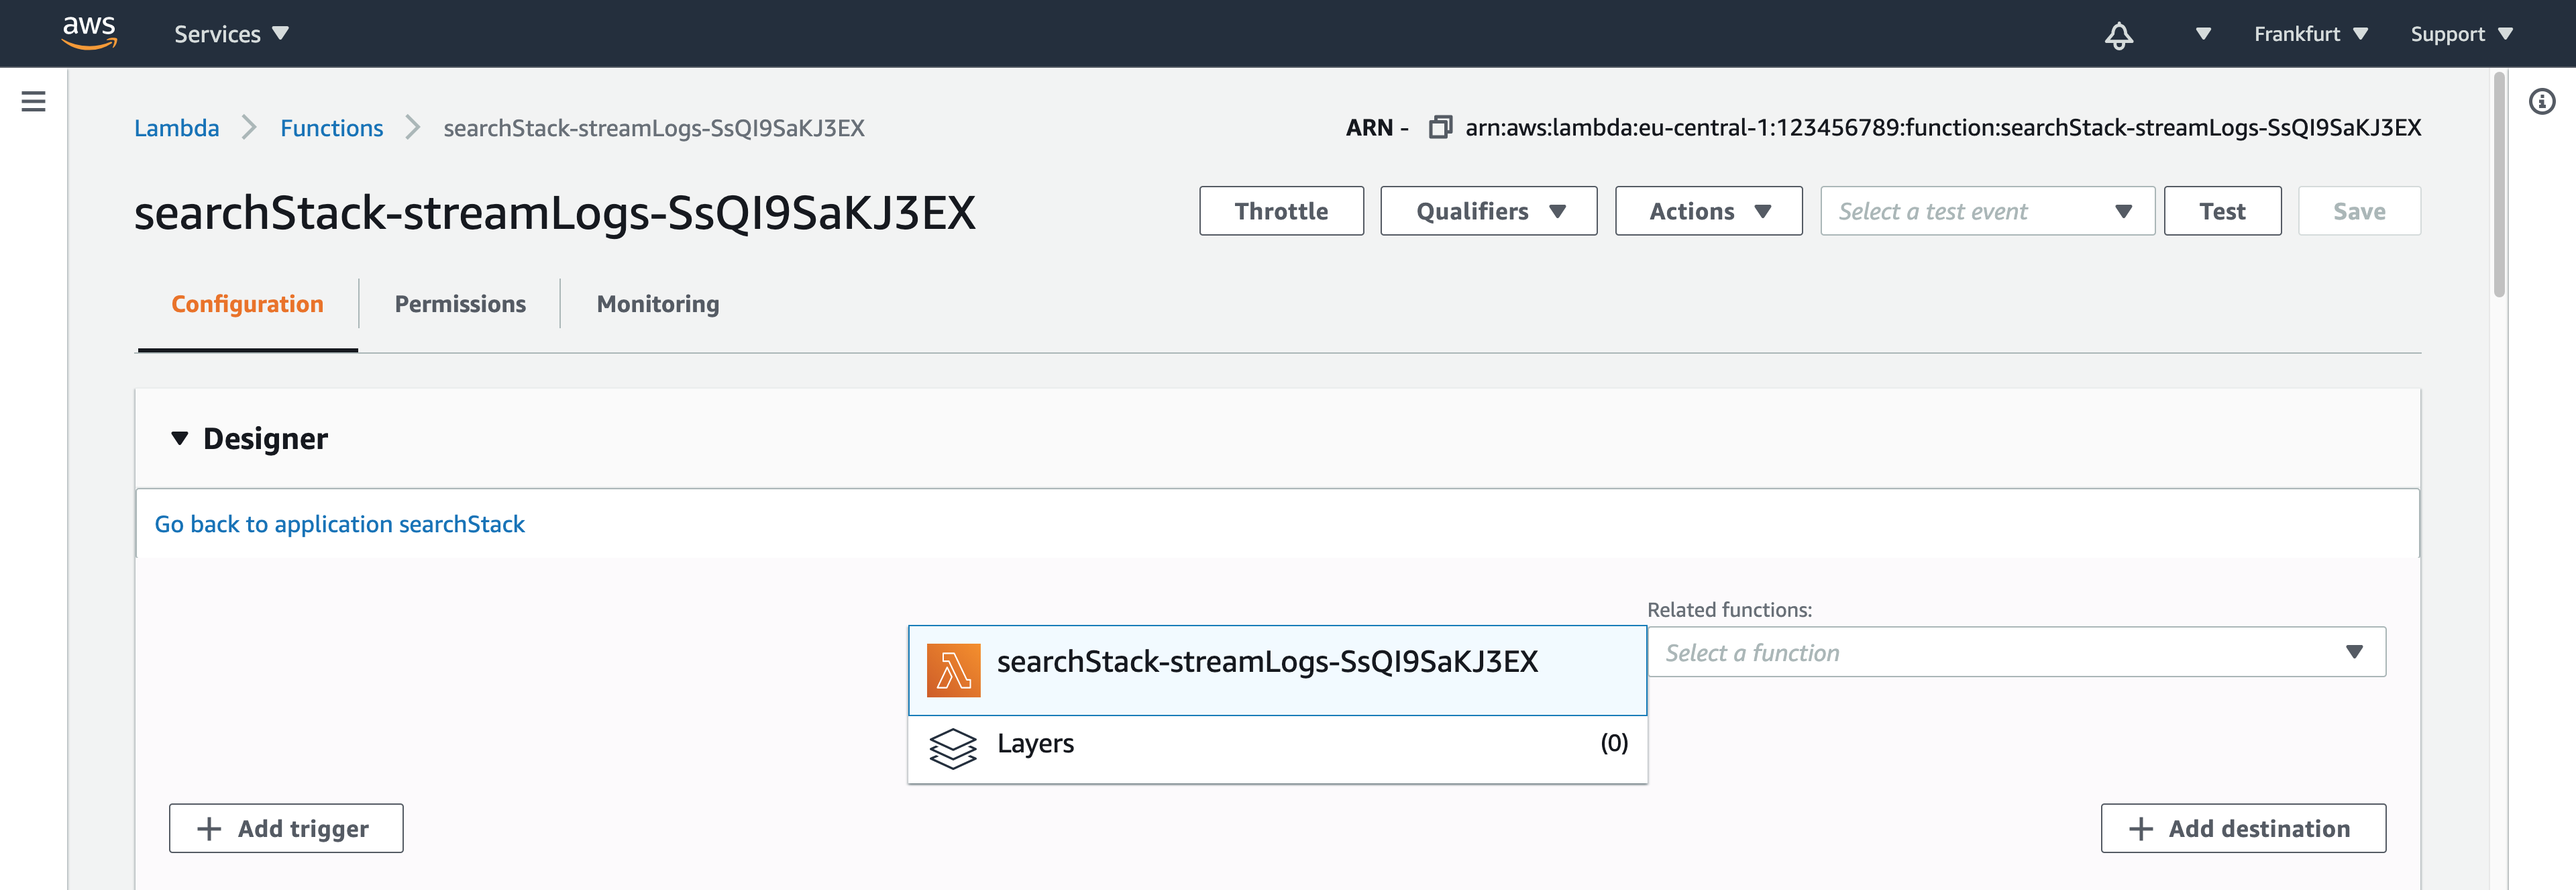
-
Select Add Trigger.
-
Select CloudWatch Logs as Trigger Configuration.
-
Input a Filter name of your choice.
-
Input
"[gc"(including quotes) as the Filter pattern to match all garbage collection log entries. -
Select the Log Group of the function you want to monitor. The following screenshot subscribes to the logs of the application’s function
resize-lambda-ResizeFn-[...].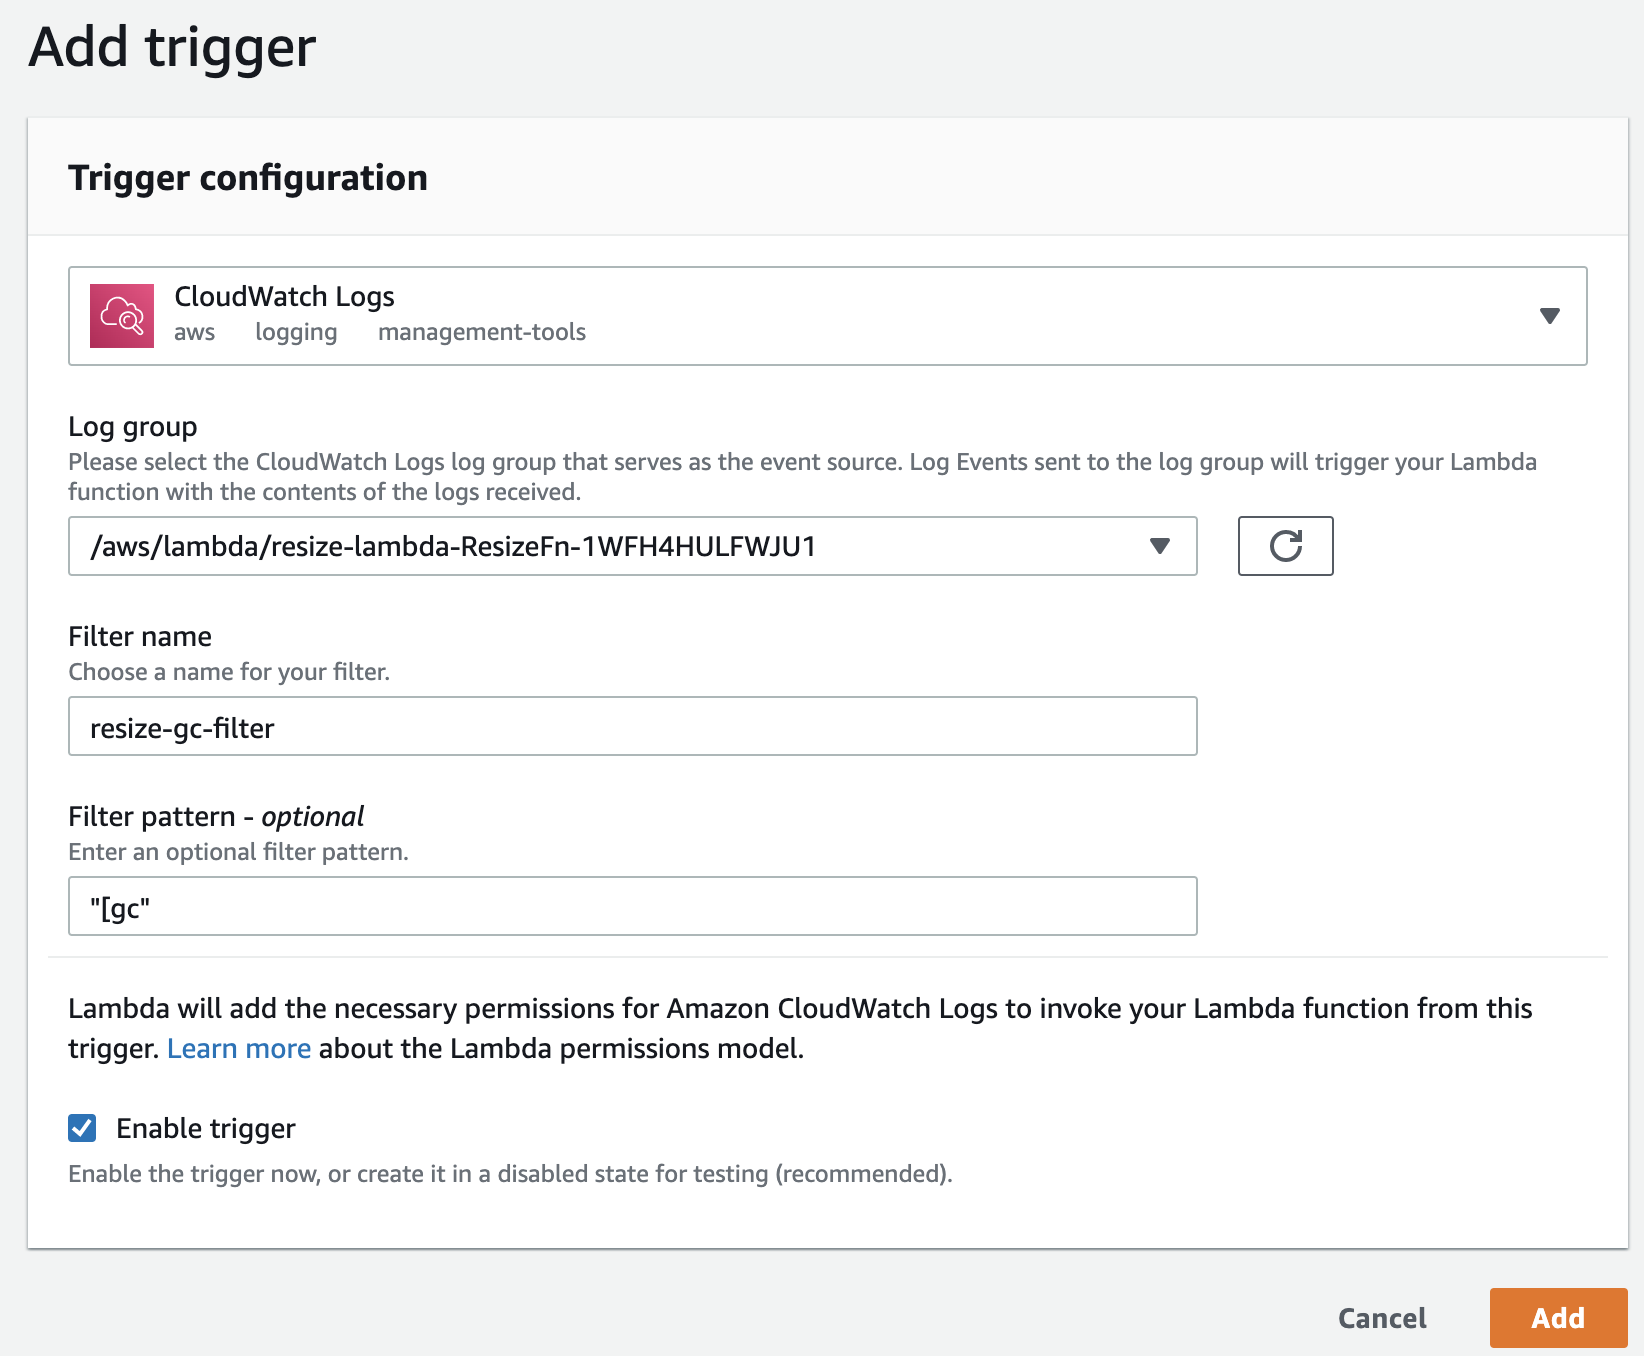
-
Select Add.
-
Execute the AWS Lambda function you want to monitor.
-
Refresh the dashboard in Amazon Elasticsearch Service and see the datapoint added manually before appearing in the graph.


If you do not need the garbage collection monitoring anymore, delete the subscription filter from the log group of your AWS Lambda function(s). Also, delete the stack of the solution above in the AWS CloudFormation console to clean up resources.
- Sign in to the AWS CloudFormation console and choose your stack.
- Choose the
streamLogsAWS Lambda function so the function is displayed in the AWS Lambda console. - Delete all triggers in the Designer panel.
- Go back to the AWS CloudFormation console and your stack.
- Choose Delete to delete all resources, including the search cluster and the Amazon Cognito user pool.
The Launch Stack button above opens the AWS Serverless Application Repository in the US East 1 (Northern Virginia) region. You may switch to other regions from there before deployment.
Standard AWS charges apply to the resources you deploy with this template.
Cost for the processing and transformation of your function's Amazon CloudWatch Logs incurs when your function is called. This cost depends on your application and how often GC activities are triggered.
Amazon Elasticsearch Service provides customers in the AWS Free Tier free usage of up to 750 hours per month of the configuration in this template, i.e. a single-AZ t3.small.elasticsearch instance and 10GB of EBS storage for up to one year from the date the account was created. If you exceed the free tier limits, you will be charged the Amazon Elasticsearch Service rates for the additional resources you use. Read an estimate of the monthly cost of the search cluster.
The Amazon Cognito User Pool feature has a free tier of 50,000 monthly active users for users who sign in directly to Cognito User Pools. The free tier does not automatically expire at the end of your 12 month AWS Free Tier term, and it is available to both existing and new AWS customers indefinitely.
See offer terms of Amazon Cognito, Amazon Elasticsearch Service, AWS Lambda, and Amazon CloudWatch for more details.
See the Contributing Guidelines for details.
See CONTRIBUTING for more information.
This library is licensed under the MIT-0 License. See the LICENSE file.