- Application
- Build and Test using Maven
- Build and Test using Docker
- Minimal Docker Image using Custom JRE
- Build and Test using Kubernetes
- Debug Docker and Kubernetes using IntelliJ
- Kubernetes Cluster on AWS
- Migrate from Dev to Prod
- Service Mesh using AWS App Mesh
- Service Mesh using Istio
- Chaos using kube-monkey
- Deployment Pipeline using Skaffold
- Deployment Pipeline using CodePipeline
- Deployment Pipeline using Jenkins X
Deploying your Java application in a Kubernetes cluster could feel like Alice in Wonderland. You keep going down the rabbit hole and don’t know how to make that ride comfortable. This repository explains how a Java application can be deployed, tested, debugged and monitored in Kubernetes. In addition, it also talks about canary deployment and deployment pipeline.
A comprehensive hands-on course explaining these concepts is available at https://www.linkedin.com/learning/kubernetes-for-java-developers.
We will use a simple Java application built using Spring Boot. The application publishes a REST endpoint that can be invoked at http://{host}:{port}/hello.
The source code is in the app directory.
-
Run application:
cd app
mvn spring-boot:run
-
Test application
curl http://localhost:8080/hello
-
Create
m2.tar.gz:mvn -Dmaven.repo.local=./m2 clean package tar cvf m2.tar.gz ./m2
-
Create Docker image:
docker image build -t arungupta/greeting .
Explain multi-stage Dockerfile.
Build Docker Image using Jib
-
Create Docker image:
mvn compile jib:build -Pjib
The benefits of using Jib over a multi-stage Dockerfile build include:
-
Don’t need to install Docker or run a Docker daemon
-
Don’t need to write a Dockerfile or build the archive of m2 dependencies
-
Much faster
-
Builds reproducibly
The above builds directly to your Docker registry. Alternatively, Jib can also build to a Docker daemon:
mvn compile jib:dockerBuild -Pjib -Ddocker.name=arungupta/greeting
-
Download JDK 11 and
scpto an Amazon Linux instance -
Install JDK 11:
sudo yum install jdk-11.0.1_linux-x64_bin.rpm
-
Create a custom JRE for the Spring Boot application:
cp target/app.war target/app.jar
jlink \
	--output myjre \
	--add-modules $(jdeps --print-module-deps target/app.jar),\
	java.xml,jdk.unsupported,java.sql,java.naming,java.desktop,\
	java.management,java.security.jgss,java.instrument
-
Build Docker image using this custom JRE:
docker image build --file Dockerfile.jre -t arungupta/greeting:jre-slim .
-
List the Docker images and show the difference in sizes:
[ec2-user@ip-172-31-21-7 app]$ docker image ls | grep greeting
arungupta/greeting   jre-slim            9eed25582f36        6 seconds ago       162MB
arungupta/greeting   latest              1b7c061dad60        10 hours ago        490MB
-
Run the container:
docker container run -d -p 8080:8080 arungupta/greeting:jre-slim
-
Access the application:
curl http://localhost:8080/hello
A single node Kubernetes cluster can be easily created on a development machine using Minikube, MicroK8s, KIND, and Docker for Mac. Read on why using these local development environments does not truly represent your prod cluster.
This tutorial will use Docker for Mac.
-
Ensure that Kubernetes is enabled in Docker for Mac
-
Show the list of contexts:
kubectl config get-contexts
-
Configure kubectl CLI for Kubernetes cluster
kubectl config use-context docker-for-desktop
-
Install the Helm CLI:
brew install kubernetes-helm
If Helm CLI is already installed then use
brew upgrade kubernetes-helm. -
Check Helm version:
helm version
-
Install Helm in Kubernetes cluster:
helm init
If Helm has already been initialized on the cluster, then you may have to upgrade Tiller:
helm init --upgrade
-
Install the Helm chart:
cd ..
helm install --name myapp manifests/myapp
-
Check that the pod is running:
kubectl get pods
-
Check that the service is up:
kubectl get svc
-
Access the application:
curl http://$(kubectl get svc/myapp-greeting \
	-o jsonpath='{.status.loadBalancer.ingress[0].hostname}'):8080/hello
You can debug a Docker container and a Kubernetes Pod if they’re running locally on your machine.
This was tested using Docker for Mac/Kubernetes. Use the previously deployed Helm chart.
-
Show service:
kubectl get svc
NAME               TYPE           CLUSTER-IP       EXTERNAL-IP   PORT(S)                         AGE
greeting-service   LoadBalancer   10.101.39.100    <pending>     80:30854/TCP                    8m
kubernetes         ClusterIP      10.96.0.1        <none>        443/TCP                         90d
myapp-greeting     LoadBalancer   10.108.104.178   localhost     8080:32189/TCP,5005:31117/TCP   4s
Highlight the debug port is also forwarded.
-
In IntelliJ,
Run,Debug,Remote: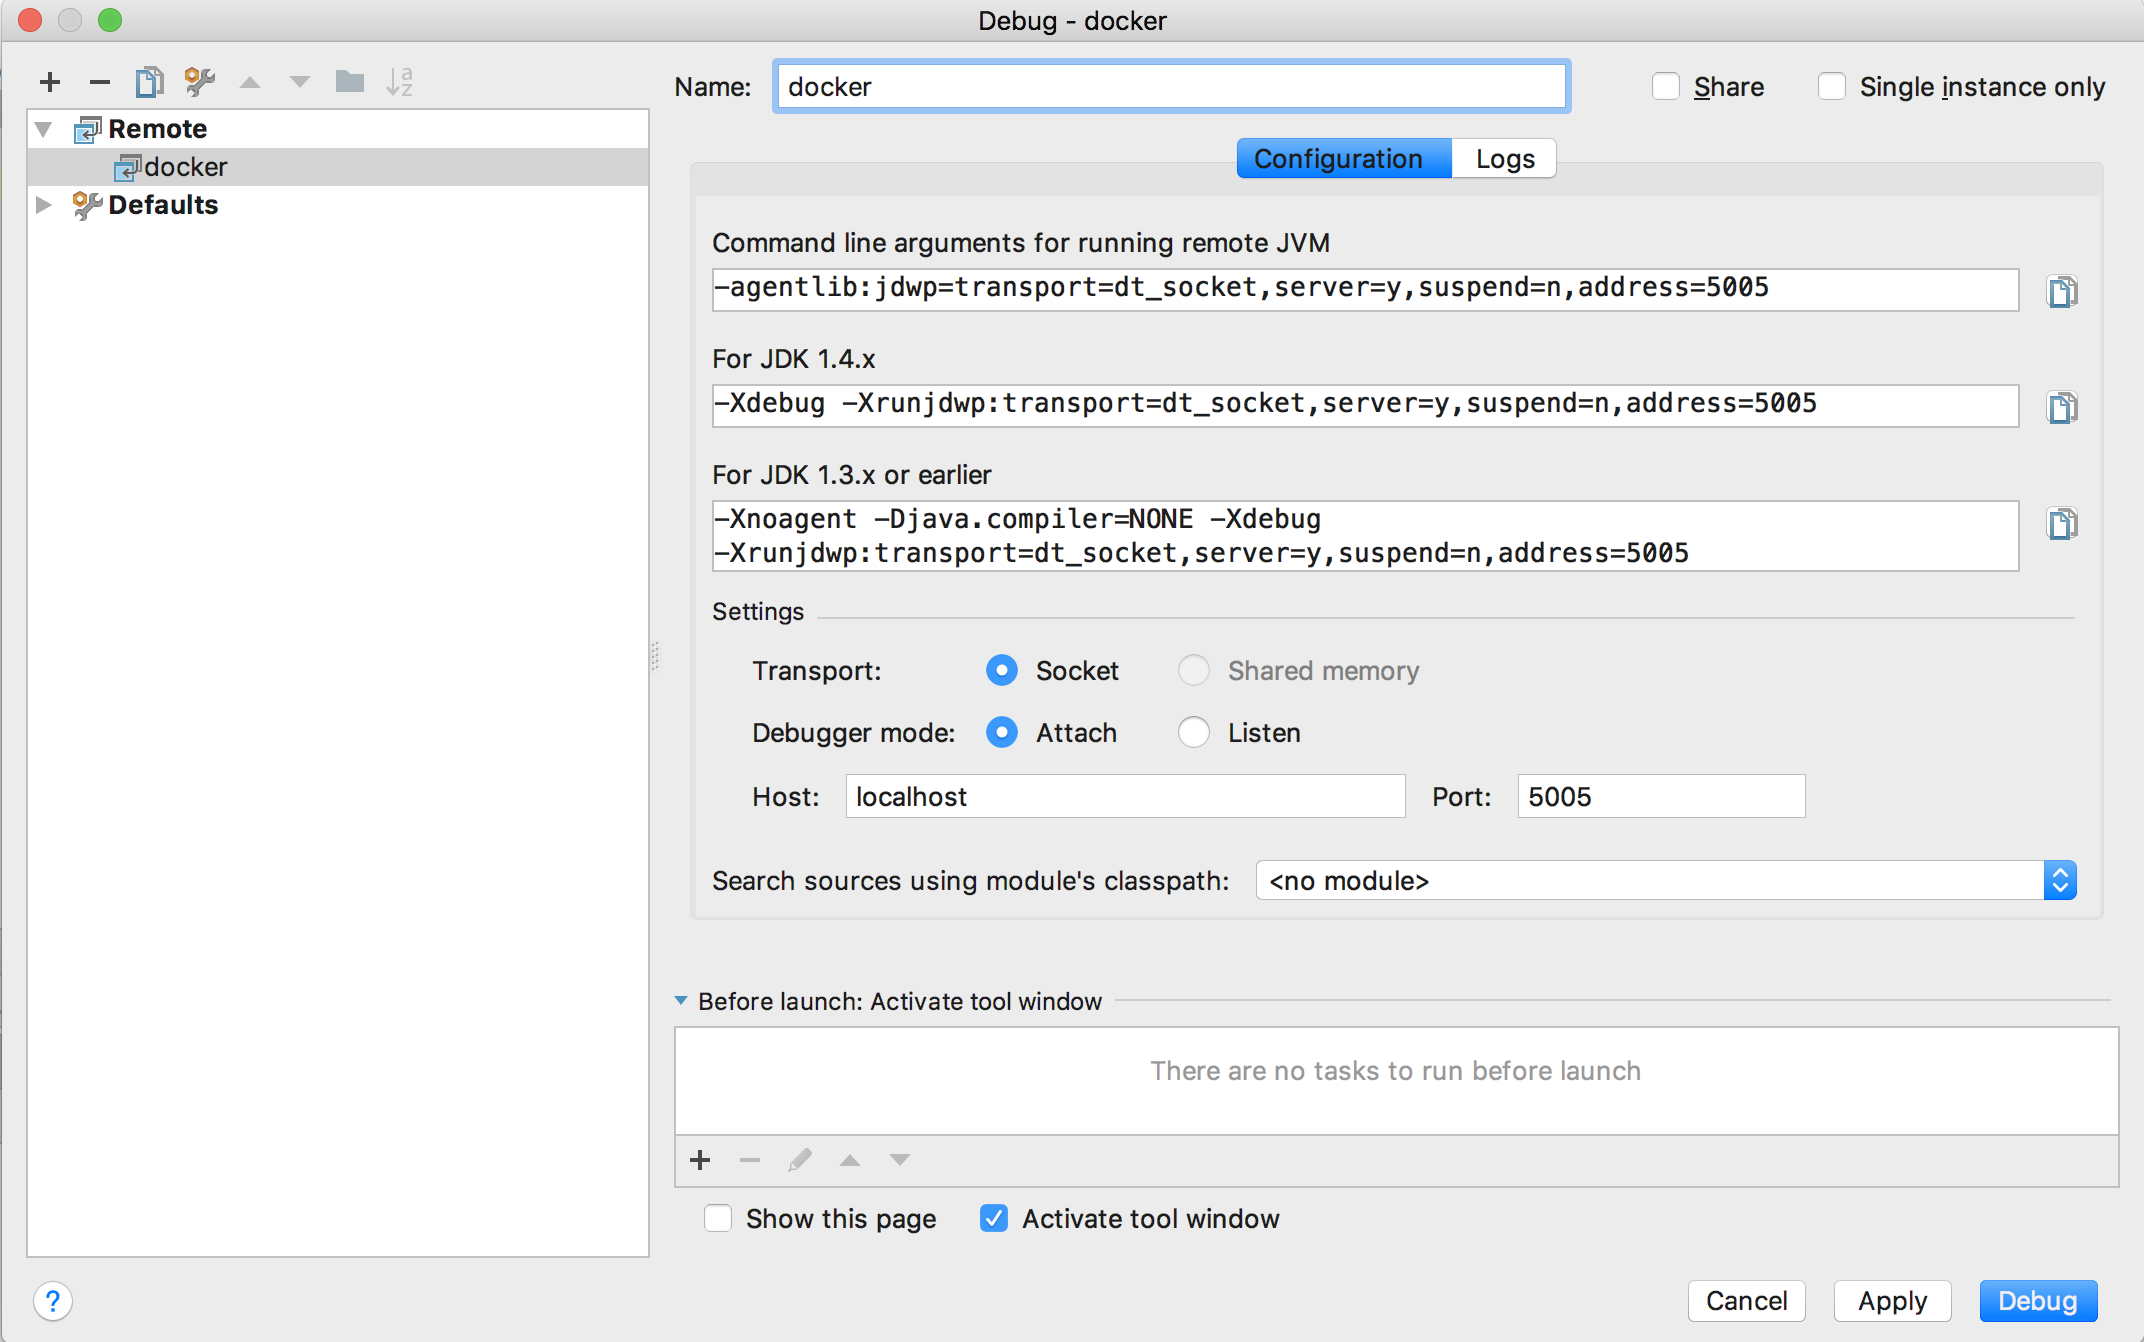
-
Click on
Debug, setup a breakpoint in the class: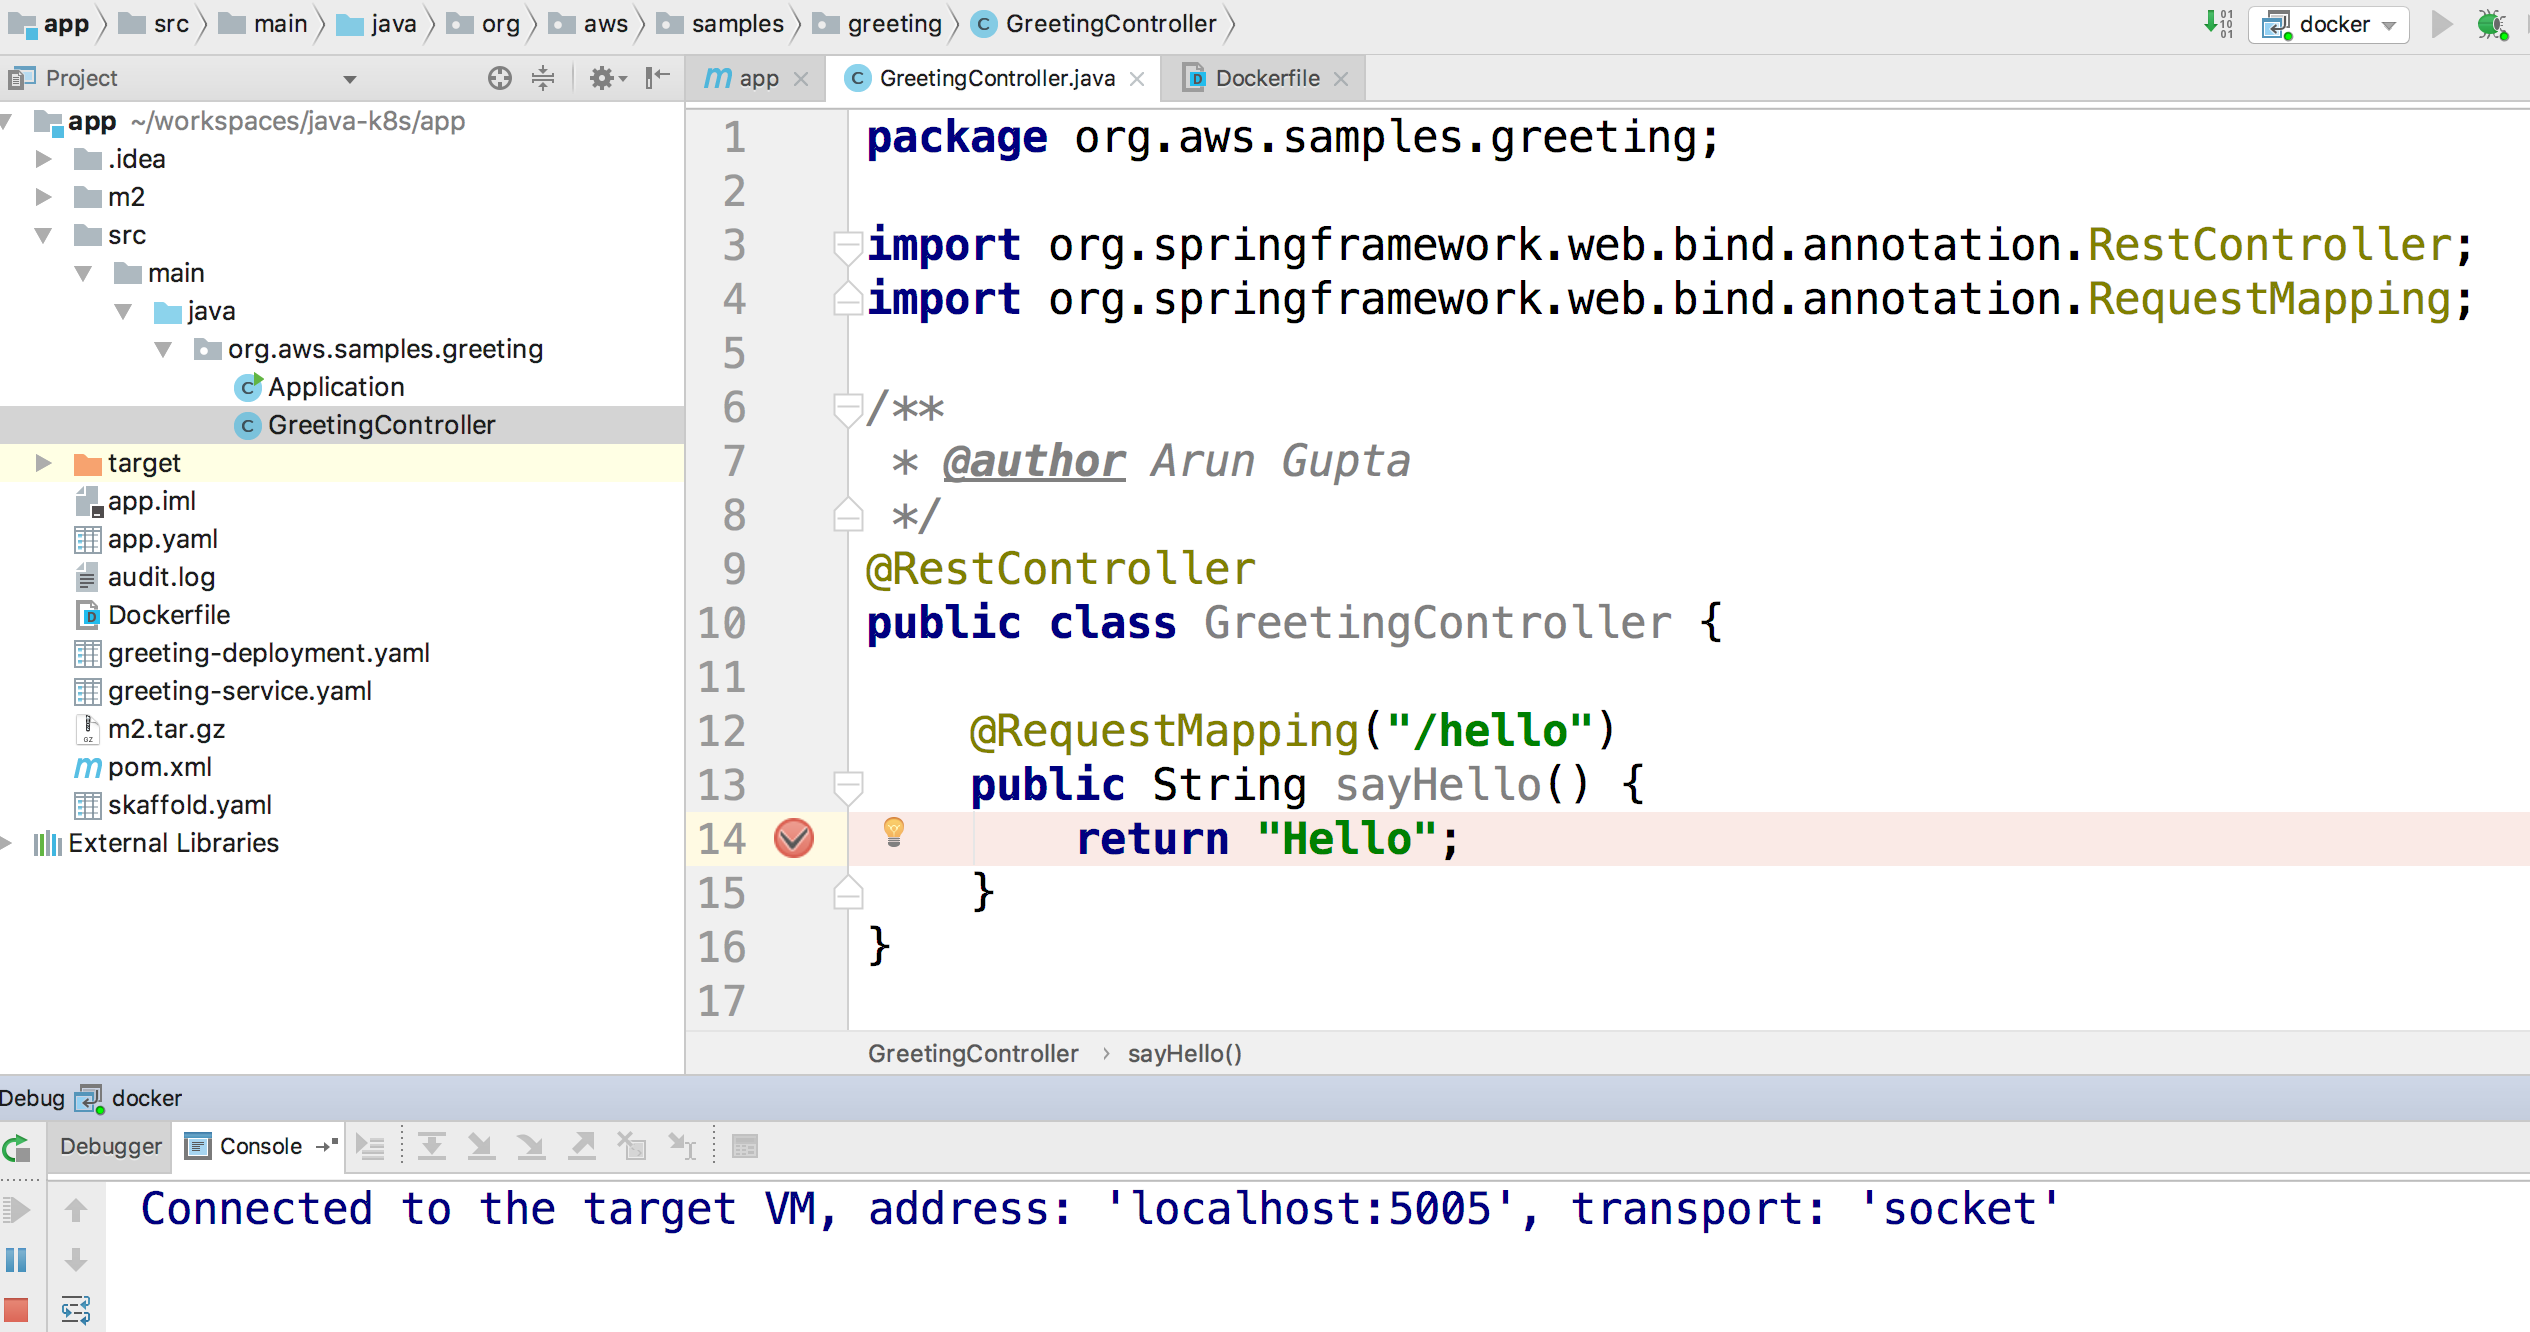
-
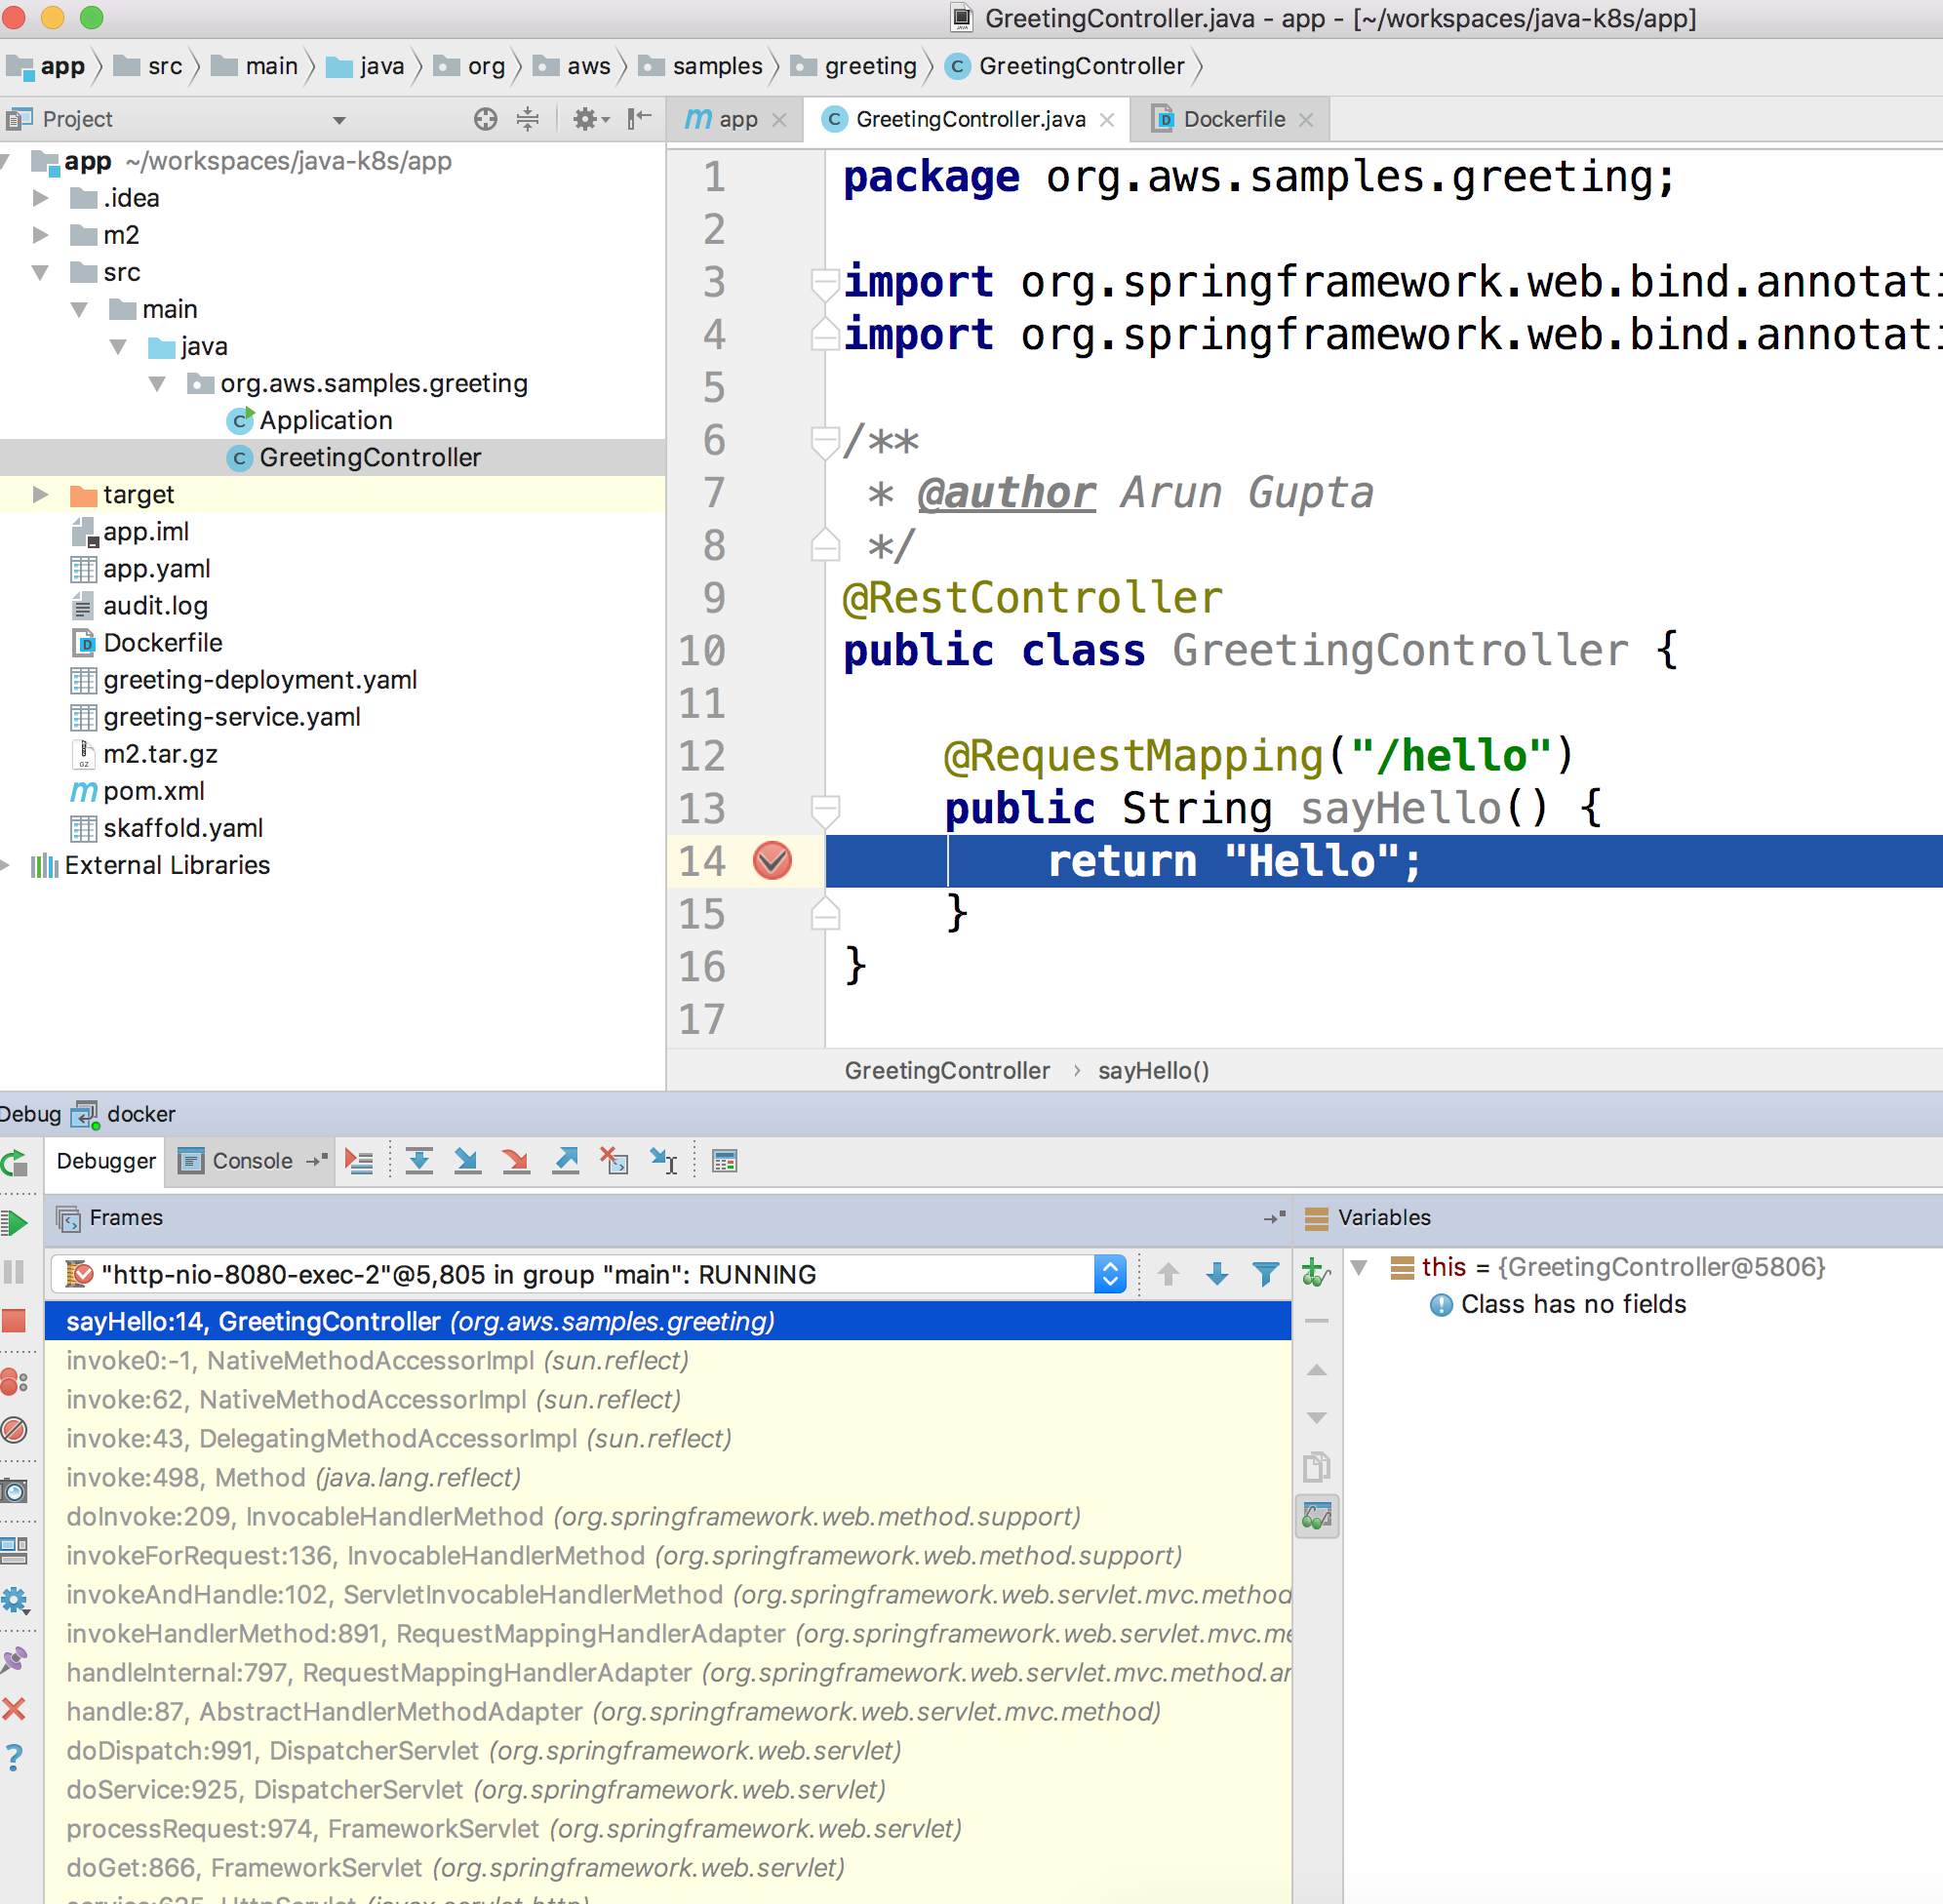
Access the application:
curl http://$(kubectl get svc/myapp-greeting \ -o jsonpath='{.status.loadBalancer.ingress[0].hostname}'):8080/hello -
Show the breakpoint hit in IntelliJ:
-
Delete the Helm chart:
helm delete --purge myapp


This was tested using Docker for Mac.
-
Run container:
docker container run --name greeting -p 8080:8080 -p 5005:5005 -d arungupta/greeting
-
Check container:
$ docker container ls -a
CONTAINER ID        IMAGE                COMMAND                  CREATED             STATUS              PORTS                                            NAMES
724313157e3c        arungupta/greeting   "java -jar app-swarm…"   3 seconds ago       Up 2 seconds        0.0.0.0:5005->5005/tcp, 0.0.0.0:8080->8080/tcp   greeting
-
Setup breakpoint as explained above.
-
Access the application using
curl http://localhost:8080/resources/greeting.
This application will be deployed to an Amazon EKS cluster. If you’re looking for a self-paced workshop that provide detailed instructions to get you started with EKS then eksworkshop.com is your place.
Let’s create the cluster first.
-
Install eksctl CLI:
brew install weaveworks/tap/eksctl
-
Create EKS cluster:
eksctl create cluster --name myeks --nodes 4 --region us-west-2
2018-10-25T13:45:38+02:00 [ℹ]  setting availability zones to [us-west-2a us-west-2c us-west-2b]
2018-10-25T13:45:39+02:00 [ℹ]  using "ami-0a54c984b9f908c81" for nodes
2018-10-25T13:45:39+02:00 [ℹ]  creating EKS cluster "myeks" in "us-west-2" region
2018-10-25T13:45:39+02:00 [ℹ]  will create 2 separate CloudFormation stacks for cluster itself and the initial nodegroup
2018-10-25T13:45:39+02:00 [ℹ]  if you encounter any issues, check CloudFormation console or try 'eksctl utils describe-stacks --region=us-west-2 --name=myeks'
2018-10-25T13:45:39+02:00 [ℹ]  creating cluster stack "eksctl-myeks-cluster"
2018-10-25T13:57:33+02:00 [ℹ]  creating nodegroup stack "eksctl-myeks-nodegroup-0"
2018-10-25T14:01:18+02:00 [✔]  all EKS cluster resource for "myeks" had been created
2018-10-25T14:01:18+02:00 [✔]  saved kubeconfig as "/Users/argu/.kube/config"
2018-10-25T14:01:19+02:00 [ℹ]  the cluster has 0 nodes
2018-10-25T14:01:19+02:00 [ℹ]  waiting for at least 4 nodes to become ready
2018-10-25T14:01:50+02:00 [ℹ]  the cluster has 4 nodes
2018-10-25T14:01:50+02:00 [ℹ]  node "ip-192-168-161-180.us-west-2.compute.internal" is ready
2018-10-25T14:01:50+02:00 [ℹ]  node "ip-192-168-214-48.us-west-2.compute.internal" is ready
2018-10-25T14:01:50+02:00 [ℹ]  node "ip-192-168-75-44.us-west-2.compute.internal" is ready
2018-10-25T14:01:50+02:00 [ℹ]  node "ip-192-168-82-236.us-west-2.compute.internal" is ready
2018-10-25T14:01:52+02:00 [ℹ]  kubectl command should work with "/Users/argu/.kube/config", try 'kubectl get nodes'
2018-10-25T14:01:52+02:00 [✔]  EKS cluster "myeks" in "us-west-2" region is ready
-
Check the nodes:
kubectl get nodes
NAME                                            STATUS   ROLES    AGE   VERSION
ip-192-168-161-180.us-west-2.compute.internal   Ready    <none>   52s   v1.10.3
ip-192-168-214-48.us-west-2.compute.internal    Ready    <none>   57s   v1.10.3
ip-192-168-75-44.us-west-2.compute.internal     Ready    <none>   57s   v1.10.3
ip-192-168-82-236.us-west-2.compute.internal    Ready    <none>   54s   v1.10.3
-
Get the list of configs:
kubectl config get-contexts
CURRENT   NAME                             CLUSTER                      AUTHINFO                         NAMESPACE
*         arun@myeks.us-west-2.eksctl.io   myeks.us-west-2.eksctl.io    arun@myeks.us-west-2.eksctl.io
          docker-for-desktop               docker-for-desktop-cluster   docker-for-desktop
As indicated by
*, kubectl CLI configuration is updated to the recently created cluster.
-
Explicitly set the context:
kubectl config use-context arun@myeks.us-west-2.eksctl.io
-
Install Helm:
kubectl -n kube-system create sa tiller
kubectl create clusterrolebinding tiller --clusterrole cluster-admin --serviceaccount=kube-system:tiller
helm init --service-account tiller
-
Check the list of pods:
kubectl get pods -n kube-system
NAME                            READY   STATUS    RESTARTS   AGE
aws-node-774jf                  1/1     Running   1          2m
aws-node-jrf5r                  1/1     Running   0          2m
aws-node-n46tw                  1/1     Running   0          2m
aws-node-slgns                  1/1     Running   0          2m
kube-dns-7cc87d595-5tskv        3/3     Running   0          8m
kube-proxy-2ghg6                1/1     Running   0          2m
kube-proxy-hqxwg                1/1     Running   0          2m
kube-proxy-lrwrr                1/1     Running   0          2m
kube-proxy-x77tq                1/1     Running   0          2m
tiller-deploy-895d57dd9-txqk4   1/1     Running   0          15s
-
Redeploy the application:
helm install --name myapp manifests/myapp
-
Get the service:
kubectl get svc
NAME             TYPE           CLUSTER-IP       EXTERNAL-IP                                                             PORT(S)                         AGE
kubernetes       ClusterIP      10.100.0.1       <none>                                                                  443/TCP                         17m
myapp-greeting   LoadBalancer   10.100.241.250   a8713338abef211e8970816cb629d414-71232674.us-east-1.elb.amazonaws.com   8080:32626/TCP,5005:30739/TCP   2m
It shows the port
8080and5005are published and an Elastic Load Balancer is provisioned. It takes about three minutes for the load balancer to be ready. -
Access the application:
curl http://$(kubectl get svc/myapp-greeting \ -o jsonpath='{.status.loadBalancer.ingress[0].hostname}'):8080/hello -
Delete the application:
helm delete --purge myapp
AWS App Mesh is a service mesh that provides application-level networking to make it easy for your services to communicate with each other across multiple types of compute infrastructure. App Mesh can be used with Amazon EKS or Kubernetes running on AWS. In addition, it also works with other container services offered by AWS such as AWS Fargate and Amazon ECS. It also works with microservices deployed on Amazon EC2.
A thorough detailed example that shows how to use App Mesh with EKS is available at Service Mesh with App Mesh. This section provides a simplistic setup using the configuration files from there.
All scripts used in this section are in the manifests/appmesh directory.
-
Set a variable
ROLE_NAMEto IAM role for the EKS worker nodes:ROLE_NAME=$(aws iam list-roles \ --query \ 'Roles[?contains(RoleName,`eksctl-myeks-nodegroup`)].RoleName' --output text)
-
Setup permissions for the worker nodes:
aws iam attach-role-policy \
	--role-name $ROLE_NAME \
	--policy-arn arn:aws:iam::aws:policy/AWSAppMeshFullAccess
-
Enable side-car injection by running
create.shscript from https://github.com/aws/aws-app-mesh-examples/tree/master/examples/apps/djapp/2_create_injector. You need to changeca-bundle.shand changeMESH_NAMEtogreeting-app. -
Create
prodnamespace:kubectl create namespace prod
-
Label prod namespace:
kubectl label namespace prod appmesh.k8s.aws/sidecarInjectorWebhook=enabled
-
Create CRDs:
kubectl create -f https://raw.githubusercontent.com/aws/aws-app-mesh-examples/master/examples/apps/djapp/3_add_crds/mesh-definition.yaml
kubectl create -f https://raw.githubusercontent.com/aws/aws-app-mesh-examples/master/examples/apps/djapp/3_add_crds/virtual-node-definition.yaml
kubectl create -f https://raw.githubusercontent.com/aws/aws-app-mesh-examples/master/examples/apps/djapp/3_add_crds/virtual-service-definition.yaml
kubectl create -f https://raw.githubusercontent.com/aws/aws-app-mesh-examples/master/examples/apps/djapp/3_add_crds/controller-deployment.yaml
-
Create a Mesh:
kubectl create -f mesh.yaml
-
Create Virtual Nodes:
kubectl create -f virtualnodes.yaml
-
Create a Virtual Services:
kubectl create -f virtualservice.yaml
-
Create deployments:
kubectl create -f app-hello-howdy.yaml
-
Create services:
kubectl create -f services.yaml
-
Find the name of the talker pod:
TALKER_POD=$(kubectl get pods \ -nprod -lgreeting=talker \ -o jsonpath='{.items[0].metadata.name}') -
Exec into the talker pod:
kubectl exec -nprod $TALKER_POD -it bash
-
Invoke the mostly-hello service to get back mostly
Helloresponse:while [ 1 ]; do curl http://mostly-hello.prod.svc.cluster.local:8080/hello; echo;done
-
CTRL+Cto break the loop. -
Invoke the mostly-howdy service to get back mostly
Howdyresponse:while [ 1 ]; do curl http://mostly-howdy.prod.svc.cluster.local:8080/hello; echo;done
-
CTRL+Cto break the loop.
Istio is is a layer 4/7 proxy that routes and load balances traffic over HTTP, WebSocket, HTTP/2, gRPC and supports application protocols such as MongoDB and Redis. Istio uses the Envoy proxy to manage all inbound/outbound traffic in the service mesh.
Istio has a wide variety of traffic management features that live outside the application code, such as A/B testing, phased/canary rollouts, failure recovery, circuit breaker, layer 7 routing and policy enforcement (all provided by the Envoy proxy). Istio also supports ACLs, rate limits, quotas, authentication, request tracing and telemetry collection using its Mixer component. The goal of the Istio project is to support traffic management and security of microservices without requiring any changes to the application; it does this by injecting a sidecar into your pod that handles all network communications.
More details at Getting Started with Istio on Amazon EKS.
-
Download Istio:
curl -L https://git.io/getLatestIstio | sh -
cd istio-1.*
-
Include
istio-1.*/bindirectory inPATH -
Install Istio on Amazon EKS:
helm install \
	--wait \
	--name istio \
	--namespace istio-system \
	install/kubernetes/helm/istio \
	--set tracing.enabled=true \
	--set grafana.enabled=true
-
Verify:
kubectl get pods -n istio-system
NAME                                        READY   STATUS    RESTARTS   AGE
grafana-75485f89b9-4lwg5                    1/1     Running   0          1m
istio-citadel-84fb7985bf-4dkcx              1/1     Running   0          1m
istio-egressgateway-bd9fb967d-bsrhz         1/1     Running   0          1m
istio-galley-655c4f9ccd-qwk42               1/1     Running   0          1m
istio-ingressgateway-688865c5f7-zj9db       1/1     Running   0          1m
istio-pilot-6cd69dc444-9qstf                2/2     Running   0          1m
istio-policy-6b9f4697d-g8hc6                2/2     Running   0          1m
istio-sidecar-injector-8975849b4-cnd6l      1/1     Running   0          1m
istio-statsd-prom-bridge-7f44bb5ddb-8r2zx   1/1     Running   0          1m
istio-telemetry-6b5579595f-nlst8            2/2     Running   0          1m
istio-tracing-ff94688bb-2w4wg               1/1     Running   0          1m
prometheus-84bd4b9796-t9kk5                 1/1     Running   0          1m
Check that both Tracing and Grafana add-ons are enabled.
-
Enable side car injection for all pods in
defaultnamespacekubectl label namespace default istio-injection=enabled
-
From the repo’s main directory, deploy the application:
kubectl apply -f manifests/app.yaml
-
Check pods and note that it has two containers (one for the application and one for the sidecar):
kubectl get pods -l app=greeting
NAME                       READY     STATUS    RESTARTS   AGE
greeting-d4f55c7ff-6gz8b   2/2       Running   0          5s
-
Get list of containers in the pod:
kubectl get pods -l app=greeting -o jsonpath={.items[*].spec.containers[*].name} greeting istio-proxy -
Get response:
curl http://$(kubectl get svc/greeting \
	-o jsonpath='{.status.loadBalancer.ingress[0].hostname}')/hello
-
Deploy application with two versions of
greeting, one that returnsHelloand another that returnsHowdy:kubectl delete -f manifests/app.yaml kubectl apply -f manifests/app-hello-howdy.yaml
-
Check the list of pods:
kubectl get pods -l app=greeting
NAME                              READY     STATUS    RESTARTS   AGE
greeting-hello-69cc7684d-7g4bx    2/2       Running   0          1m
greeting-howdy-788b5d4b44-g7pml   2/2       Running   0          1m
-
Access application multipe times to see different response:
for i in {1..10} do curl -q http://$(kubectl get svc/greeting -o jsonpath='{.status.loadBalancer.ingress[0].hostname}')/hello echo done -
Setup an Istio rule to split traffic between 75% to
Helloand 25% toHowdyversion of thegreetingservice:kubectl apply -f manifests/istio/app-rule-75-25.yaml
-
Invoke the service again to see the traffic split between two services.
-
Setup an Istio rule to divert 10% traffic to canary:
kubectl delete -f manifests/istio/app-rule-75-25.yaml
kubectl apply -f manifests/istio/app-canary.yaml
-
Access application multipe times to see ~10% greeting messages with
Howdy:for i in {1..50} do curl -q http://$(kubectl get svc/greeting -o jsonpath='{.status.loadBalancer.ingress[0].hostname}')/hello echo done
Istio is deployed as a sidecar proxy into each of your pods; this means it can see and monitor all the traffic flows between your microservices and generate a graphical representation of your mesh traffic. We’ll use the application you deployed in the previous step to demonstrate this.
By default, tracing is disabled. --set tracing.enabled=true was used during Istio installation to ensure tracing was enabled.
Setup access to the tracing dashboard URL using port-forwarding:
kubectl port-forward \
	-n istio-system \
	pod/$(kubectl get pod \
		-n istio-system \
		-l app=jaeger \
		-o jsonpath='{.items[0].metadata.name}') 16686:16686 &
Access the dashboard at http://localhost:16686, click on Dependencies, DAG.

-
By default, Grafana is disabled.
--set grafana.enabled=truewas used during Istio installation to ensure Grafana was enabled. Alternatively, the Grafana add-on can be installed as:kubectl apply -f install/kubernetes/addons/grafana.yaml
-
Verify:
kubectl get pods -l app=grafana -n istio-system
NAME                       READY     STATUS    RESTARTS   AGE
grafana-75485f89b9-n4skw   1/1       Running   0          10m
-
Forward Istio dashboard using Grafana UI:
kubectl -n istio-system \ port-forward $(kubectl -n istio-system \ get pod -l app=grafana \ -o jsonpath='{.items[0].metadata.name}') 3000:3000 & -
View Istio dashboard http://localhost:3000. Click on
Home,Istio Workload Dashboard. -
Invoke the endpoint:
curl http://$(kubectl get svc/greeting \
	-o jsonpath='{.status.loadBalancer.ingress[0].hostname}')/hello

Delays and timeouts can be injected in services.
-
Deploy the application:
kubectl delete -f manifests/app.yaml
kubectl apply -f manifests/app-ingress.yaml
-
Add a 5 seconds delay to calls to the service:
kubectl apply -f manifests/istio/greeting-delay.yaml
-
Invoke the service using a 2 seconds timeout:
export INGRESS_HOST=$(kubectl -n istio-system get service istio-ingressgateway -o jsonpath='{.status.loadBalancer.ingress[0].hostname}')
export INGRESS_PORT=$(kubectl -n istio-system get service istio-ingressgateway -o jsonpath='{.spec.ports[?(@.name=="http")].port}')
export GATEWAY_URL=$INGRESS_HOST:$INGRESS_PORT
curl --connect-timeout 2 http://$GATEWAY_URL/resources/greeting
The service will timeout in 2 seconds.
kube-monkey is an implementation of Netflix’s Chaos Monkey for Kubernetes clusters. It randomly deletes Kubernetes pods in the cluster encouraging and validating the development of failure-resilient services.
-
Create kube-monkey configuration:
kubectl apply -f manifests/kubemonkey/kube-monkey-configmap.yaml
-
Run kube-monkey:
kubectl apply -f manifests/kubemonkey/kube-monkey-deployment.yaml
-
Deploy an app that opts-in for pod deletion:
kubectl apply -f manifests/kubemonkey/app-kube-monkey.yaml
This application agrees to kill up to 40% of pods. The schedule of deletion is defined by kube-monkey configuration and is defined to be between 10am and 4pm on weekdays.
Skaffold is a command line utility that facilitates continuous development for Kubernetes applications. With Skaffold, you can iterate on your application source code locally then deploy it to a remote Kubernetes cluster.
-
Check context:
kubectl config get-contexts CURRENT NAME CLUSTER AUTHINFO NAMESPACE arun@eks-gpu.us-west-2.eksctl.io eks-gpu.us-west-2.eksctl.io arun@eks-gpu.us-west-2.eksctl.io * arun@myeks.us-east-1.eksctl.io myeks.us-east-1.eksctl.io arun@myeks.us-east-1.eksctl.io docker-for-desktop docker-for-desktop-cluster docker-for-desktop -
Change to use local Kubernetes cluster:
kubectl config use-context docker-for-desktop
-
Download Skaffold:
curl -Lo skaffold https://storage.googleapis.com/skaffold/releases/latest/skaffold-darwin-amd64 \
	&& chmod +x skaffold
-
Open http://localhost:8080/resources/greeting in browser. This will show the page is not available.
-
Run Skaffold in the application directory:
cd app
skaffold dev
-
Refresh the page in browser to see the output.
Complete detailed instructions are available at https://eksworkshop.com/codepipeline/.
-
Create an IAM role and add an in-line policy that will allow the CodeBuild stage to interact with the EKS cluster:
ACCOUNT_ID=`aws sts get-caller-identity --query Account --output text` TRUST="{ \"Version\": \"2012-10-17\", \"Statement\": [ { \"Effect\": \"Allow\", \"Principal\": { \"AWS\": \"arn:aws:iam::${ACCOUNT_ID}:root\" }, \"Action\": \"sts:AssumeRole\" } ] }" echo '{ "Version": "2012-10-17", "Statement": [ { "Effect": "Allow", "Action": "eks:Describe*", "Resource": "*" } ] }' > /tmp/iam-role-policy aws iam create-role --role-name EksWorkshopCodeBuildKubectlRole --assume-role-policy-document "$TRUST" --output text --query 'Role.Arn' aws iam put-role-policy --role-name EksWorkshopCodeBuildKubectlRole --policy-name eks-describe --policy-document file:///tmp/iam-role-policy -
Add this IAM role to aws-auth ConfigMap for the EKS cluster:
ROLE="    - rolearn: arn:aws:iam::$ACCOUNT_ID:role/EksWorkshopCodeBuildKubectlRole\n      username: build\n      groups:\n        - system:masters"
kubectl get -n kube-system configmap/aws-auth -o yaml | awk "/mapRoles: \|/{print;print \"$ROLE\";next}1" > /tmp/aws-auth-patch.yml
kubectl patch configmap/aws-auth -n kube-system --patch "$(cat /tmp/aws-auth-patch.yml)"
-
Fork the repo https://github.com/aws-samples/kubernetes-for-java-developers
-
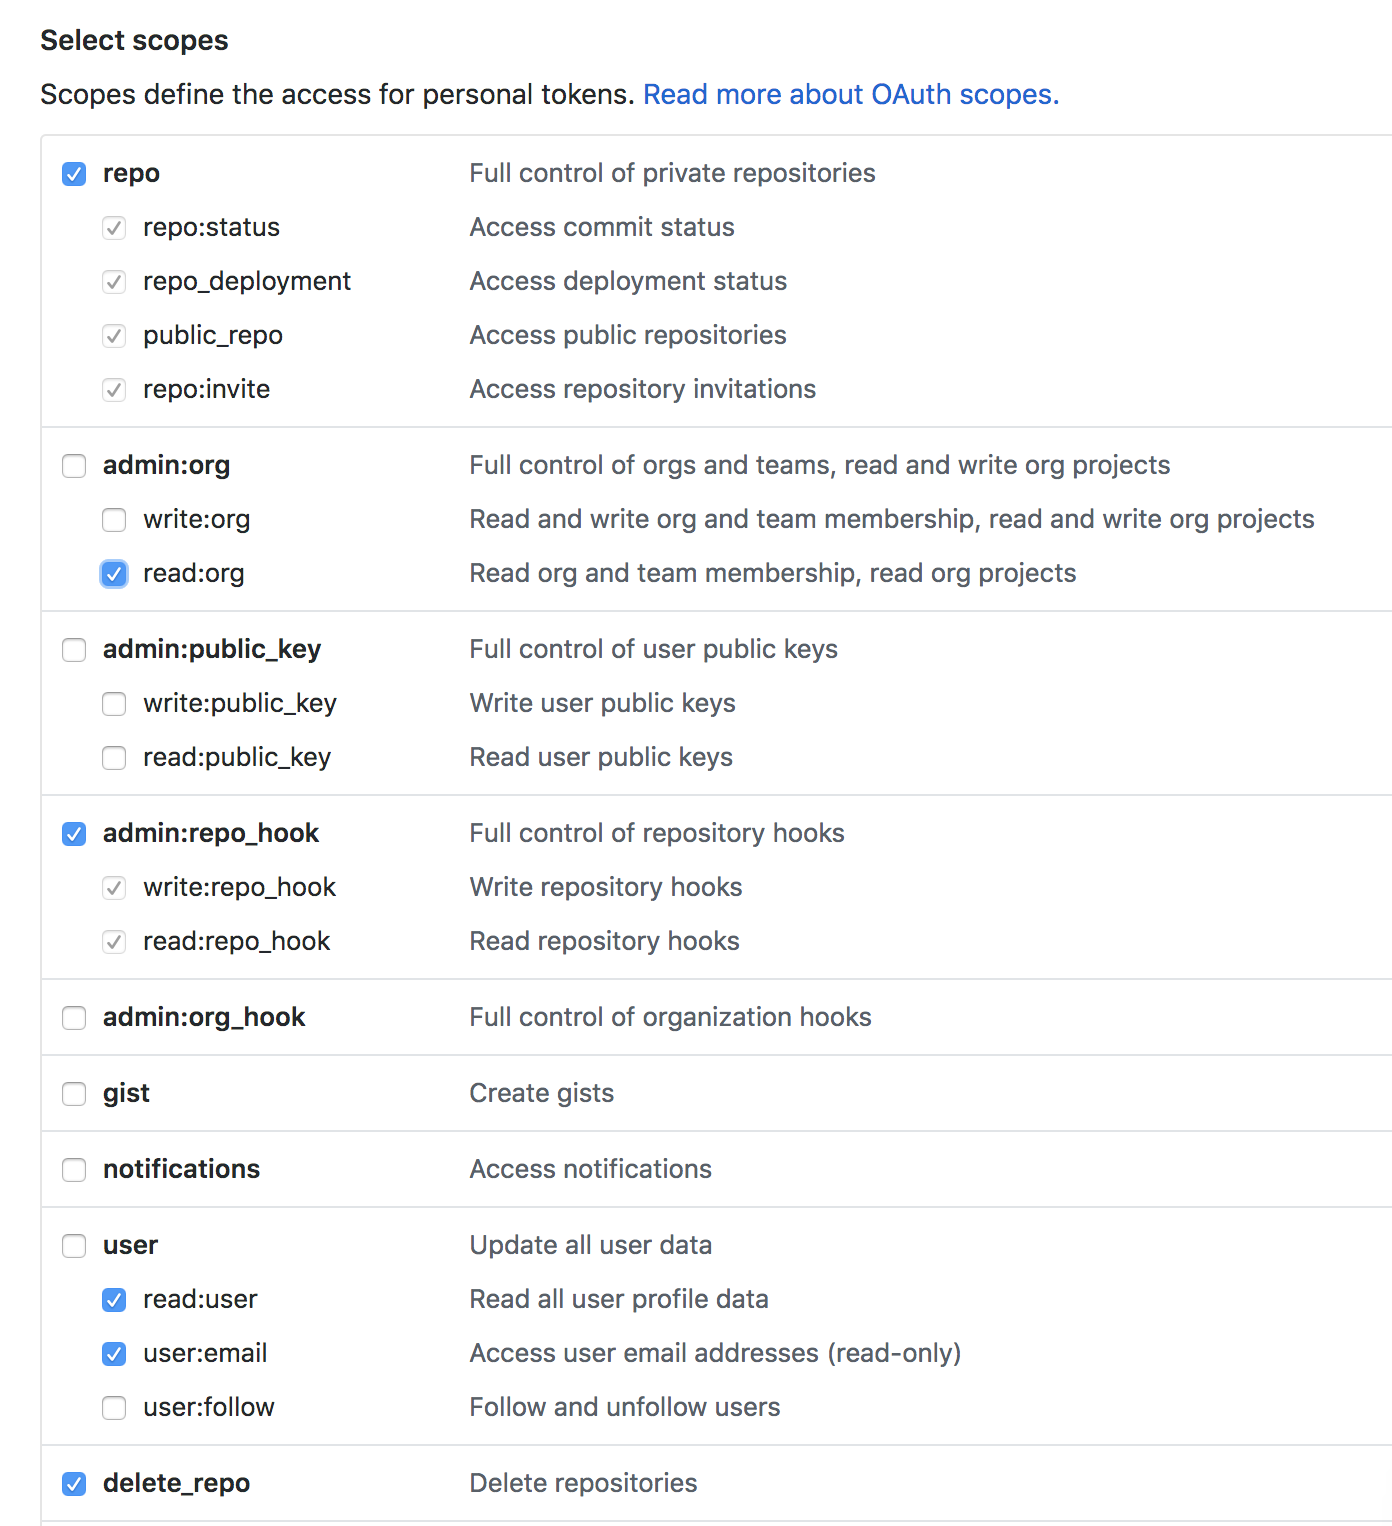
Create a new GitHub token https://github.com/settings/tokens/new, select
repoas the scope, click onGenerate Tokento generate the token. Copy the generated token. -
Specify the correct values for
GitHubUser,GitHubToken,GitSourceRepoandEKS cluster name. Change the branch if you need to: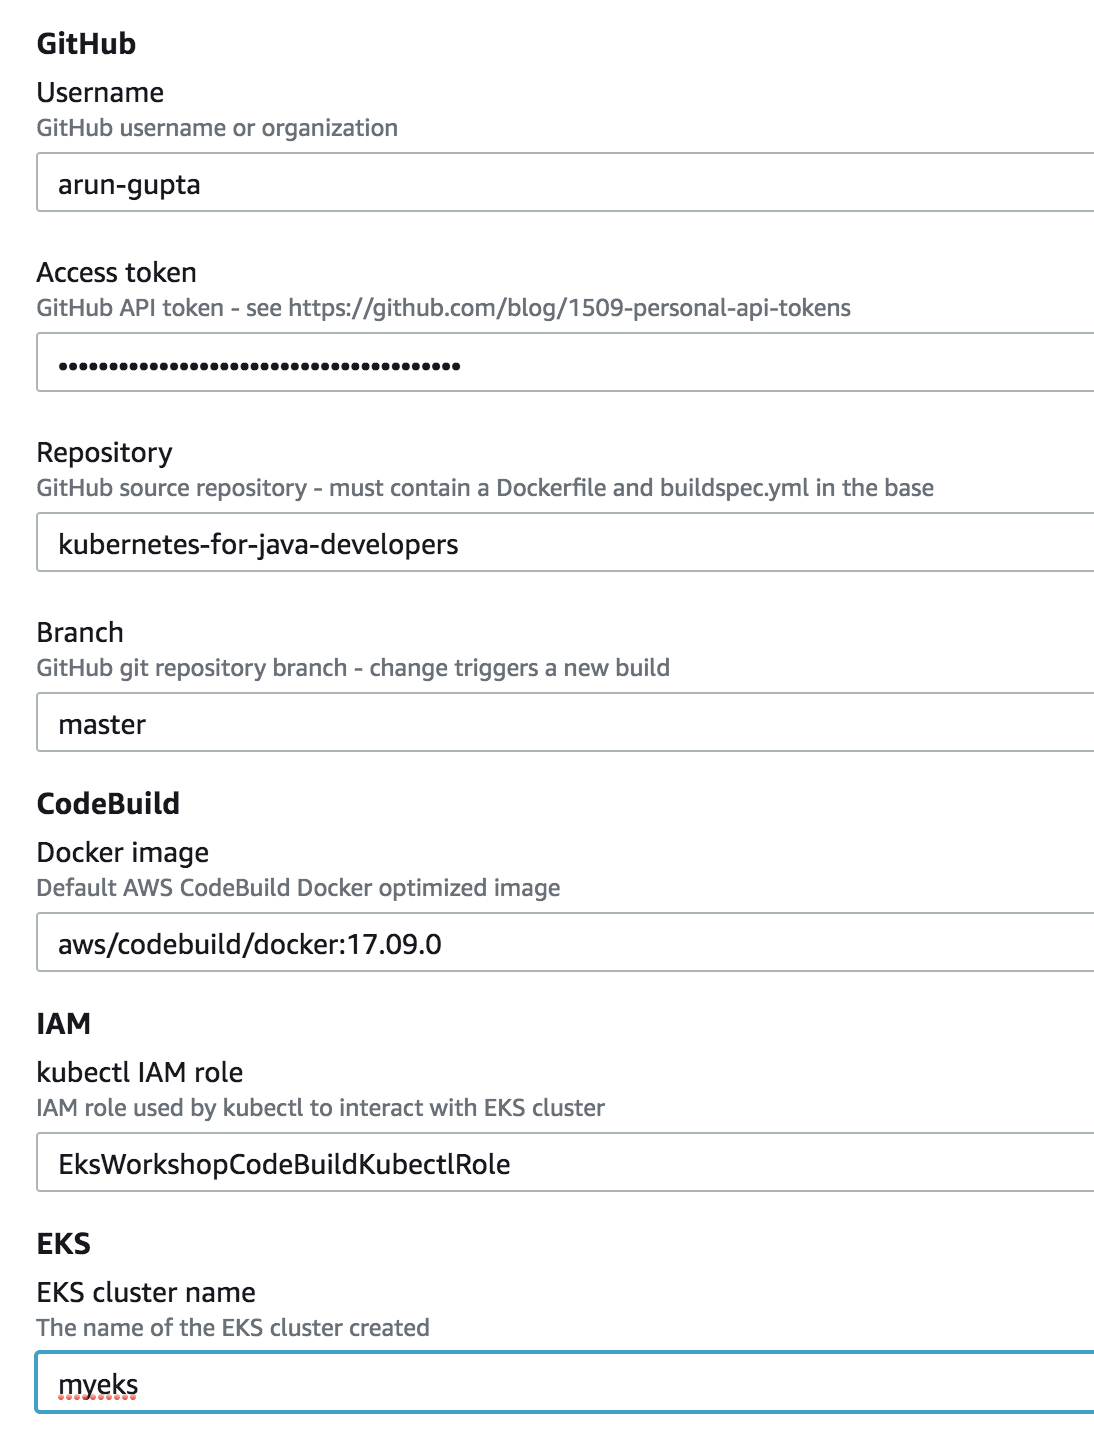
Click on
Create stackto create the resources.

-
Once the stack creation is complete, open CodePipeline in the AWS Console.
-
Select the pipeline and wait for the pipeline status to complete:
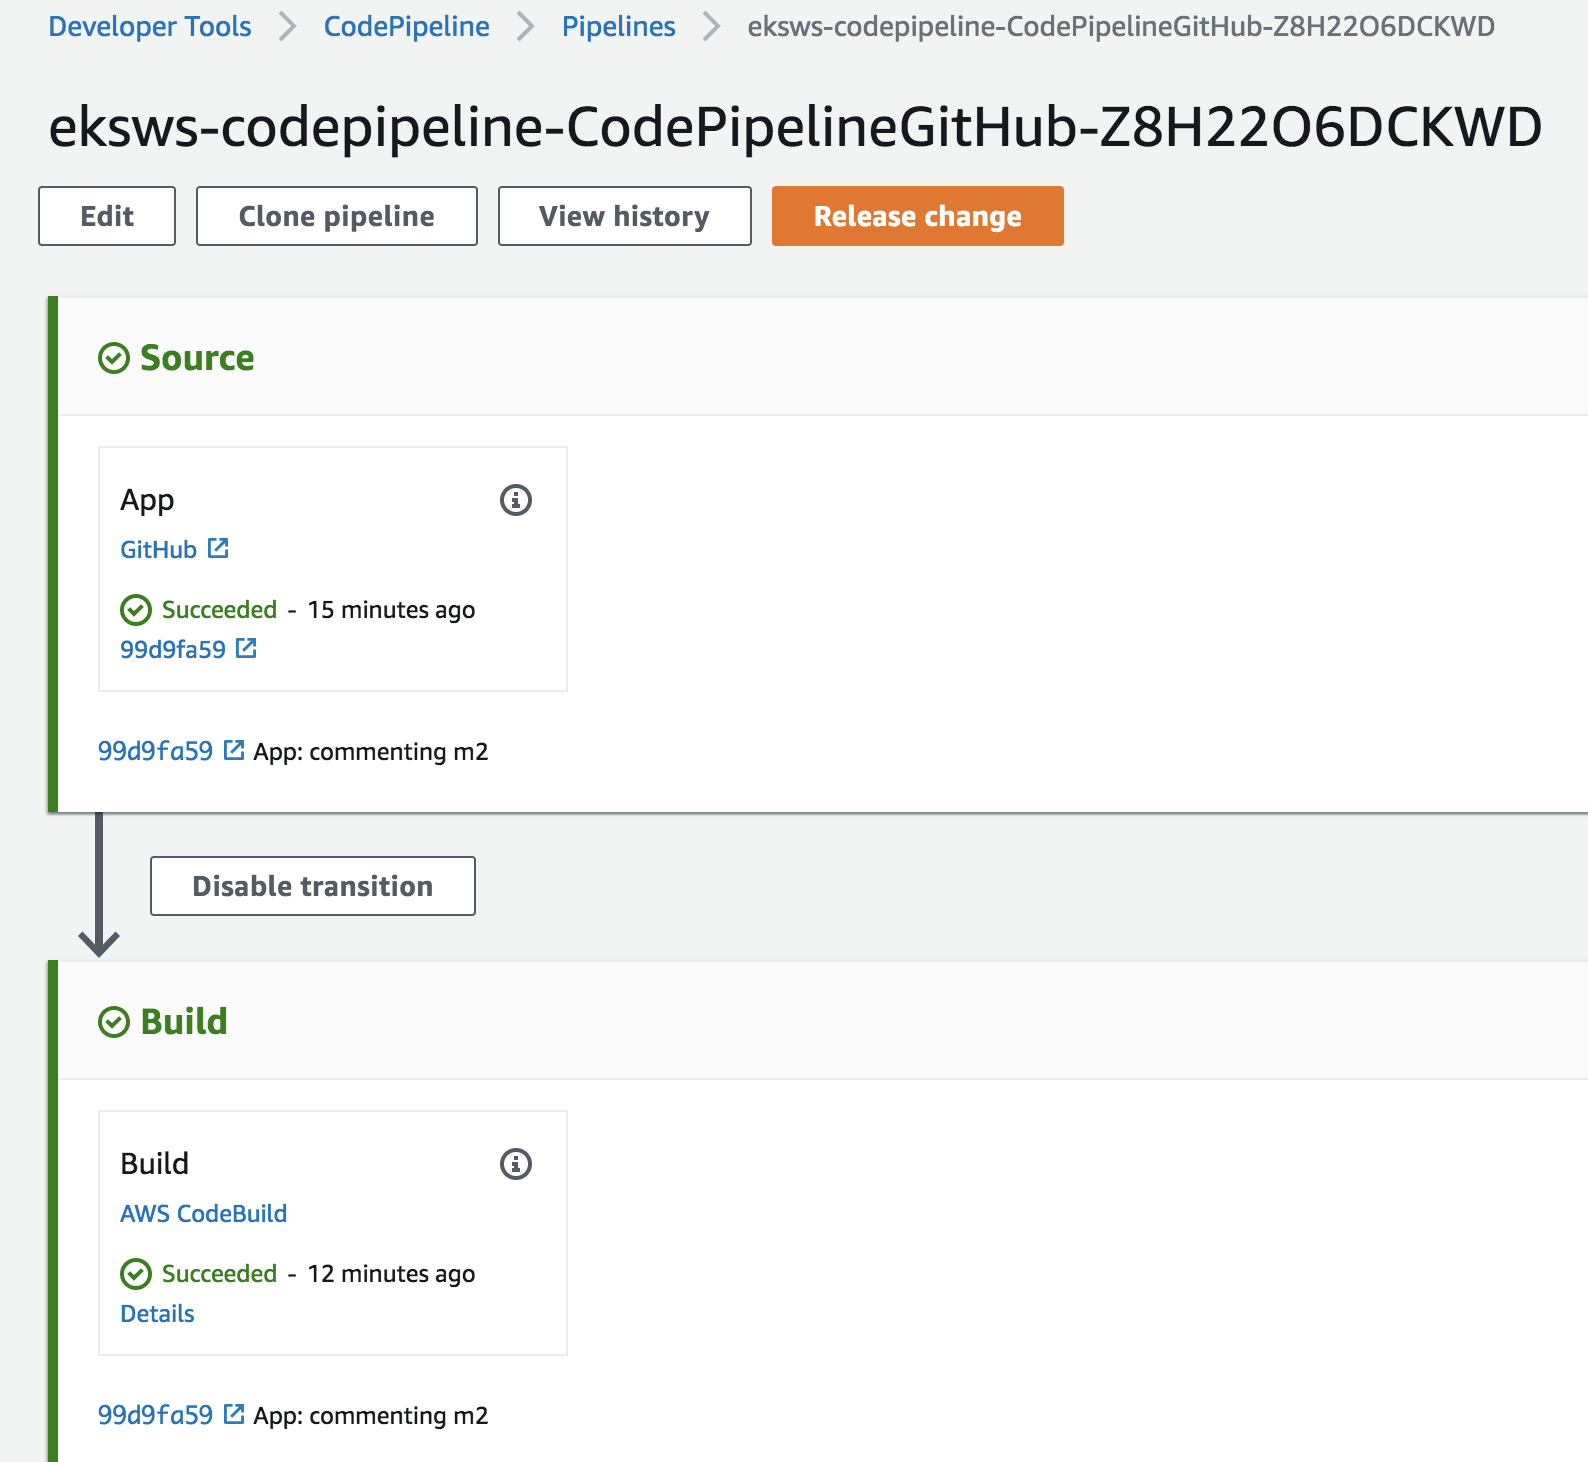
-
Access the service:
curl http://$(kubectl get svc/greeting -n default \
	-o jsonpath='{.status.loadBalancer.ingress[0].hostname}'):8080/hello

-
Install
jxCLI:brew tap jenkins-x/jx brew install jx
-
Create a new GitHub token with the following scope:
-
Install Jenkins X on Amazon EKS:
jx install --provider=eks --git-username arun-gupta --git-api-token GITHUB_TOKEN --batch-mode
Log shows complete run of the command.
-
Use
jx importto import a project. NeedDockerfileand maven application in the root directory.
