Pulse is a browser-based, non-contact heartrate detection application. It can derive a heartrate in thirty seconds or less, requiring only a browser and a webcam. Based on recent research in photoplethysmography and signal processing, the heartbeat is derived from minuscule changes in pixels over time.
Pulse is based on techniques outlined in "Non-contact, automated cardiac pulse measurements using video imaging and blind source separation" by Poh, et al (2010) and work by @thearn with OpenCV and Python (webcam-pulse-detector).
Pulse works because changes in blood volume in the face during the cardiac cycle modify the amount of ambient light reflected by the blood vessels. This change in brightness can be picked up as a periodic signal by a webcam. It is most prominent in the green channel, but using independent component analysis (ICA), an even more prominent signal can be extracted from a combination of the red, blue, and green channels.
Click through for more detailed explanations of the process and technology.

recommended to use a virtual environment. If that's not your style-- the dependencies are in requirements.txt
virtualenv env
source ./env/bin/activate
pip install -r requirements.txt
I had some issues with NumPy installing most recently on OSX 10.9, suppressing clang errors helped:
export CFLAGS=-Qunused-arguments
export CPPFLAGS=-Qunused-arguments
./deploy.sh
Pulse will be running at http://localhost:8000
Facial recognition, pixel manipulation, and some frequency extraction are done in Javascript, and there is a Python backend for Independent Component Analysis (JADE algorithm) and Fast Fourier Transform. This project runs on Javascript, HTML5 Canvas, and WebRTC, Python ( & NumPy), D3js, Rickshaw, with a splash of Flask, web sockets, and Jinja.
Pulse brings in the webcam from the user with getUserMedia and draws it on the canvas at 15 frames a second. It then looks for a face and begins tracking the head with headtrackr.js (uses the Viola-Jones algorithm). A region of interest (ROI) is selected from the forehead hased on the tracked head area. For each frame, the red, blue, and green values for the ROI are extracted from the canvas and averaged for the ROI. This average value for each channel is put into a time series array and sent via websocket (flask_sockets) to a python server.
On the server the data is normalized and run though independent component analysis (JADE algorithm) to isolate the heartbeat from the three signals. Since the order of the independent components is arbitrary, using NumPy a Fast Fourier Transform is applied to each one and the resulting spectrum is filtered by the power density ratio. The component with the highest ratio is selected as the most likely to contain a heartbeat and passed back to the browser via the websocket.
This happens fifteen times a second, but back on the browser, the heartrate is calculated from this information once a second.
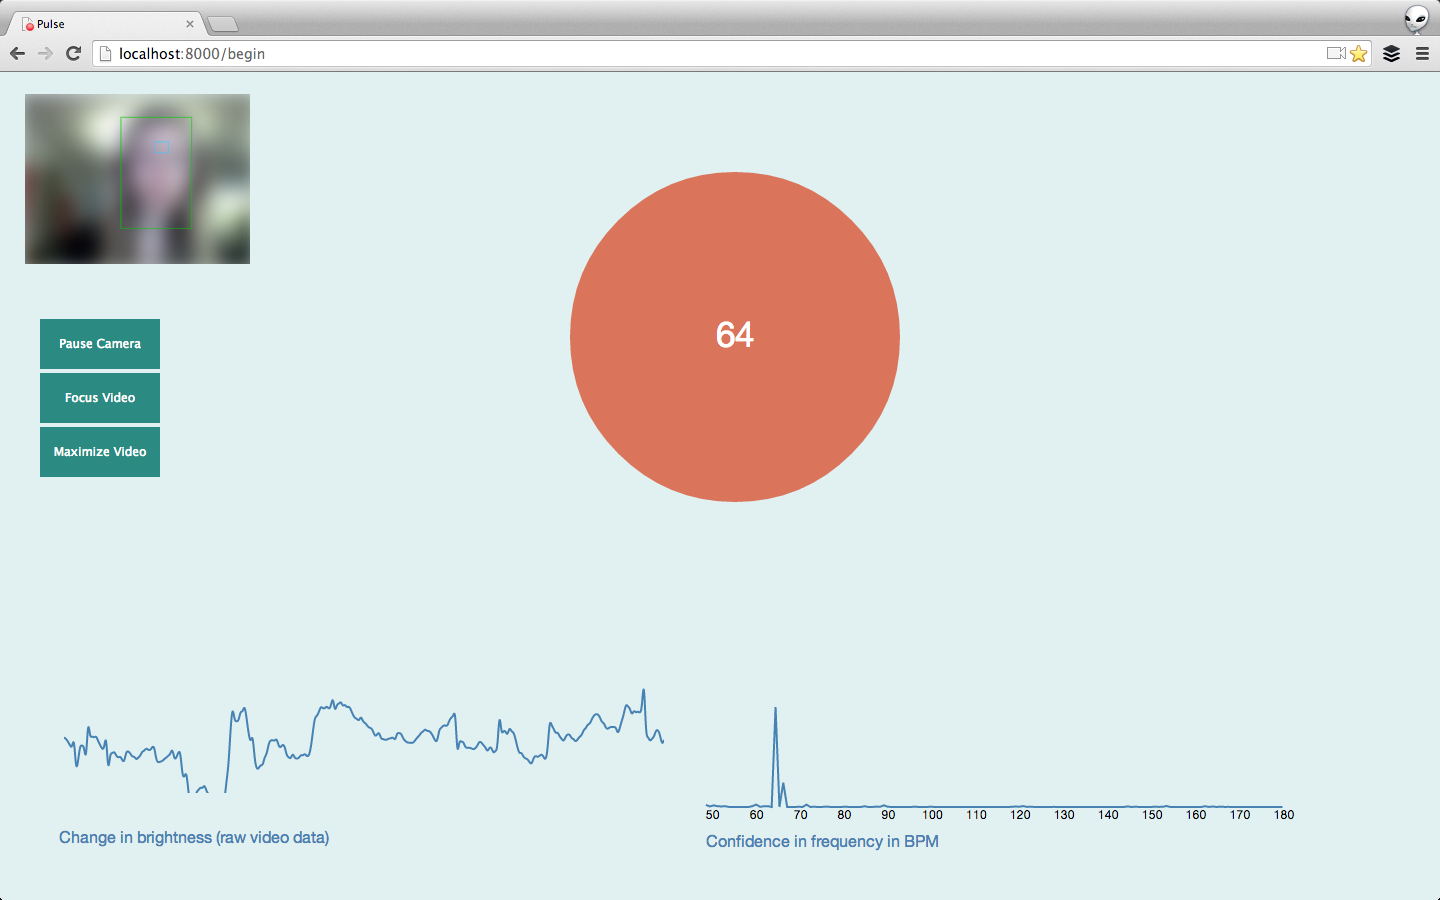
The data is filtered between 0.8 - 3.0 Hz (48 - 180 BPM), and the frequency bins calculated to determine which frequency in the FFT spectrum has the greatest power. This frequency at the greatest power is assumed to be the frequency of the heartrate and is multiplied by 60. This is the number that is printed to the screen within the pulsing circle.
An average of the previous five calculated heartbeats (over five seconds) is taken and it is at that frequency that the circle pulses.
The graph on the left of the screen (built with Rickshaw) is the raw feed of data from the forehead and represents changes in brightness in the green channel (where the photoplethysmographic signal is strongest) over time.
The graph on the right (build with D3) titled "Confidence in frequency in BPM" is the result of the FFT function (confidence) graphed against the frequency bins represented in that result (frequency). The higher the peak, the more likely the heartbeat is at that frequency. In the graph you can see periodic noise, but also a very satisfying "settling" as the program finds a heartrate and stays there.
####(camera.js) The meat of the program is here. It intitializes camera, canvas, and headtracking and extracts the RGB channels from the ROI. It averages them and sends them to the Python server, and when the data is returned to the browser, it uses functions from (mathmatical.js) to filter and extract frequencies. It also initializes and times the graphing of the final data.
####(mathmatical.js) Some functions for signal processing and math used by (camera.js).
####(model.py) Data is normalized, run through ICA (jade.py) and FFT and filtered by the power density ratio.
####Pulse is supported by:
Headtrackr.js is currently doing the heavy lifting for the facetracking.
underscore.js is helping with some of the utilities needed for computation.