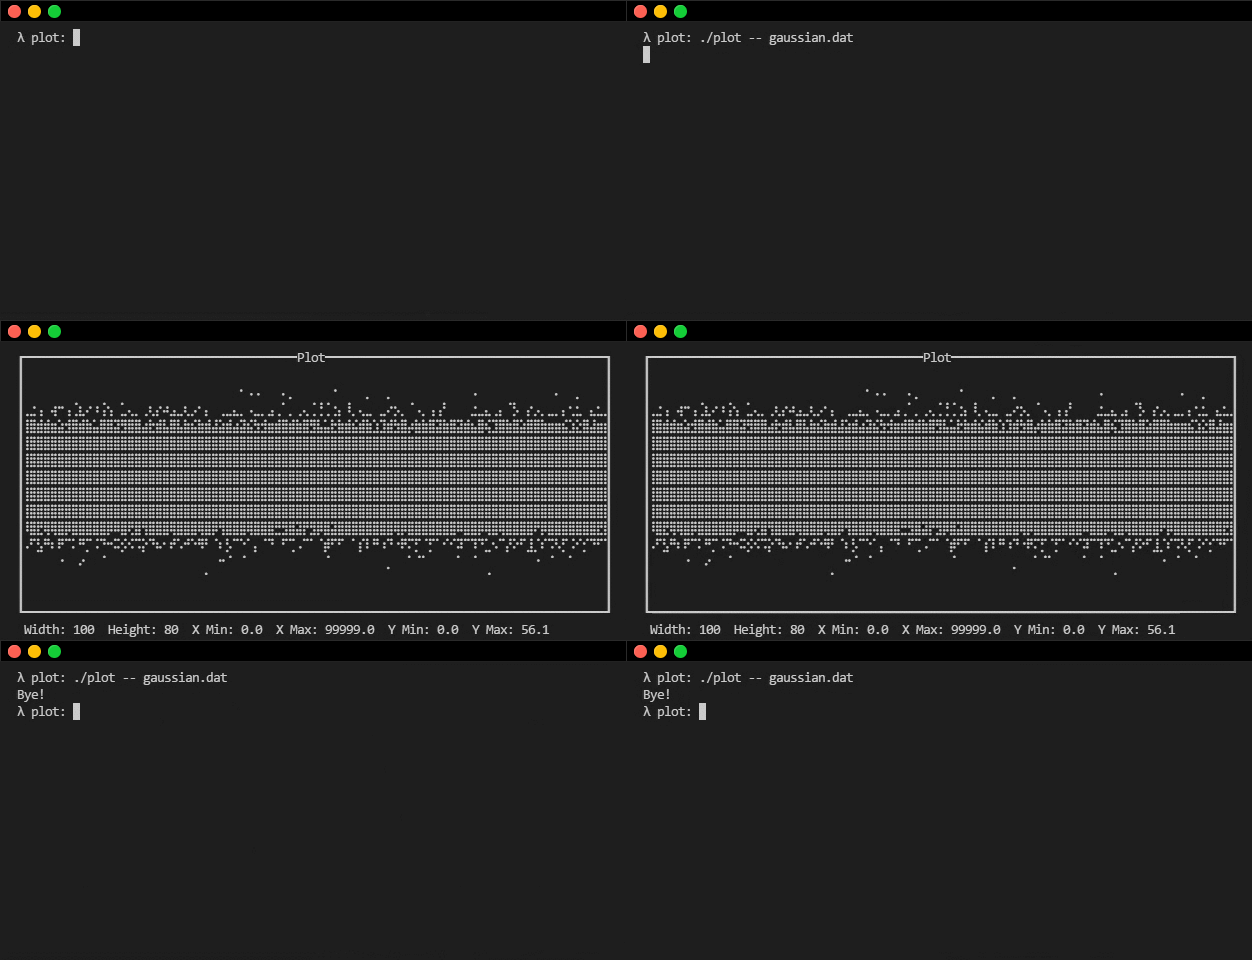
A simple tool for plotting data in the terminal
This doesn't work in Windows.
Install Stack
Make sure you have terminfo installed on the system, eg. on Alpine apk add ncurses-terminfo.
stack build
stack install
stack test
stack bench --ba "--output bench.html"
set -e; for i in {0..100}; do echo "$((-30 + $RANDOM%60))"; done | plot
plot -f <(set -e; for i in {0..100}; do echo "$((-30 + $RANDOM%60))"; done)
plot -f data.txt
Press Q to quit.
Press T to toggle Y-axis ticks
You can switch between modes with:
- A - area plot
- B - bar plot
- H - histogram
- P - points
