- Big picture
- Tech stack
- Getting started
- File structure
- More instructions
- Deploying to Heroku
- Example: Data visualization
- Example: Machine learning
Here's a template with starter code to deploy an API for your machine learning model and data visualizations. You're encouraged (but not required) to use this template for your Build Week.
You can deploy on Heroku in 10 minutes. Here's the template deployed as-is: https://ds-bw-test.herokuapp.com/
This diagram shows two different ways to use frameworks like Flask. Both ways are good! The first way is what you learned in DS Unit 3. The second way is more common in Build Weeks & Labs.

Instead of Flask, we'll use FastAPI. It's similar, but faster, with automatic interactive docs. For more comparison, see FastAPI for Flask Users.
You'll build and deploy a Data Science API. You'll work cross-functionally with your Web teammates to connect your API to a full-stack web app!

- FastAPI: Web framework. Like Flask, but faster, with automatic interactive docs.
- Flake8: Linter, enforces PEP8 style guide.
- Heroku: Platform as a service, hosts your API.
- Pipenv: Reproducible virtual environment, manages dependencies.
- Plotly: Visualization library, for Python & JavaScript.
- Pytest: Testing framework, runs your unit tests.
Create a new repository from this template.
Clone the repo
git clone https://github.com/YOUR-GITHUB-USERNAME/YOUR-REPO-NAME.git

cd YOUR-REPO-NAME
Install dependencies
pipenv install --dev
Activate the virtual environment
pipenv shell
Launch the app
uvicorn app.main:app --reload
Go to localhost:8000 in your browser.

You'll see your API documentation:
- Your app's title, "DS API"
- Your description, "Lorem ipsum"
- An endpoint for POST requests,
/predict - An endpoint for GET requests,
/vis/{statecode}
Click the /predict endpoint's green button.

You'll see the endpoint's documentation, including:
- Your function's docstring, """Make random baseline predictions for classification problem."""
- Request body example, as JSON (like a Python dictionary)
- A button, "Try it out"
Click the "Try it out" button.

The request body becomes editable.
Click the "Execute" button. Then scroll down.

You'll see the server response, including:
- Code 200, which means the request was successful.
- The response body, as JSON, with random baseline predictions for a classification problem.
Your job is to replace these random predictions with real predictions from your model. Use this starter code and documentation to deploy your model as an API!
.
└── app
    ├── __init__.py
    ├── main.py
    ├── api
    │   ├── __init__.py
    │   ├── predict.py
    │   └── viz.py
    └── tests
        ├── __init__.py
        ├── test_main.py
        ├── test_predict.py
        └── test_viz.py
app/main.py is where you edit your app's title and description, which are displayed at the top of the your automatically generated documentation. This file also configures "Cross-Origin Resource Sharing", which you shouldn't need to edit.
app/api/predict.py defines the Machine Learning endpoint. /predict accepts POST requests and responds with random predictions. In a notebook, train your model and pickle it. Then in this source code file, unpickle your model and edit the predict function to return real predictions.
When your API receives a POST request, FastAPI automatically parses and validates the request body JSON, using the Item class attributes and functions. Edit this class so it's consistent with the column names and types from your training dataframe.
- FastAPI docs - Request Body
- FastAPI docs - Field additional arguments
- calmcode.io video - FastAPI - Json
- calmcode.io video - FastAPI - Type Validation
- pydantic docs - Validators
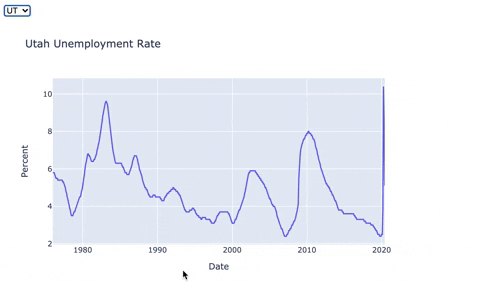
app/api/viz.py defines the Visualization endpoint. Currently /viz/{statecode} accepts GET requests where {statecode} is a 2 character US state postal code, and responds with a Plotly figure of the state's unemployment rate, as a JSON string. Create your own Plotly visualizations in notebooks. Then add your code to this source code file. Your web developer teammates can use react-plotly.js to show the visualizations.
- Lambda School docs - Data visualization with React & Plotly. This is the code for the example above. Your web teammates can reuse this as-is.
- Plotly docs
app/tests/test_*.py is where you edit your pytest unit tests.
Activate the virtual environment
pipenv shell
Install additional packages
pipenv install PYPI-PACKAGE-NAME
Launch a Jupyter notebook
jupyter notebook
Run tests
pytest
Run linter
flake8
Prepare Heroku
heroku login

heroku create YOUR-APP-NAME-GOES-HERE

heroku git:remote -a YOUR-APP-NAME-GOES-HERE
Deploy to Heroku
git add --all

git add --force Pipfile.lock

git commit -m "Deploy to Heroku"

git push heroku main:master

heroku open
(If you get a Locking failed! error when deploying to Heroku or running pipenv install then delete Pipfile.lock and try again, without git add --force Pipfile.lock)
Deactivate the virtual environment
exit
Teams are recommended to use Plotly, a popular visualization library for both Python & JavaScript.
Follow the getting started instructions.
Edit app/main.py to add your API title and description.
app = FastAPI(
    title='World Metrics DS API',
    description='Visualize world metrics from Gapminder data',
    version='0.1',
    docs_url='/',
)
Prototype your visualization in a notebook.
import plotly.express as px

dataframe = px.data.gapminder().rename(columns={
    'year': 'Year',
    'lifeExp': 'Life Expectancy',
    'pop': 'Population',
    'gdpPercap': 'GDP Per Capita'
})

country = 'United States'
metric = 'Population'
subset = dataframe[dataframe.country == country]
fig = px.line(subset, x='Year', y=metric, title=f'{metric} in {country}')
fig.show()
Define a function for your visualization. End with return fig.to_json()
Then edit app/api/viz.py to add your code.
import plotly.express as px

dataframe = px.data.gapminder().rename(columns={
    'year': 'Year',
    'lifeExp': 'Life Expectancy',
    'pop': 'Population',
    'gdpPercap': 'GDP Per Capita'
})

@router.get('/worldviz')
async def worldviz(metric, country):
    """
    Visualize world metrics from Gapminder data

    ### Query Parameters
    - `metric`: 'Life Expectancy', 'Population', or 'GDP Per Capita'
    - `country`: [country name](https://www.gapminder.org/data/geo/), case sensitive

    ### Response
    JSON string to render with react-plotly.js
    """
    subset = dataframe[dataframe.country == country]
    fig = px.line(subset, x='Year', y=metric, title=f'{metric} in {country}')
    return fig.to_json()
Test locally, then deploy to Heroku.
Your web teammates will re-use the data viz code & docs in our labs-spa-starter repo. The web app will call the DS API to get the data, then use react-plotly.js to render the visualization.
- Example gallery
- Setting Graph Size
- Styling Plotly Express Figures
- Text and font styling
- Theming and templates
Follow the getting started instructions.
Edit app/main.py to add your API title and description.
app = FastAPI(
    title='House Price DS API',
    description='Predict house prices in California',
    version='0.1',
    docs_url='/',
)
Edit app/api/predict.py to add a docstring for your predict function and return a naive baseline.
@router.post('/predict')
async def predict(item: Item):
    """Predict house prices in California."""
    y_pred = 200000
    return {'predicted_price': y_pred}
In a notebook, explore your data. Make an educated guess of what features you'll use.
import pandas as pd
from sklearn.datasets import fetch_california_housing

# Load data
california = fetch_california_housing()
print(california.DESCR)
X = pd.DataFrame(california.data, columns=california.feature_names)
y = california.target

# Rename columns
X.columns = X.columns.str.lower()
X = X.rename(columns={'avebedrms': 'bedrooms', 'averooms': 'total_rooms'})

# Explore descriptive stats
X.describe()
# Use these 3 features
features = ['bedrooms', 'total_rooms', 'house_age']Edit the class in app/api/predict.py to use your features.
class House(BaseModel):
    """Use this data model to parse the request body JSON."""
    bedrooms: int
    total_rooms: float
    house_age: float

    def to_df(self):
        """Convert pydantic object to pandas dataframe with 1 row."""
        return pd.DataFrame([dict(self)])

@router.post('/predict')
async def predict(house: House):
    """Predict house prices in California."""
    X_new = house.to_df()
    y_pred = 200000
    return {'predicted_price': y_pred}
Test locally, then deploy to Heroku with your work-in-progress. Get to this point by the middle of Build Week. (By Wednesday lunch for full-time cohorts. By end of week one for part-time cohorts.) Now your web teammates can make POST requests to your API endpoint.
In a notebook, train your pipeline and pickle it. See these docs:
Get version numbers for every package you used in your pipeline. Install the exact versions of these packages in your virtual environment.
Edit app/api/predict.py to unpickle your model and use it in your predict function.
Now you are ready to re-deploy! 🚀