!pip install beautifulsoup4
!pip install selenium

import pandas as pd
import numpy as np
import requests
import re
import csv
import os
import matplotlib.pyplot as plt
import seaborn as sb

from bs4 import BeautifulSoup

from time import sleep
import warnings
warnings.filterwarnings('ignore')


from sklearn.preprocessing import normalize
import scipy.cluster.hierarchy as sch
from scipy import zeros as sci_zeros
from scipy.spatial.distance import euclidean
from scipy.cluster.hierarchy import dendrogram
from sklearn.cluster import AgglomerativeClustering

%matplotlib inlinekaggle_data = pd.read_csv('multiple_choice_responses.csv')
kaggle_data.head().dataframe tbody tr th {
vertical-align: top;
}
.dataframe thead th {
text-align: right;
}
| Time from Start to Finish (seconds) | Q1 | Q2 | Q2_OTHER_TEXT | Q3 | Q4 | Q5 | Q5_OTHER_TEXT | Q6 | Q7 | ... | Q34_Part_4 | Q34_Part_5 | Q34_Part_6 | Q34_Part_7 | Q34_Part_8 | Q34_Part_9 | Q34_Part_10 | Q34_Part_11 | Q34_Part_12 | Q34_OTHER_TEXT | |
|---|---|---|---|---|---|---|---|---|---|---|---|---|---|---|---|---|---|---|---|---|---|
| 0 | Duration (in seconds) | What is your age (# years)? | What is your gender? - Selected Choice | What is your gender? - Prefer to self-describe... | In which country do you currently reside? | What is the highest level of formal education ... | Select the title most similar to your current ... | Select the title most similar to your current ... | What is the size of the company where you are ... | Approximately how many individuals are respons... | ... | Which of the following relational database pro... | Which of the following relational database pro... | Which of the following relational database pro... | Which of the following relational database pro... | Which of the following relational database pro... | Which of the following relational database pro... | Which of the following relational database pro... | Which of the following relational database pro... | Which of the following relational database pro... | Which of the following relational database pro... |
| 1 | 510 | 22-24 | Male | -1 | France | Master’s degree | Software Engineer | -1 | 1000-9,999 employees | 0 | ... | NaN | NaN | NaN | NaN | NaN | NaN | NaN | NaN | NaN | -1 |
| 2 | 423 | 40-44 | Male | -1 | India | Professional degree | Software Engineer | -1 | > 10,000 employees | 20+ | ... | NaN | NaN | NaN | NaN | NaN | NaN | NaN | NaN | NaN | -1 |
| 3 | 83 | 55-59 | Female | -1 | Germany | Professional degree | NaN | -1 | NaN | NaN | ... | NaN | NaN | NaN | NaN | NaN | NaN | NaN | NaN | NaN | -1 |
| 4 | 391 | 40-44 | Male | -1 | Australia | Master’s degree | Other | 0 | > 10,000 employees | 20+ | ... | NaN | NaN | NaN | NaN | NaN | Azure SQL Database | NaN | NaN | NaN | -1 |
5 rows × 246 columns
# Helper function to turn skills into columns and encode them
def get_skills_df(df):
for col in df.columns.values:
skill = df[pd.notnull(df[col])][col].unique()[0] # get the selected choice for the corresponding col
df.loc[:, col] = df.loc[:, col].map({skill: 1})
skill_name = skill.lower()
while skill_name[0] == " ":
skill_name = skill_name[1:]
while skill_name[-1] == " ":
skill_name = skill_name[:-1]
df.rename(columns={col:skill_name}, inplace=True)
df.fillna(0, inplace=True)
return df# programming languages, Q18 in the dataset (10 options)
languages = kaggle_data[['Q18_Part_1', 'Q18_Part_2', 'Q18_Part_3', 'Q18_Part_4', 'Q18_Part_5', 'Q18_Part_6', 'Q18_Part_7',
'Q18_Part_8', 'Q18_Part_9', 'Q18_Part_10']]
languages.drop([0], inplace=True)
languages = get_skills_df(languages)
# Get Visualization tools used: Q20
viz_tools = kaggle_data[['Q20_Part_1', 'Q20_Part_2', 'Q20_Part_3', 'Q20_Part_4', 'Q20_Part_5', 'Q20_Part_6', 'Q20_Part_7',
'Q20_Part_8', 'Q20_Part_9', 'Q20_Part_10']]
viz_tools.drop([0], inplace=True)
viz_tools = get_skills_df(viz_tools)
# Get ML algorithms used on a regular basis: Q24
ml_algo = kaggle_data[['Q24_Part_1', 'Q24_Part_2', 'Q24_Part_3', 'Q24_Part_4', 'Q24_Part_5', 'Q24_Part_6', 'Q24_Part_7',
'Q24_Part_8', 'Q24_Part_9', 'Q24_Part_10']]
ml_algo.drop([0], inplace=True)
ml_algo = get_skills_df(ml_algo)
# Get ML algorithms used on a regular basis: Q24
ml_algo = kaggle_data[['Q24_Part_1', 'Q24_Part_2', 'Q24_Part_3', 'Q24_Part_4', 'Q24_Part_5', 'Q24_Part_6', 'Q24_Part_7',
'Q24_Part_8', 'Q24_Part_9', 'Q24_Part_10']]
ml_algo.drop([0], inplace=True)
ml_algo = get_skills_df(ml_algo)
# Get Computer Vision methods used on a regular basis
computer_vision = kaggle_data[['Q26_Part_1', 'Q26_Part_2', 'Q26_Part_3', 'Q26_Part_4', 'Q26_Part_5']]
computer_vision.drop([0], inplace=True)
computer_vision = get_skills_df(computer_vision)
# Get NLP methods used on a regular basis
nlp = kaggle_data[['Q27_Part_1', 'Q27_Part_2', 'Q27_Part_3', 'Q27_Part_4']]
nlp.drop([0], inplace=True)
nlp = get_skills_df(nlp)
# Get ML frameworks used: Q28
ml_frameworks = kaggle_data[['Q28_Part_1', 'Q28_Part_2', 'Q28_Part_3', 'Q28_Part_4', 'Q28_Part_5', 'Q28_Part_6', 'Q28_Part_7', 'Q28_Part_8', 'Q28_Part_9', 'Q28_Part_10']]
ml_frameworks.drop([0], inplace=True)
ml_frameworks = get_skills_df(ml_frameworks)
# Get cloud computing platforms used: Q29
cloud_computing = kaggle_data[['Q29_Part_1', 'Q29_Part_2', 'Q29_Part_3', 'Q29_Part_4', 'Q29_Part_5', 'Q29_Part_6',
'Q29_Part_7','Q29_Part_8', 'Q29_Part_9', 'Q29_Part_10']]
cloud_computing.drop([0], inplace=True)
cloud_computing = get_skills_df(cloud_computing)
# Get big data/ analytics products used: Q31
big_data = kaggle_data[['Q31_Part_1', 'Q31_Part_2', 'Q31_Part_3', 'Q31_Part_4', 'Q31_Part_5', 'Q31_Part_6',
'Q31_Part_7','Q31_Part_8', 'Q31_Part_9', 'Q31_Part_10']]
big_data.drop([0], inplace=True)
big_data = get_skills_df(big_data)
# Get ML products used: Q32
ml_products = kaggle_data[['Q32_Part_1', 'Q32_Part_2', 'Q32_Part_3', 'Q32_Part_4', 'Q32_Part_5', 'Q32_Part_6',
'Q32_Part_7','Q32_Part_8', 'Q32_Part_9', 'Q32_Part_10']]
ml_products.drop([0], inplace=True)
ml_products = get_skills_df(ml_products)
# Get database products used: Q34
db_products = kaggle_data[['Q34_Part_1', 'Q34_Part_2', 'Q34_Part_3', 'Q34_Part_4', 'Q34_Part_5', 'Q34_Part_6',
'Q34_Part_7','Q34_Part_8', 'Q34_Part_9', 'Q34_Part_10']]
db_products.drop([0], inplace=True)
db_products = get_skills_df(db_products)
# Get database products used: Q34
db_products = kaggle_data[['Q34_Part_1', 'Q34_Part_2', 'Q34_Part_3', 'Q34_Part_4', 'Q34_Part_5', 'Q34_Part_6',
'Q34_Part_7','Q34_Part_8', 'Q34_Part_9', 'Q34_Part_10']]
db_products.drop([0], inplace=True)
db_products = get_skills_df(db_products)
# Get database products used: Q34
db_products = kaggle_data[['Q34_Part_1', 'Q34_Part_2', 'Q34_Part_3', 'Q34_Part_4', 'Q34_Part_5', 'Q34_Part_6',
'Q34_Part_7','Q34_Part_8', 'Q34_Part_9', 'Q34_Part_10']]
db_products.drop([0], inplace=True)
db_products = get_skills_df(db_products)# Combine all the skills dataframe into one
kaggle_skills = pd.concat([languages, viz_tools, ml_algo, computer_vision, nlp, ml_frameworks, cloud_computing,
big_data, ml_products, db_products], axis=1)
kaggle_skills.head(10)
kaggle_skills = kaggle_skills.rename(columns={'image classification and other general purpose networks (vgg, inception, resnet, resnext, nasnet, efficientnet, etc)': 'image classification', 'general purpose image/video tools (pil, cv2, skimage, etc)': 'image/video tools', 'gradient boosting machines (xgboost, lightgbm, etc)': 'gradient boosting machines', ' google cloud platform (gcp) ': 'gcp'})
kaggle_skills.to_csv('./kaggle_skills.csv', index=True)print(kaggle_skills.columns)Index(['python', 'r', 'sql', 'c', 'c++', 'java', 'javascript', 'typescript',
'bash', 'matlab', 'ggplot / ggplot2', 'matplotlib', 'altair', 'shiny',
'd3.js', 'plotly / plotly express', 'bokeh', 'seaborn', 'geoplotlib',
'leaflet / folium', 'linear or logistic regression',
'decision trees or random forests', 'gradient boosting machines',
'bayesian approaches', 'evolutionary approaches',
'dense neural networks (mlps, etc)', 'convolutional neural networks',
'generative adversarial networks', 'recurrent neural networks',
'transformer networks (bert, gpt-2, etc)', 'image/video tools',
'image segmentation methods (u-net, mask r-cnn, etc)',
'object detection methods (yolov3, retinanet, etc)',
'image classification', 'generative networks (gan, vae, etc)',
'word embeddings/vectors (glove, fasttext, word2vec)',
'encoder-decorder models (seq2seq, vanilla transformers)',
'contextualized embeddings (elmo, cove)',
'transformer language models (gpt-2, bert, xlnet, etc)', 'scikit-learn',
'tensorflow', 'keras', 'randomforest', 'xgboost', 'pytorch', 'caret',
'lightgbm', 'spark mlib', 'fast.ai', 'google cloud platform (gcp)',
'amazon web services (aws)', 'microsoft azure', 'ibm cloud',
'alibaba cloud', 'salesforce cloud', 'oracle cloud', 'sap cloud',
'vmware cloud', 'red hat cloud', 'google bigquery', 'aws redshift',
'databricks', 'aws elastic mapreduce', 'teradata',
'microsoft analysis services', 'google cloud dataflow', 'aws athena',
'aws kinesis', 'google cloud pub/sub', 'sas', 'cloudera',
'azure machine learning studio', 'google cloud machine learning engine',
'google cloud vision', 'google cloud speech-to-text',
'google cloud natural language', 'rapidminer',
'google cloud translation', 'amazon sagemaker', 'mysql', 'postgressql',
'sqlite', 'microsoft sql server', 'oracle database', 'microsoft access',
'aws relational database service', 'aws dynamodb', 'azure sql database',
'google cloud sql'],
dtype='object')
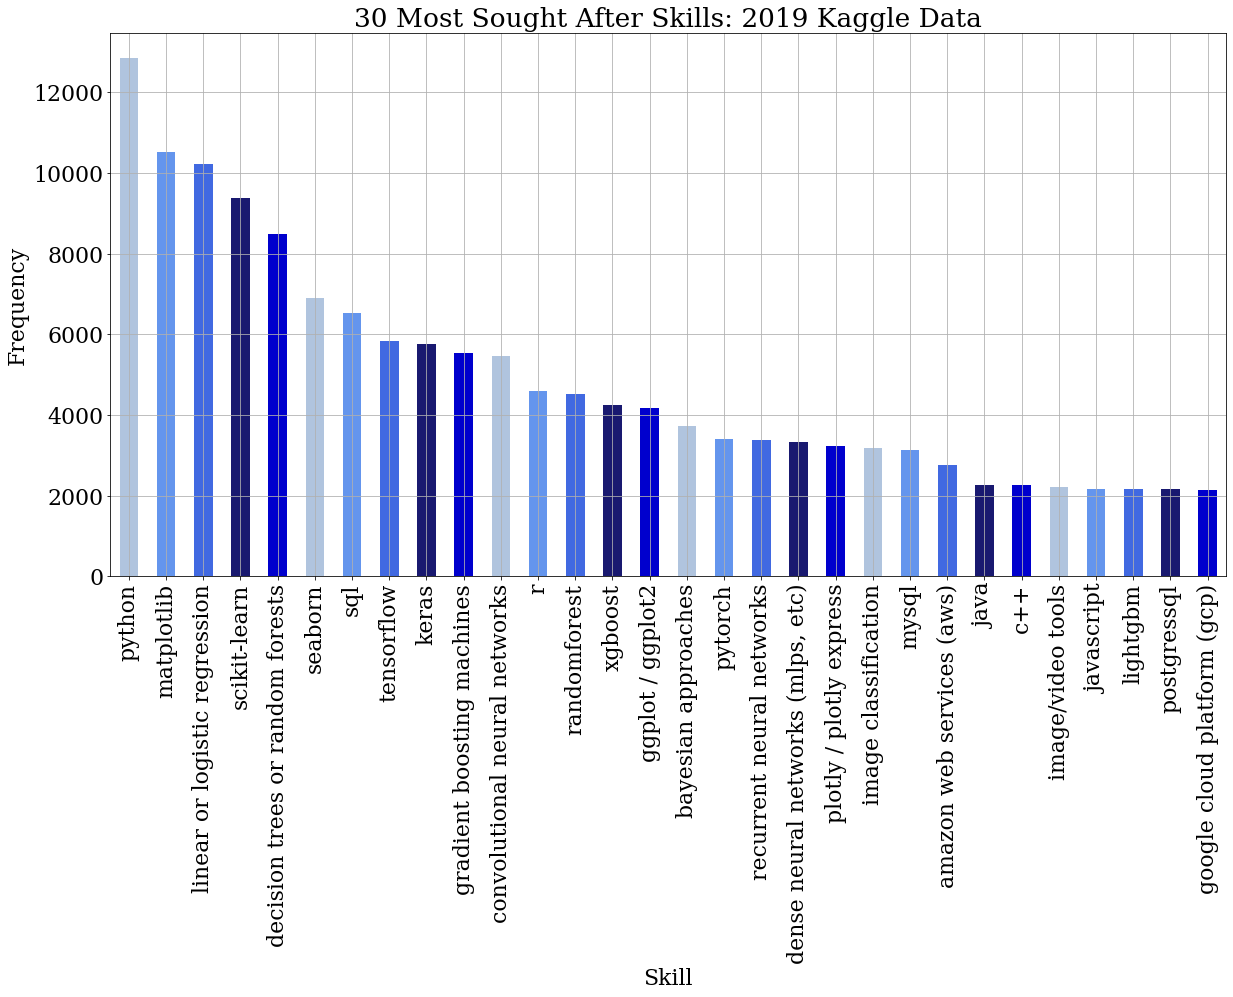
plt.figure(figsize=(20,10))
my_colors = ["lightsteelblue", "cornflowerblue", "royalblue", "midnightblue", "mediumblue"]*10
font = {'font.family' : 'serif',
'font.size' : 22,
'font.weight' : 'normal'}
plt.rcParams.update(font)
ax = kaggle_skills.sum().sort_values(ascending=False)[:30].plot(kind="bar", color=my_colors)
plt.title("30 Most Sought After Skills: 2019 Kaggle Data")
plt.grid(True)
plt.xlabel("Skill")
plt.ylabel("Frequency")
plt.show()# Indeed displays ~10-15 jobs on each page, while each job itself can be identify as a page.
# So we search jobs every 10 pages.
# For 1000+ jobs, we need to go through 100+ pages with 10+ jobs on each page.
pages = list(range(0,1100,10))
def get_indeed_jobs():
job_info = []
for page in pages:
result = requests.get("https://ca.indeed.com/jobs?q=data+analyst%2C+data+scientist&start="+str(page)).text
soup = BeautifulSoup(result, 'lxml')
if soup.find_all(class_ = "result") is None:
return []
for jobs in soup.find_all(class_ = "result"):
try:
position_title = jobs.find('a', class_='jobtitle turnstileLink').text.strip()
except:
position_title = None
try:
employer = jobs.find('span', class_='company').text.strip()
except:
employer = None
try:
location = jobs.find('span', class_='location').text.strip()
except:
location = None
try:
salary = jobs.find('span', class_ = 'salaryText').text.strip()
except:
salary = None
try:
link = base + jobs.find('a').attrs['href']
except:
link = None
job_info.append({
'position_title': position_title,
'employer': employer,
'location': location,
'salary': salary,
'link': link})
return job_info
#job_info = get_indeed_jobs()#print(len(job_info))
#job_info_df = pd.DataFrame(job_info)
#job_info_df.drop_duplicates(['link'], keep='first')
#job_info_df["position_title"] = job_info_df["position_title"].replace('', np.nan)
#job_info_df = job_info_df.dropna(subset=['position_title'])
#print(job_info_df.shape)
#print(job_info_df.head())'''skills = kaggle_skills.columns.values
for skill in skills:
job_info_df[skill] = np.zeros(len(job_info))
job_info_df.head()''''skills = kaggle_skills.columns.values\nfor skill in skills:\njob_info_df[skill] = np.zeros(len(job_info))\njob_info_df.head()'
def get_job_details(job_info):
for i in range(len(job_info)):
link = requests.get(job_info.loc[i, 'link'])
soup = BeautifulSoup(link.text, "lxml")
try:
text = soup.find('div', class_ = 'jobsearch-jobDescriptionText').text.strip().lower()
# Text pre-processing
text = re.sub(r'\,', ' ', text)
text = re.sub('/', ' ', text)
text = re.sub(r'\(', ' ', text)
text = re.sub(r'\)', ' ', text)
text = re.sub(' +',' ',text)
except:
text = ""
for s in skills :
# This is specifically for C++, escape the ++. Convert C++ to C\+\+
if any(x in s for x in ['+']):
skill = re.escape(s)
else:
skill = s
matching = re.search(r'(?:^|(?<=\s))' + skill + r'(?=\s|$)',text)
if matching:
job_info[s][i] = 1
return job_info#job_info_details = get_job_details(job_info_df)
#job_info_details.to_csv('./indeed_jobs.csv', index=True)kaggle_data_2018 = pd.read_csv('multiple_choice_responses_2018.csv')
kaggle_data_2018.head().dataframe tbody tr th {
vertical-align: top;
}
.dataframe thead th {
text-align: right;
}
| Time from Start to Finish (seconds) | Q1 | Q1_OTHER_TEXT | Q2 | Q3 | Q4 | Q5 | Q6 | Q6_OTHER_TEXT | Q7 | ... | Q49_OTHER_TEXT | Q50_Part_1 | Q50_Part_2 | Q50_Part_3 | Q50_Part_4 | Q50_Part_5 | Q50_Part_6 | Q50_Part_7 | Q50_Part_8 | Q50_OTHER_TEXT | |
|---|---|---|---|---|---|---|---|---|---|---|---|---|---|---|---|---|---|---|---|---|---|
| 0 | Duration (in seconds) | What is your gender? - Selected Choice | What is your gender? - Prefer to self-describe... | What is your age (# years)? | In which country do you currently reside? | What is the highest level of formal education ... | Which best describes your undergraduate major?... | Select the title most similar to your current ... | Select the title most similar to your current ... | In what industry is your current employer/cont... | ... | What tools and methods do you use to make your... | What barriers prevent you from making your wor... | What barriers prevent you from making your wor... | What barriers prevent you from making your wor... | What barriers prevent you from making your wor... | What barriers prevent you from making your wor... | What barriers prevent you from making your wor... | What barriers prevent you from making your wor... | What barriers prevent you from making your wor... | What barriers prevent you from making your wor... |
| 1 | 710 | Female | -1 | 45-49 | United States of America | Doctoral degree | Other | Consultant | -1 | Other | ... | -1 | NaN | NaN | NaN | NaN | NaN | NaN | NaN | NaN | -1 |
| 2 | 434 | Male | -1 | 30-34 | Indonesia | Bachelor’s degree | Engineering (non-computer focused) | Other | 0 | Manufacturing/Fabrication | ... | -1 | NaN | NaN | NaN | NaN | NaN | NaN | NaN | NaN | -1 |
| 3 | 718 | Female | -1 | 30-34 | United States of America | Master’s degree | Computer science (software engineering, etc.) | Data Scientist | -1 | I am a student | ... | -1 | NaN | Too time-consuming | NaN | NaN | NaN | NaN | NaN | NaN | -1 |
| 4 | 621 | Male | -1 | 35-39 | United States of America | Master’s degree | Social sciences (anthropology, psychology, soc... | Not employed | -1 | NaN | ... | -1 | NaN | NaN | Requires too much technical knowledge | NaN | Not enough incentives to share my work | NaN | NaN | NaN | -1 |
5 rows × 395 columns
for i in range(kaggle_data_2018.shape[1]):
if "_Part_1" in kaggle_data_2018.columns[i] and len(kaggle_data_2018.columns[i]) < len("Q16_Part_14"):
print("\nColumn Index =", i)
print("Column Name =", kaggle_data_2018.columns[i])
print(kaggle_data_2018.iloc[0, i])Column Index = 14
Column Name = Q11_Part_1
Select any activities that make up an important part of your role at work: (Select all that apply) - Selected Choice - Analyze and understand data to influence product or business decisions
Column Index = 29
Column Name = Q13_Part_1
Which of the following integrated development environments (IDE's) have you used at work or school in the last 5 years? (Select all that apply) - Selected Choice - Jupyter/IPython
Column Index = 45
Column Name = Q14_Part_1
Which of the following hosted notebooks have you used at work or school in the last 5 years? (Select all that apply) - Selected Choice - Kaggle Kernels
Column Index = 57
Column Name = Q15_Part_1
Which of the following cloud computing services have you used at work or school in the last 5 years? (Select all that apply) - Selected Choice - Google Cloud Platform (GCP)
Column Index = 65
Column Name = Q16_Part_1
What programming languages do you use on a regular basis? (Select all that apply) - Selected Choice - Python
Column Index = 88
Column Name = Q19_Part_1
What machine learning frameworks have you used in the past 5 years? (Select all that apply) - Selected Choice - Scikit-Learn
Column Index = 110
Column Name = Q21_Part_1
What data visualization libraries or tools have you used in the past 5 years? (Select all that apply) - Selected Choice - ggplot2
Column Index = 130
Column Name = Q27_Part_1
Which of the following cloud computing products have you used at work or school in the last 5 years (Select all that apply)? - Selected Choice - AWS Elastic Compute Cloud (EC2)
Column Index = 151
Column Name = Q28_Part_1
Which of the following machine learning products have you used at work or school in the last 5 years? (Select all that apply) - Selected Choice - Amazon Transcribe
Column Index = 195
Column Name = Q29_Part_1
Which of the following relational database products have you used at work or school in the last 5 years? (Select all that apply) - Selected Choice - AWS Relational Database Service
Column Index = 224
Column Name = Q30_Part_1
Which of the following big data and analytics products have you used at work or school in the last 5 years? (Select all that apply) - Selected Choice - AWS Elastic MapReduce
Column Index = 250
Column Name = Q31_Part_1
Which types of data do you currently interact with most often at work or school? (Select all that apply) - Selected Choice - Audio Data
Column Index = 265
Column Name = Q33_Part_1
Where do you find public datasets? (Select all that apply) - Selected Choice - Government websites
Column Index = 277
Column Name = Q34_Part_1
During a typical data science project at work or school, approximately what proportion of your time is devoted to the following? (Answers must add up to 100%) - Gathering data
Column Index = 284
Column Name = Q35_Part_1
What percentage of your current machine learning/data science training falls under each category? (Answers must add up to 100%) - Self-taught
Column Index = 291
Column Name = Q36_Part_1
On which online platforms have you begun or completed data science courses? (Select all that apply) - Selected Choice - Udacity
Column Index = 307
Column Name = Q38_Part_1
Who/what are your favorite media sources that report on data science topics? (Select all that apply) - Selected Choice - Twitter
Column Index = 330
Column Name = Q39_Part_1
How do you perceive the quality of online learning platforms and in-person bootcamps as compared to the quality of the education provided by traditional brick and mortar institutions? - Online learning platforms and MOOCs:
Column Index = 333
Column Name = Q41_Part_1
How do you perceive the importance of the following topics? - Fairness and bias in ML algorithms:
Column Index = 336
Column Name = Q42_Part_1
What metrics do you or your organization use to determine whether or not your models were successful? (Select all that apply) - Selected Choice - Revenue and/or business goals
Column Index = 343
Column Name = Q44_Part_1
What do you find most difficult about ensuring that your algorithms are fair and unbiased? (Select all that apply) - Lack of communication between individuals who collect the data and individuals who analyze the data
Column Index = 349
Column Name = Q45_Part_1
In what circumstances would you explore model insights and interpret your model's predictions? (Select all that apply) - Only for very important models that are already in production
Column Index = 356
Column Name = Q47_Part_1
What methods do you prefer for explaining and/or interpreting decisions that are made by ML models? (Select all that apply) - Selected Choice - Examine individual model coefficients
Column Index = 373
Column Name = Q49_Part_1
What tools and methods do you use to make your work easy to reproduce? (Select all that apply) - Selected Choice - Share code on Github or a similar code-sharing repository
Column Index = 386
Column Name = Q50_Part_1
What barriers prevent you from making your work even easier to reuse and reproduce? (Select all that apply) - Selected Choice - Too expensive
From the above we can extract some questions that are particularly relevant to our analysis:
Column Index = 29
Column Name = Q13_Part_1
Which of the following integrated development environments (IDE's) have you used at work or school in the last 5 years? (Select all that apply) - Selected Choice - Jupyter/IPython
Column Index = 45
Column Name = Q14_Part_1
Which of the following hosted notebooks have you used at work or school in the last 5 years? (Select all that apply) - Selected Choice - Kaggle Kernels
Column Index = 57
Column Name = Q15_Part_1
Which of the following cloud computing services have you used at work or school in the last 5 years? (Select all that apply) - Selected Choice - Google Cloud Platform (GCP)
Column Index = 65
Column Name = Q16_Part_1
What programming languages do you use on a regular basis? (Select all that apply) - Selected Choice - Python
Column Index = 88
Column Name = Q19_Part_1
What machine learning frameworks have you used in the past 5 years? (Select all that apply) - Selected Choice - Scikit-Learn
Column Index = 110
Column Name = Q21_Part_1
What data visualization libraries or tools have you used in the past 5 years? (Select all that apply) - Selected Choice - ggplot2
Column Index = 130
Column Name = Q27_Part_1
Which of the following cloud computing products have you used at work or school in the last 5 years (Select all that apply)? - Selected Choice - AWS Elastic Compute Cloud (EC2)
Column Index = 151
Column Name = Q28_Part_1
Which of the following machine learning products have you used at work or school in the last 5 years? (Select all that apply) - Selected Choice - Amazon Transcribe
Column Index = 195
Column Name = Q29_Part_1
Which of the following relational database products have you used at work or school in the last 5 years? (Select all that apply) - Selected Choice - AWS Relational Database Service
Column Index = 224
Column Name = Q30_Part_1
Which of the following big data and analytics products have you used at work or school in the last 5 years? (Select all that apply) - Selected Choice - AWS Elastic MapReduce
questions = ["Q13", "Q14", "Q15", "Q16", "Q19", "Q21", "Q27", "Q28", "Q29", "Q30"]
question_columns = []
column_names_dict = dict()
for question in questions:
for i in range(kaggle_data_2018.shape[1]):
column = kaggle_data_2018.columns[i]
if question in column and "OTHER" not in column:
question_columns.append(column)
start_index = kaggle_data_2018.iloc[0, i].index("-", \
kaggle_data_2018.iloc[0, i].index("-")+1)
column_rename_value = kaggle_data_2018.iloc[0, i][start_index+2:].lower()
column_names_dict[column] = column_rename_value
# question_columns = ['Q13_Part_1', 'Q13_Part_2', 'Q13_Part_3', 'Q13_Part_4', 'Q13_Part_5', ...]kd_2018_qs = kaggle_data_2018[question_columns]
def one_hot(element):
if element is np.nan:
return 0
return 1
for column in kd_2018_qs.columns:
kd_2018_qs[column] = kd_2018_qs[column].map(one_hot)
kd_2018_qs = kd_2018_qs.rename(columns=column_names_dict)kd_2018_qs = kd_2018_qs[1:]
print(kd_2018_qs.columns)
kd_2018_qs.drop(["i have not used any cloud providers", "none"], axis=1, inplace=True)
kd_2018_qs = kd_2018_qs.rename(columns={'google cloud platform (gcp)': 'gcp', 'amazon web services (aws)': 'aws'})
kd_2018_qs.head()Index(['jupyter/ipython', 'rstudio', 'pycharm', 'visual studio code',
'nteract', 'atom', 'matlab', 'visual studio', 'notepad++',
'sublime text',
...
'snowflake', 'databricks', 'azure sql data warehouse',
'azure hdinsight', 'azure stream analytics',
'ibm infosphere datastorage', 'ibm cloud analytics engine',
'ibm cloud streaming analytics', 'none', 'other'],
dtype='object', length=199)
.dataframe tbody tr th {
    vertical-align: top;
}

.dataframe thead th {
    text-align: right;
}
| jupyter/ipython | rstudio | pycharm | visual studio code | nteract | atom | matlab | visual studio | notepad++ | sublime text | ... | sap iq | snowflake | databricks | azure sql data warehouse | azure hdinsight | azure stream analytics | ibm infosphere datastorage | ibm cloud analytics engine | ibm cloud streaming analytics | other | |
|---|---|---|---|---|---|---|---|---|---|---|---|---|---|---|---|---|---|---|---|---|---|
| 1 | 1 | 0 | 0 | 0 | 0 | 0 | 0 | 0 | 0 | 0 | ... | 0 | 0 | 0 | 0 | 0 | 0 | 0 | 0 | 0 | 0 |
| 2 | 0 | 0 | 0 | 0 | 0 | 0 | 0 | 0 | 0 | 0 | ... | 0 | 0 | 0 | 0 | 0 | 0 | 0 | 0 | 0 | 0 |
| 3 | 0 | 0 | 0 | 0 | 0 | 0 | 1 | 0 | 0 | 0 | ... | 0 | 0 | 0 | 0 | 0 | 0 | 0 | 0 | 0 | 0 |
| 4 | 1 | 1 | 1 | 0 | 0 | 0 | 0 | 1 | 0 | 0 | ... | 0 | 0 | 0 | 0 | 0 | 0 | 0 | 0 | 0 | 0 |
| 5 | 0 | 1 | 0 | 0 | 0 | 0 | 0 | 0 | 0 | 0 | ... | 0 | 0 | 0 | 0 | 0 | 0 | 0 | 0 | 0 | 0 |
5 rows × 189 columns
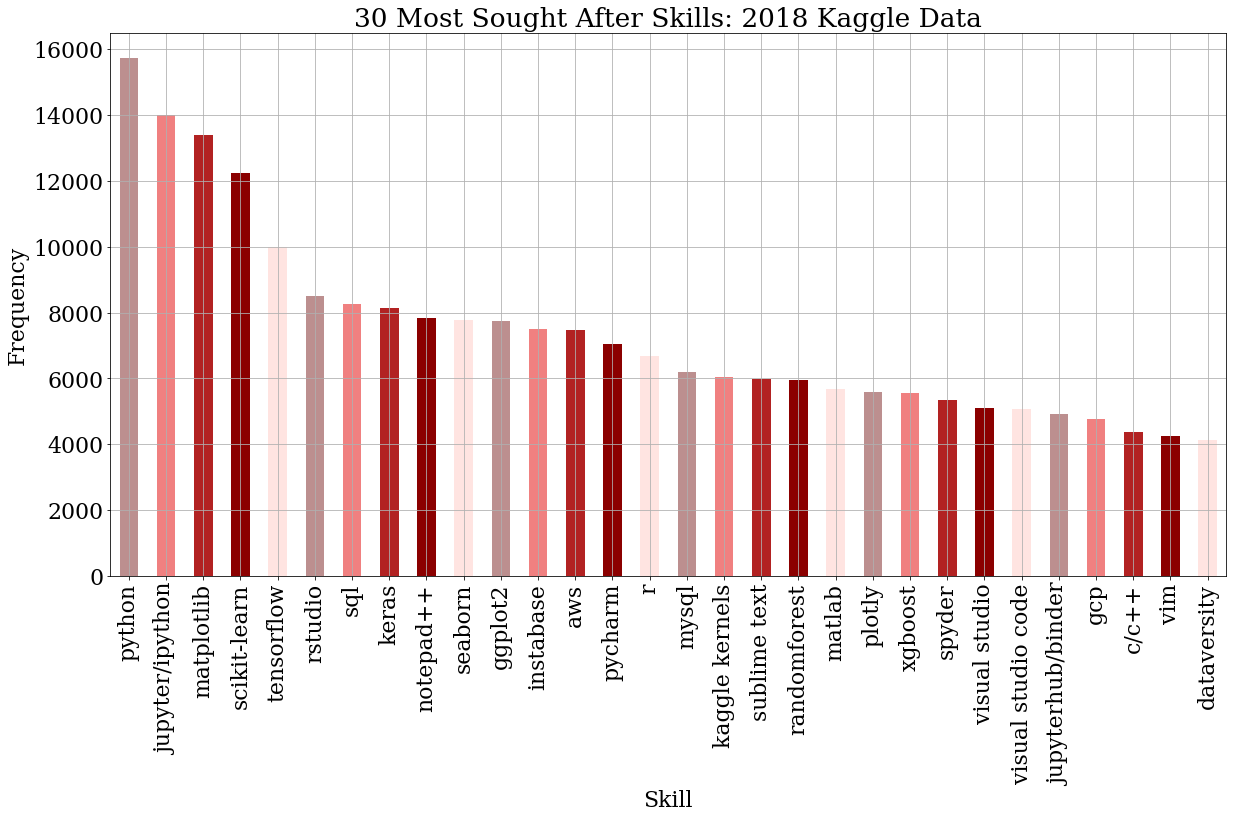
plt.figure(figsize=(20,10))
font = {'font.family' : 'serif',
'font.size' : 22,
'font.weight' : 'normal'}
plt.rcParams.update(font)
my_colors = ["rosybrown", "lightcoral", "firebrick", "darkred", "mistyrose"]*12
sorted_counts_2018 = kd_2018_qs.sum().sort_values(ascending=False)[:30].plot(kind="bar", color=my_colors)
plt.title("30 Most Sought After Skills: 2018 Kaggle Data")
plt.grid(True)
plt.xlabel("Skill")
plt.ylabel("Frequency")
plt.show()kd_2018_qs.to_csv('./kaggle_skills_2018.csv', index=True)# Use skills from 2018 kaggle survey data
skills_df = pd.read_csv('kaggle_skills_2018.csv')
sorted_counts_2018 = skills_df.sum().sort_values(ascending=False)
skills = sorted_counts_2018.index
skills = set([skill.strip().lower() for skill in skills])remove_list=['other','other.1','other.2','other.3','other.4','other.5','other.6','other.7','other.8','other.9','unnamed: 0']
skills=[x for x in skills if x not in remove_list]# Read in the indeed job postings details
job_info = pd.read_csv('indeed_jobs.csv')
job_info.drop(['Unnamed: 0'], axis=1, inplace=True)
# Drop rows without description
job_info.replace("", np.nan, inplace=True)
job_info.dropna(subset = ['description'], inplace=True)
job_info.reset_index(drop=True, inplace=True)
job_info.head().dataframe tbody tr th {
vertical-align: top;
}
.dataframe thead th {
text-align: right;
}
| employer | link | location | position_title | salary | description | |
|---|---|---|---|---|---|---|
| 0 | STONE TILE INTERNATIONAL | http://ca.indeed.com/pagead/clk?mo=r&ad=-6NYlb... | NaN | Replenishment Analyst | NaN | position: replenishment analystreports to: sen... |
| 1 | exactEarth Ltd. | http://ca.indeed.com/pagead/clk?mo=r&ad=-6NYlb... | NaN | Data Scientist | NaN | about usexactearth is a data services company ... |
| 2 | Biolab Pharma | http://ca.indeed.com/pagead/clk?mo=r&ad=-6NYlb... | NaN | Associate Scientist Formulation Development | $54,000 - $66,000 a year | the formulation development associate scientis... |
| 3 | Canada Infrastructure Bank | http://ca.indeed.com/pagead/clk?mo=r&ad=-6NYlb... | NaN | Analyst, Investments | NaN | headquartered in toronto the canada infrastruc... |
| 4 | Reconnect Community Health Services | http://ca.indeed.com/pagead/clk?mo=r&ad=-6NYlb... | NaN | Decision Support Junior Analyst | $17 an hour | positions available: 3compensation: $17.00 per... |
#initialize the skills column
for skill in skills:
job_info[skill] = np.zeros(len(job_info))
job_info.reset_index(drop=True, inplace=True)
job_info.head().dataframe tbody tr th {
vertical-align: top;
}
.dataframe thead th {
text-align: right;
}
| employer | link | location | position_title | salary | description | amazon lex | scala | cntk | h20 | ... | ibm cloud | azure kubernetes service | google cloud spanner | azure event grid | ibm watson text to speech | ibm watson discovery | ibm cloud virtual servers | google cloud dataproc | google cloud translation api | sas | |
|---|---|---|---|---|---|---|---|---|---|---|---|---|---|---|---|---|---|---|---|---|---|
| 0 | STONE TILE INTERNATIONAL | http://ca.indeed.com/pagead/clk?mo=r&ad=-6NYlb... | NaN | Replenishment Analyst | NaN | position: replenishment analystreports to: sen... | 0.0 | 0.0 | 0.0 | 0.0 | ... | 0.0 | 0.0 | 0.0 | 0.0 | 0.0 | 0.0 | 0.0 | 0.0 | 0.0 | 0.0 |
| 1 | exactEarth Ltd. | http://ca.indeed.com/pagead/clk?mo=r&ad=-6NYlb... | NaN | Data Scientist | NaN | about usexactearth is a data services company ... | 0.0 | 0.0 | 0.0 | 0.0 | ... | 0.0 | 0.0 | 0.0 | 0.0 | 0.0 | 0.0 | 0.0 | 0.0 | 0.0 | 0.0 |
| 2 | Biolab Pharma | http://ca.indeed.com/pagead/clk?mo=r&ad=-6NYlb... | NaN | Associate Scientist Formulation Development | $54,000 - $66,000 a year | the formulation development associate scientis... | 0.0 | 0.0 | 0.0 | 0.0 | ... | 0.0 | 0.0 | 0.0 | 0.0 | 0.0 | 0.0 | 0.0 | 0.0 | 0.0 | 0.0 |
| 3 | Canada Infrastructure Bank | http://ca.indeed.com/pagead/clk?mo=r&ad=-6NYlb... | NaN | Analyst, Investments | NaN | headquartered in toronto the canada infrastruc... | 0.0 | 0.0 | 0.0 | 0.0 | ... | 0.0 | 0.0 | 0.0 | 0.0 | 0.0 | 0.0 | 0.0 | 0.0 | 0.0 | 0.0 |
| 4 | Reconnect Community Health Services | http://ca.indeed.com/pagead/clk?mo=r&ad=-6NYlb... | NaN | Decision Support Junior Analyst | $17 an hour | positions available: 3compensation: $17.00 per... | 0.0 | 0.0 | 0.0 | 0.0 | ... | 0.0 | 0.0 | 0.0 | 0.0 | 0.0 | 0.0 | 0.0 | 0.0 | 0.0 | 0.0 |
5 rows × 185 columns
# Helper function for extracting the skills from job description
def extract_skills():
for i in range(len(job_info)):
for s in skills :
# This is specifically for C++, escape the ++. Convert C++ to C\+\+
if any(x in s for x in ['+']):
skill = re.escape(s)
else:
skill = s
description = job_info.loc[i, 'description']
matching = re.search(r'(?:^|(?<=\s))' + skill + r'(?=\s|$)',description)
if matching:
job_info[s][i] = 1
#print("matched skill ",s, "for job ",str(i+1))extract_skills()
job_info.head().dataframe tbody tr th {
vertical-align: top;
}
.dataframe thead th {
text-align: right;
}
| employer | link | location | position_title | salary | description | amazon lex | scala | cntk | h20 | ... | ibm cloud | azure kubernetes service | google cloud spanner | azure event grid | ibm watson text to speech | ibm watson discovery | ibm cloud virtual servers | google cloud dataproc | google cloud translation api | sas | |
|---|---|---|---|---|---|---|---|---|---|---|---|---|---|---|---|---|---|---|---|---|---|
| 0 | STONE TILE INTERNATIONAL | http://ca.indeed.com/pagead/clk?mo=r&ad=-6NYlb... | NaN | Replenishment Analyst | NaN | position: replenishment analystreports to: sen... | 0.0 | 0.0 | 0.0 | 0.0 | ... | 0.0 | 0.0 | 0.0 | 0.0 | 0.0 | 0.0 | 0.0 | 0.0 | 0.0 | 0.0 |
| 1 | exactEarth Ltd. | http://ca.indeed.com/pagead/clk?mo=r&ad=-6NYlb... | NaN | Data Scientist | NaN | about usexactearth is a data services company ... | 0.0 | 0.0 | 0.0 | 0.0 | ... | 0.0 | 0.0 | 0.0 | 0.0 | 0.0 | 0.0 | 0.0 | 0.0 | 0.0 | 0.0 |
| 2 | Biolab Pharma | http://ca.indeed.com/pagead/clk?mo=r&ad=-6NYlb... | NaN | Associate Scientist Formulation Development | $54,000 - $66,000 a year | the formulation development associate scientis... | 0.0 | 0.0 | 0.0 | 0.0 | ... | 0.0 | 0.0 | 0.0 | 0.0 | 0.0 | 0.0 | 0.0 | 0.0 | 0.0 | 0.0 |
| 3 | Canada Infrastructure Bank | http://ca.indeed.com/pagead/clk?mo=r&ad=-6NYlb... | NaN | Analyst, Investments | NaN | headquartered in toronto the canada infrastruc... | 0.0 | 0.0 | 0.0 | 0.0 | ... | 0.0 | 0.0 | 0.0 | 0.0 | 0.0 | 0.0 | 0.0 | 0.0 | 0.0 | 0.0 |
| 4 | Reconnect Community Health Services | http://ca.indeed.com/pagead/clk?mo=r&ad=-6NYlb... | NaN | Decision Support Junior Analyst | $17 an hour | positions available: 3compensation: $17.00 per... | 0.0 | 0.0 | 0.0 | 0.0 | ... | 0.0 | 0.0 | 0.0 | 0.0 | 0.0 | 0.0 | 0.0 | 0.0 | 0.0 | 0.0 |
5 rows × 185 columns
# Save the resulting dataframe to file
job_info.to_csv('./indeed_skills.csv', index=True)#Read in the already saved data
indeed_skills = pd.read_csv('indeed_skills.csv')
indeed_skills.drop(['Unnamed: 0'], axis=1, inplace=True)
indeed_skills.head().dataframe tbody tr th {
vertical-align: top;
}
.dataframe thead th {
text-align: right;
}
| employer | link | location | position_title | salary | description | amazon lex | scala | cntk | h20 | ... | ibm cloud | azure kubernetes service | google cloud spanner | azure event grid | ibm watson text to speech | ibm watson discovery | ibm cloud virtual servers | google cloud dataproc | google cloud translation api | sas | |
|---|---|---|---|---|---|---|---|---|---|---|---|---|---|---|---|---|---|---|---|---|---|
| 0 | STONE TILE INTERNATIONAL | http://ca.indeed.com/pagead/clk?mo=r&ad=-6NYlb... | NaN | Replenishment Analyst | NaN | position: replenishment analystreports to: sen... | 0.0 | 0.0 | 0.0 | 0.0 | ... | 0.0 | 0.0 | 0.0 | 0.0 | 0.0 | 0.0 | 0.0 | 0.0 | 0.0 | 0.0 |
| 1 | exactEarth Ltd. | http://ca.indeed.com/pagead/clk?mo=r&ad=-6NYlb... | NaN | Data Scientist | NaN | about usexactearth is a data services company ... | 0.0 | 0.0 | 0.0 | 0.0 | ... | 0.0 | 0.0 | 0.0 | 0.0 | 0.0 | 0.0 | 0.0 | 0.0 | 0.0 | 0.0 |
| 2 | Biolab Pharma | http://ca.indeed.com/pagead/clk?mo=r&ad=-6NYlb... | NaN | Associate Scientist Formulation Development | $54,000 - $66,000 a year | the formulation development associate scientis... | 0.0 | 0.0 | 0.0 | 0.0 | ... | 0.0 | 0.0 | 0.0 | 0.0 | 0.0 | 0.0 | 0.0 | 0.0 | 0.0 | 0.0 |
| 3 | Canada Infrastructure Bank | http://ca.indeed.com/pagead/clk?mo=r&ad=-6NYlb... | NaN | Analyst, Investments | NaN | headquartered in toronto the canada infrastruc... | 0.0 | 0.0 | 0.0 | 0.0 | ... | 0.0 | 0.0 | 0.0 | 0.0 | 0.0 | 0.0 | 0.0 | 0.0 | 0.0 | 0.0 |
| 4 | Reconnect Community Health Services | http://ca.indeed.com/pagead/clk?mo=r&ad=-6NYlb... | NaN | Decision Support Junior Analyst | $17 an hour | positions available: 3compensation: $17.00 per... | 0.0 | 0.0 | 0.0 | 0.0 | ... | 0.0 | 0.0 | 0.0 | 0.0 | 0.0 | 0.0 | 0.0 | 0.0 | 0.0 | 0.0 |
5 rows × 185 columns
indeed_skills = job_info.drop(['employer', 'link', 'location', 'position_title', 'salary', 'description'], axis=1)
indeed_skills.rename(columns={'google cloud platform (gcp)': 'gcp'}, inplace=True)indeed_skills.head().dataframe tbody tr th {
vertical-align: top;
}
.dataframe thead th {
text-align: right;
}
| amazon lex | scala | cntk | h20 | google cloud automl | matplotlib | php | datarobot | atom | aws elastic beanstalk | ... | ibm cloud | azure kubernetes service | google cloud spanner | azure event grid | ibm watson text to speech | ibm watson discovery | ibm cloud virtual servers | google cloud dataproc | google cloud translation api | sas | |
|---|---|---|---|---|---|---|---|---|---|---|---|---|---|---|---|---|---|---|---|---|---|
| 0 | 0.0 | 0.0 | 0.0 | 0.0 | 0.0 | 0.0 | 0.0 | 0.0 | 0.0 | 0.0 | ... | 0.0 | 0.0 | 0.0 | 0.0 | 0.0 | 0.0 | 0.0 | 0.0 | 0.0 | 0.0 |
| 1 | 0.0 | 0.0 | 0.0 | 0.0 | 0.0 | 0.0 | 0.0 | 0.0 | 0.0 | 0.0 | ... | 0.0 | 0.0 | 0.0 | 0.0 | 0.0 | 0.0 | 0.0 | 0.0 | 0.0 | 0.0 |
| 2 | 0.0 | 0.0 | 0.0 | 0.0 | 0.0 | 0.0 | 0.0 | 0.0 | 0.0 | 0.0 | ... | 0.0 | 0.0 | 0.0 | 0.0 | 0.0 | 0.0 | 0.0 | 0.0 | 0.0 | 0.0 |
| 3 | 0.0 | 0.0 | 0.0 | 0.0 | 0.0 | 0.0 | 0.0 | 0.0 | 0.0 | 0.0 | ... | 0.0 | 0.0 | 0.0 | 0.0 | 0.0 | 0.0 | 0.0 | 0.0 | 0.0 | 0.0 |
| 4 | 0.0 | 0.0 | 0.0 | 0.0 | 0.0 | 0.0 | 0.0 | 0.0 | 0.0 | 0.0 | ... | 0.0 | 0.0 | 0.0 | 0.0 | 0.0 | 0.0 | 0.0 | 0.0 | 0.0 | 0.0 |
5 rows × 179 columns
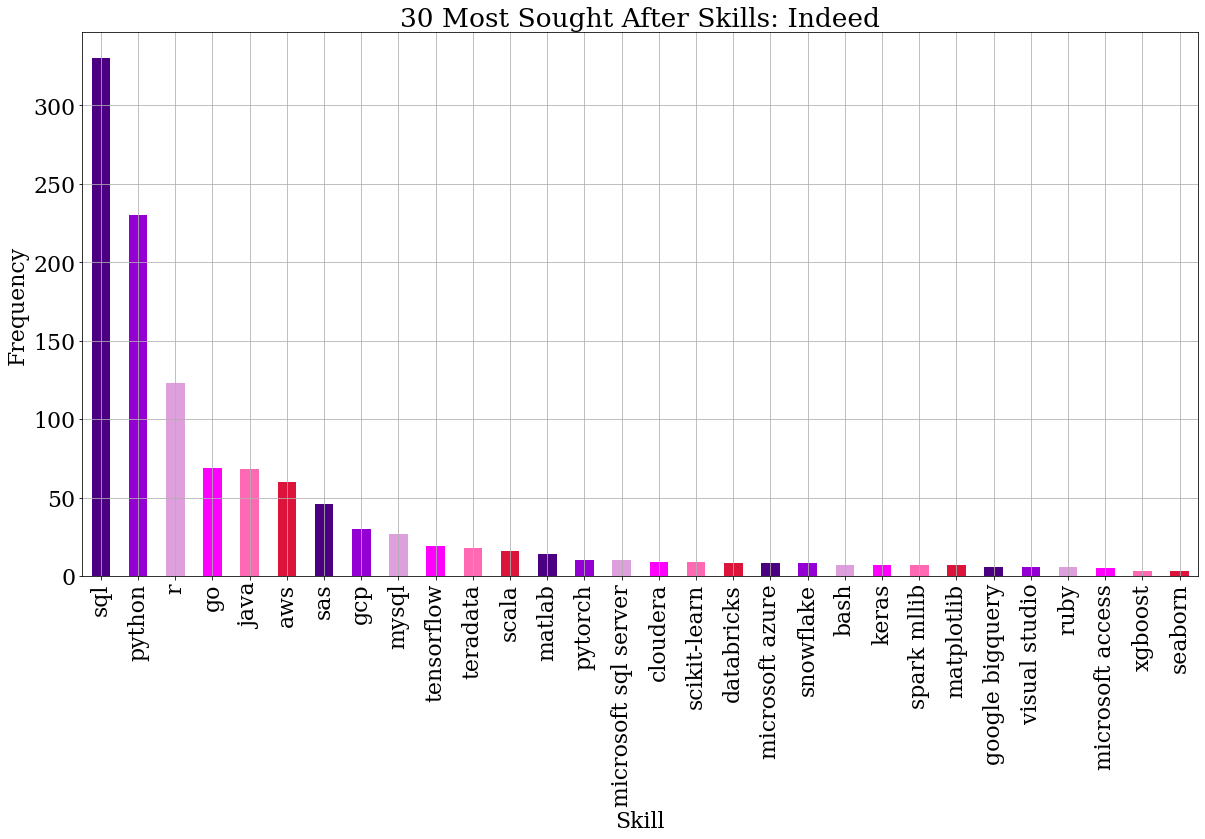
# Visualize the frequency of the skills in indeed job postings
plt.figure(figsize=(20,10))
font = {'font.family' : 'serif',
'font.size' : 22,
'font.weight' : 'normal'}
plt.rcParams.update(font)
my_colors = ["indigo", "darkviolet", "plum", "magenta", "hotpink", "crimson"]*12
indeed_skills.sum().sort_values(ascending=False)[:30].plot(kind="bar", color=my_colors)
plt.title("30 Most Sought After Skills: Indeed")
plt.xlabel("Skill")
plt.ylabel("Frequency")
plt.grid(True)
plt.show()Use hierachircal clustering to cluster the skills identified above. Each cluster could potentially represent closely related skills according to the dataset. Thus, the clusters can be used as topic (or give an idea of topic) that can be added on the curriculum and elements of the cluster can inform the subtopics. (or something along these lines)
from sklearn.preprocessing import normalize
import scipy.cluster.hierarchy as sch
from scipy import zeros as sci_zeros
from scipy.spatial.distance import euclidean
from scipy.cluster.hierarchy import dendrogram
from sklearn.cluster import AgglomerativeClustering
%matplotlib inline# Helper function to run clustering
def run_clustering(df, n_clusters):
df = pd.DataFrame(normalize(df), columns=df.columns)
df = df.transpose()
df.index.name = 'words'
model = AgglomerativeClustering(n_clusters=n_clusters, affinity='euclidean',
compute_full_tree=True,linkage='ward')
clusters = model.fit_predict(df)
df["cluster_name"] = clusters
df.reset_index(inplace=True)
cluster_list = len(df["cluster_name"].unique())
#Retrieve the elements of each cluster
for cluster_number in range(cluster_list):
print("="*20)
print("Cluster %d: " % cluster_number)
df_temp = df[df['cluster_name'] == cluster_number]
df_temp = df_temp.drop(columns = 'cluster_name')
print("Cluster size: ", len(df_temp))
print(','.join(df_temp.words.tolist()))kaggle_skills = pd.read_csv('kaggle_skills.csv')
print(kaggle_skills.columns)
kaggle_skills.head()Index(['Unnamed: 0', 'python', 'r', 'sql', 'c', 'c++', 'java', 'javascript',
'typescript', 'bash', 'matlab', 'ggplot / ggplot2', 'matplotlib',
'altair', 'shiny', 'd3.js', 'plotly / plotly express', 'bokeh',
'seaborn', 'geoplotlib', 'leaflet / folium',
'linear or logistic regression', 'decision trees or random forests',
'gradient boosting machines', 'bayesian approaches',
'evolutionary approaches', 'dense neural networks (mlps, etc)',
'convolutional neural networks', 'generative adversarial networks',
'recurrent neural networks', 'transformer networks (bert, gpt-2, etc)',
'image/video tools',
'image segmentation methods (u-net, mask r-cnn, etc)',
'object detection methods (yolov3, retinanet, etc)',
'image classification', 'generative networks (gan, vae, etc)',
'word embeddings/vectors (glove, fasttext, word2vec)',
'encoder-decorder models (seq2seq, vanilla transformers)',
'contextualized embeddings (elmo, cove)',
'transformer language models (gpt-2, bert, xlnet, etc)', 'scikit-learn',
'tensorflow', 'keras', 'randomforest', 'xgboost', 'pytorch', 'caret',
'lightgbm', 'spark mlib', 'fast.ai', 'google cloud platform (gcp)',
'amazon web services (aws)', 'microsoft azure', 'ibm cloud',
'alibaba cloud', 'salesforce cloud', 'oracle cloud', 'sap cloud',
'vmware cloud', 'red hat cloud', 'google bigquery', 'aws redshift',
'databricks', 'aws elastic mapreduce', 'teradata',
'microsoft analysis services', 'google cloud dataflow', 'aws athena',
'aws kinesis', 'google cloud pub/sub', 'sas', 'cloudera',
'azure machine learning studio', 'google cloud machine learning engine',
'google cloud vision', 'google cloud speech-to-text',
'google cloud natural language', 'rapidminer',
'google cloud translation', 'amazon sagemaker', 'mysql', 'postgressql',
'sqlite', 'microsoft sql server', 'oracle database', 'microsoft access',
'aws relational database service', 'aws dynamodb', 'azure sql database',
'google cloud sql'],
dtype='object')
.dataframe tbody tr th {
    vertical-align: top;
}

.dataframe thead th {
    text-align: right;
}
| Unnamed: 0 | python | r | sql | c | c++ | java | javascript | typescript | bash | ... | mysql | postgressql | sqlite | microsoft sql server | oracle database | microsoft access | aws relational database service | aws dynamodb | azure sql database | google cloud sql | |
|---|---|---|---|---|---|---|---|---|---|---|---|---|---|---|---|---|---|---|---|---|---|
| 0 | 1 | 1.0 | 1.0 | 1.0 | 0.0 | 0.0 | 1.0 | 1.0 | 0.0 | 0.0 | ... | 0.0 | 0.0 | 0.0 | 0.0 | 0.0 | 0.0 | 0.0 | 0.0 | 0.0 | 0.0 |
| 1 | 2 | 0.0 | 0.0 | 0.0 | 0.0 | 0.0 | 0.0 | 0.0 | 0.0 | 0.0 | ... | 0.0 | 0.0 | 0.0 | 0.0 | 0.0 | 0.0 | 0.0 | 0.0 | 0.0 | 0.0 |
| 2 | 3 | 0.0 | 0.0 | 0.0 | 0.0 | 0.0 | 0.0 | 0.0 | 0.0 | 0.0 | ... | 0.0 | 0.0 | 0.0 | 0.0 | 0.0 | 0.0 | 0.0 | 0.0 | 0.0 | 0.0 |
| 3 | 4 | 1.0 | 1.0 | 1.0 | 0.0 | 0.0 | 0.0 | 0.0 | 0.0 | 1.0 | ... | 0.0 | 0.0 | 0.0 | 0.0 | 0.0 | 0.0 | 0.0 | 0.0 | 1.0 | 0.0 |
| 4 | 5 | 1.0 | 0.0 | 1.0 | 0.0 | 0.0 | 0.0 | 0.0 | 0.0 | 0.0 | ... | 0.0 | 0.0 | 0.0 | 0.0 | 0.0 | 0.0 | 0.0 | 0.0 | 0.0 | 0.0 |
5 rows × 90 columns
kaggle_skills = kaggle_skills.drop(['Unnamed: 0'], axis=1)
kaggle_skills.head().dataframe tbody tr th {
vertical-align: top;
}
.dataframe thead th {
text-align: right;
}
| python | r | sql | c | c++ | java | javascript | typescript | bash | matlab | ... | mysql | postgressql | sqlite | microsoft sql server | oracle database | microsoft access | aws relational database service | aws dynamodb | azure sql database | google cloud sql | |
|---|---|---|---|---|---|---|---|---|---|---|---|---|---|---|---|---|---|---|---|---|---|
| 0 | 1.0 | 1.0 | 1.0 | 0.0 | 0.0 | 1.0 | 1.0 | 0.0 | 0.0 | 1.0 | ... | 0.0 | 0.0 | 0.0 | 0.0 | 0.0 | 0.0 | 0.0 | 0.0 | 0.0 | 0.0 |
| 1 | 0.0 | 0.0 | 0.0 | 0.0 | 0.0 | 0.0 | 0.0 | 0.0 | 0.0 | 0.0 | ... | 0.0 | 0.0 | 0.0 | 0.0 | 0.0 | 0.0 | 0.0 | 0.0 | 0.0 | 0.0 |
| 2 | 0.0 | 0.0 | 0.0 | 0.0 | 0.0 | 0.0 | 0.0 | 0.0 | 0.0 | 0.0 | ... | 0.0 | 0.0 | 0.0 | 0.0 | 0.0 | 0.0 | 0.0 | 0.0 | 0.0 | 0.0 |
| 3 | 1.0 | 1.0 | 1.0 | 0.0 | 0.0 | 0.0 | 0.0 | 0.0 | 1.0 | 0.0 | ... | 0.0 | 0.0 | 0.0 | 0.0 | 0.0 | 0.0 | 0.0 | 0.0 | 1.0 | 0.0 |
| 4 | 1.0 | 0.0 | 1.0 | 0.0 | 0.0 | 0.0 | 0.0 | 0.0 | 0.0 | 0.0 | ... | 0.0 | 0.0 | 0.0 | 0.0 | 0.0 | 0.0 | 0.0 | 0.0 | 0.0 | 0.0 |
5 rows × 89 columns
run_clustering(kaggle_skills, 6)====================
Cluster 0:
Cluster size: 3
r,sql,ggplot / ggplot2
====================
Cluster 1:
Cluster size: 4
python,matplotlib,seaborn,scikit-learn
====================
Cluster 2:
Cluster size: 68
c,c++,java,javascript,typescript,bash,matlab,altair,shiny,d3.js,plotly / plotly express,bokeh,geoplotlib,leaflet / folium,bayesian approaches,evolutionary approaches,generative adversarial networks,recurrent neural networks,transformer networks (bert, gpt-2, etc),generative networks (gan, vae, etc),word embeddings/vectors (glove, fasttext, word2vec),encoder-decorder models (seq2seq, vanilla transformers),contextualized embeddings (elmo, cove),transformer language models (gpt-2, bert, xlnet, etc),caret,lightgbm,spark mlib,fast.ai,google cloud platform (gcp),amazon web services (aws),microsoft azure,ibm cloud,alibaba cloud,salesforce cloud,oracle cloud,sap cloud,vmware cloud,red hat cloud,google bigquery,aws redshift,databricks,aws elastic mapreduce,teradata,microsoft analysis services,google cloud dataflow,aws athena,aws kinesis,google cloud pub/sub,sas,cloudera,azure machine learning studio,google cloud machine learning engine,google cloud vision,google cloud speech-to-text,google cloud natural language,rapidminer,google cloud translation,amazon sagemaker,mysql,postgressql,sqlite,microsoft sql server,oracle database,microsoft access,aws relational database service,aws dynamodb,azure sql database,google cloud sql
====================
Cluster 3:
Cluster size: 9
dense neural networks (mlps, etc),convolutional neural networks,image/video tools,image segmentation methods (u-net, mask r-cnn, etc),object detection methods (yolov3, retinanet, etc),image classification,tensorflow,keras,pytorch
====================
Cluster 4:
Cluster size: 3
gradient boosting machines,randomforest,xgboost
====================
Cluster 5:
Cluster size: 2
linear or logistic regression,decision trees or random forests
-
From the bar chart earlier, python seems to be the most used programming language and from above, it belongs to its own cluster. We can decide to use python as the primary language for the course
-
Cluster 2 looks like python libraries. We can add that to the curriculum
-
Cluster 3 seems to be about Neural Networks. We can decide to add an intro to NN
-
Cluster 4 & 5 seem to be supervised learning algorithms, so we can add that to the syllabus (with subtopics of linear or logistic regression,decision trees or random forests, xgboost
-
Ignore cluster 8, because we decided to go with python
-
Cluster 9: keep as NN libraries. Can combine this with cluster 3
kaggle_skills_2018 = pd.read_csv('kaggle_skills_2018.csv')
print(kaggle_skills_2018.columns)
#kaggle_skills_2018 = kaggle_skills.drop('Unnamed: 0', axis=1)
kaggle_skills_2018.head()Index(['Unnamed: 0', 'jupyter/ipython', 'rstudio', 'pycharm',
'visual studio code', 'nteract', 'atom', 'matlab', 'visual studio',
'notepad++',
...
'sap iq.1', 'snowflake', 'databricks', 'azure sql data warehouse',
'azure hdinsight', 'azure stream analytics',
'ibm infosphere datastorage', 'ibm cloud analytics engine',
'ibm cloud streaming analytics', 'other.9'],
dtype='object', length=190)
.dataframe tbody tr th {
    vertical-align: top;
}

.dataframe thead th {
    text-align: right;
}
| Unnamed: 0 | jupyter/ipython | rstudio | pycharm | visual studio code | nteract | atom | matlab | visual studio | notepad++ | ... | sap iq.1 | snowflake | databricks | azure sql data warehouse | azure hdinsight | azure stream analytics | ibm infosphere datastorage | ibm cloud analytics engine | ibm cloud streaming analytics | other.9 | |
|---|---|---|---|---|---|---|---|---|---|---|---|---|---|---|---|---|---|---|---|---|---|
| 0 | 1 | 1 | 0 | 0 | 0 | 0 | 0 | 0 | 0 | 0 | ... | 0 | 0 | 0 | 0 | 0 | 0 | 0 | 0 | 0 | 0 |
| 1 | 2 | 0 | 0 | 0 | 0 | 0 | 0 | 0 | 0 | 0 | ... | 0 | 0 | 0 | 0 | 0 | 0 | 0 | 0 | 0 | 0 |
| 2 | 3 | 0 | 0 | 0 | 0 | 0 | 0 | 1 | 0 | 0 | ... | 0 | 0 | 0 | 0 | 0 | 0 | 0 | 0 | 0 | 0 |
| 3 | 4 | 1 | 1 | 1 | 0 | 0 | 0 | 0 | 1 | 0 | ... | 0 | 0 | 0 | 0 | 0 | 0 | 0 | 0 | 0 | 0 |
| 4 | 5 | 0 | 1 | 0 | 0 | 0 | 0 | 0 | 0 | 0 | ... | 0 | 0 | 0 | 0 | 0 | 0 | 0 | 0 | 0 | 0 |
5 rows × 190 columns
run_clustering(kaggle_skills_2018, 6)====================
Cluster 0:
Cluster size: 11
rstudio,azure notebook,sql,prophet,shiny,google kubernetes engine,google cloud translation api,cloudera,azure face api,ibm cloud compose,google cloud dataflow
====================
Cluster 1:
Cluster size: 19
pycharm,visual studio,vim,kaggle kernels,google colab,gcp,aws,python,bash,javascript/typescript,scikit-learn,tensorflow,keras,spark mllib,xgboost,altair,d3,bokeh,lattice
====================
Cluster 2:
Cluster size: 148
visual studio code,nteract,atom,notepad++,sublime text,intellij,spyder,other,domino datalab,google cloud datalab,paperspace,floydhub,crestle,jupyterhub/binder,other.1,ibm cloud,alibaba cloud,other.2,visual basic/vba,c/c++,scala,julia,go,c#/.net,php,ruby,sas/stata,other.3,pytorch,h20,fastai,mxnet,caret,mlr,randomforest,lightgbm,catboost,cntk,caffe,other.4,plotly,geoplotlib,leaflet,other.5,aws elastic compute cloud (ec2),google compute engine,aws elastic beanstalk,google app engine,aws lambda,google cloud functions,aws batch,azure virtual machines,azure container service,azure functions,azure event grid,azure batch,azure kubernetes service,ibm cloud virtual servers,ibm cloud container registry,ibm cloud kubernetes service,ibm cloud foundry,other.6,amazon transcribe,google cloud speech-to-text api,amazon rekognition,google cloud vision api,amazon comprehend,google cloud natural language api,amazon translate,amazon lex,google dialogflow enterprise edition,amazon rekognition video,google cloud video intelligence api,google cloud automl,amazon sagemaker,google cloud machine learning engine,datarobot,h20 driverless ai,domino datalab.1,sas,dataiku,rapidminer,instabase,algorithmia,dataversity,azure machine learning workbench,azure cortana intelligence suite,azure bing speech api,azure speaker recognition api,azure computer vision api,azure video api,ibm watson studio,ibm watson knowledge catalog,ibm watson assistant,ibm watson discovery,ibm watson text to speech,ibm watson visual recognition,ibm watson machine learning,azure cognitive services,other.7,aws relational database service,aws aurora,google cloud sql,google cloud spanner,aws dynamodb,google cloud datastore,google cloud bigtable,aws simpledb,microsoft sql server,mysql,postgressql,sqlite,oracle database,ingres,nexusdb,sap iq,google fusion tables,azure database for mysql,azure cosmos db,azure sql database,azure database for postgresql,ibm cloud compose for mysql,ibm cloud compose for postgresql,ibm cloud db2,other.8,aws elastic mapreduce,aws batch.1,google cloud dataproc,google cloud dataprep,aws kinesis,google cloud pub/sub,aws athena,aws redshift,google bigquery,teradata,microsoft analysis services,oracle exadata,oracle warehouse builder,sap iq.1,snowflake,databricks,azure sql data warehouse,azure hdinsight,azure stream analytics,ibm infosphere datastorage,ibm cloud analytics engine,ibm cloud streaming analytics,other.9
====================
Cluster 3:
Cluster size: 1
Unnamed: 0
====================
Cluster 4:
Cluster size: 6
matlab,r,java,matlab.1,ggplot2,seaborn
====================
Cluster 5:
Cluster size: 5
jupyter/ipython,microsoft azure,matplotlib,azure machine learning studio,microsoft access
#Remove skills that are not found in indeed job postings
indeed_df = indeed_skills.drop(columns=indeed_skills.columns[indeed_skills.sum()==0])
indeed_df.head().dataframe tbody tr th {
vertical-align: top;
}
.dataframe thead th {
text-align: right;
}
| scala | matplotlib | php | r | matlab | java | mlr | julia | mxnet | aws | ... | azure cognitive services | xgboost | microsoft azure | sql | python | cloudera | plotly | google bigquery | ibm cloud | sas | |
|---|---|---|---|---|---|---|---|---|---|---|---|---|---|---|---|---|---|---|---|---|---|
| 0 | 0.0 | 0.0 | 0.0 | 0.0 | 0.0 | 0.0 | 0.0 | 0.0 | 0.0 | 0.0 | ... | 0.0 | 0.0 | 0.0 | 0.0 | 0.0 | 0.0 | 0.0 | 0.0 | 0.0 | 0.0 |
| 1 | 0.0 | 0.0 | 0.0 | 0.0 | 0.0 | 1.0 | 0.0 | 0.0 | 0.0 | 0.0 | ... | 0.0 | 0.0 | 0.0 | 0.0 | 0.0 | 0.0 | 0.0 | 0.0 | 0.0 | 0.0 |
| 2 | 0.0 | 0.0 | 0.0 | 0.0 | 0.0 | 0.0 | 0.0 | 0.0 | 0.0 | 0.0 | ... | 0.0 | 0.0 | 0.0 | 0.0 | 0.0 | 0.0 | 0.0 | 0.0 | 0.0 | 0.0 |
| 3 | 0.0 | 0.0 | 0.0 | 0.0 | 0.0 | 0.0 | 0.0 | 0.0 | 0.0 | 0.0 | ... | 0.0 | 0.0 | 0.0 | 0.0 | 0.0 | 0.0 | 0.0 | 0.0 | 0.0 | 0.0 |
| 4 | 0.0 | 0.0 | 0.0 | 0.0 | 0.0 | 0.0 | 0.0 | 0.0 | 0.0 | 0.0 | ... | 0.0 | 0.0 | 0.0 | 0.0 | 0.0 | 0.0 | 0.0 | 0.0 | 0.0 | 0.0 |
5 rows × 45 columns
run_clustering(indeed_df, 3)====================
Cluster 0:
Cluster size: 42
scala,matplotlib,php,matlab,java,mlr,julia,mxnet,aws,seaborn,pytorch,scikit-learn,ggplot2,keras,altair,tensorflow,rstudio,microsoft access,teradata,d3,visual studio,gcp,spark mllib,snowflake,caret,mysql,aws redshift,google compute engine,bash,oracle database,go,ruby,databricks,microsoft sql server,azure cognitive services,xgboost,microsoft azure,cloudera,plotly,google bigquery,ibm cloud,sas
====================
Cluster 1:
Cluster size: 1
sql
====================
Cluster 2:
Cluster size: 2
r,python
Use hierachircal clustering to cluster the skills identified above. Each cluster could potentially represent closely related skills according to the dataset. Thus, the clusters can be used as topic (or give an idea of topic) that can be added on the curriculum and elements of the cluster can inform the subtopics. (or something along these lines)
2018 Kaggle Data
kaggle_skills = pd.read_csv('kaggle_skills_2018.csv')
kaggle_skills = kaggle_skills.drop(['Unnamed: 0'], axis=1)kaggle_skills.shape(23859, 189)
'''df=kaggle_skills.T
cos_similarity_matrix=df.dot(df.T)'''
'df=kaggle_skills.T\ncos_similarity_matrix=df.dot(df.T)'
from sklearn.metrics import pairwise
cos_similarity_matrix=pairwise.cosine_similarity(kaggle_skills.T)# Compute cosine similarity between all samples in indeed data
cos_similarity=pd.DataFrame(cos_similarity_matrix,columns=kaggle_skills.columns, index=kaggle_skills.columns)
distance_between_skills=cos_similarity.apply(lambda col: (1-col))
from scipy.cluster.hierarchy import dendrogram, linkage
Z = linkage(distance_between_skills, method='ward', metric='euclidean')
fig = plt.figure(figsize=(8, 40))
plt.rcParams.update(plt.rcParamsDefault)
font = {'font.family' : 'serif',
'font.size' : 14,
'font.weight' : 'normal'}
plt.rcParams.update(font)
plt.grid(True)
# First define the leaf label function.
n=kaggle_skills.shape[1]
labels=distance_between_skills.columns.values.tolist()
def llf(id):
if id < n:
return labels[id]
# The text for the leaf nodes is going to be big so force
# a rotation of 90 degrees.
dendrogram(Z, orientation='right', leaf_label_func=llf,leaf_font_size=8)
ax = plt.gca()
ax.tick_params(axis='x', labelsize=12)
ax.tick_params(axis='y', labelsize=12)
plt.title("Hierarchical Clustering of 2018 Kaggle Skills ",fontsize=20)Text(0.5, 1.0, 'Hierarchical Clustering of 2018 Kaggle Skills ')
kaggle_skills = pd.read_csv('../1-MIE-curriculum-design/kaggle_skills.csv')
kaggle_skills = kaggle_skills.drop(['Unnamed: 0'], axis=1)kaggle_skills.shape(19717, 89)
from sklearn.metrics import pairwise
cos_similarity_matrix=pairwise.cosine_similarity(kaggle_skills.T)# Compute cosine similarity between all samples in indeed data
cos_similarity=pd.DataFrame(cos_similarity_matrix,columns=kaggle_skills.columns, index=kaggle_skills.columns)
distance_between_skills=cos_similarity.apply(lambda col: (1-col))
Z = linkage(distance_between_skills, method='ward', metric='euclidean')
fig = plt.figure(figsize=(8, 30))
plt.rcParams.update(plt.rcParamsDefault)
font = {'font.family' : 'serif',
'font.size' : 14,
'font.weight' : 'normal'}
plt.rcParams.update(font)
plt.grid(True)
# First define the leaf label function.
n=kaggle_skills.shape[1]
labels=distance_between_skills.columns.values.tolist()
def llf(id):
if id < n:
return labels[id]
# The text for the leaf nodes is going to be big so force
# a rotation of 90 degrees.
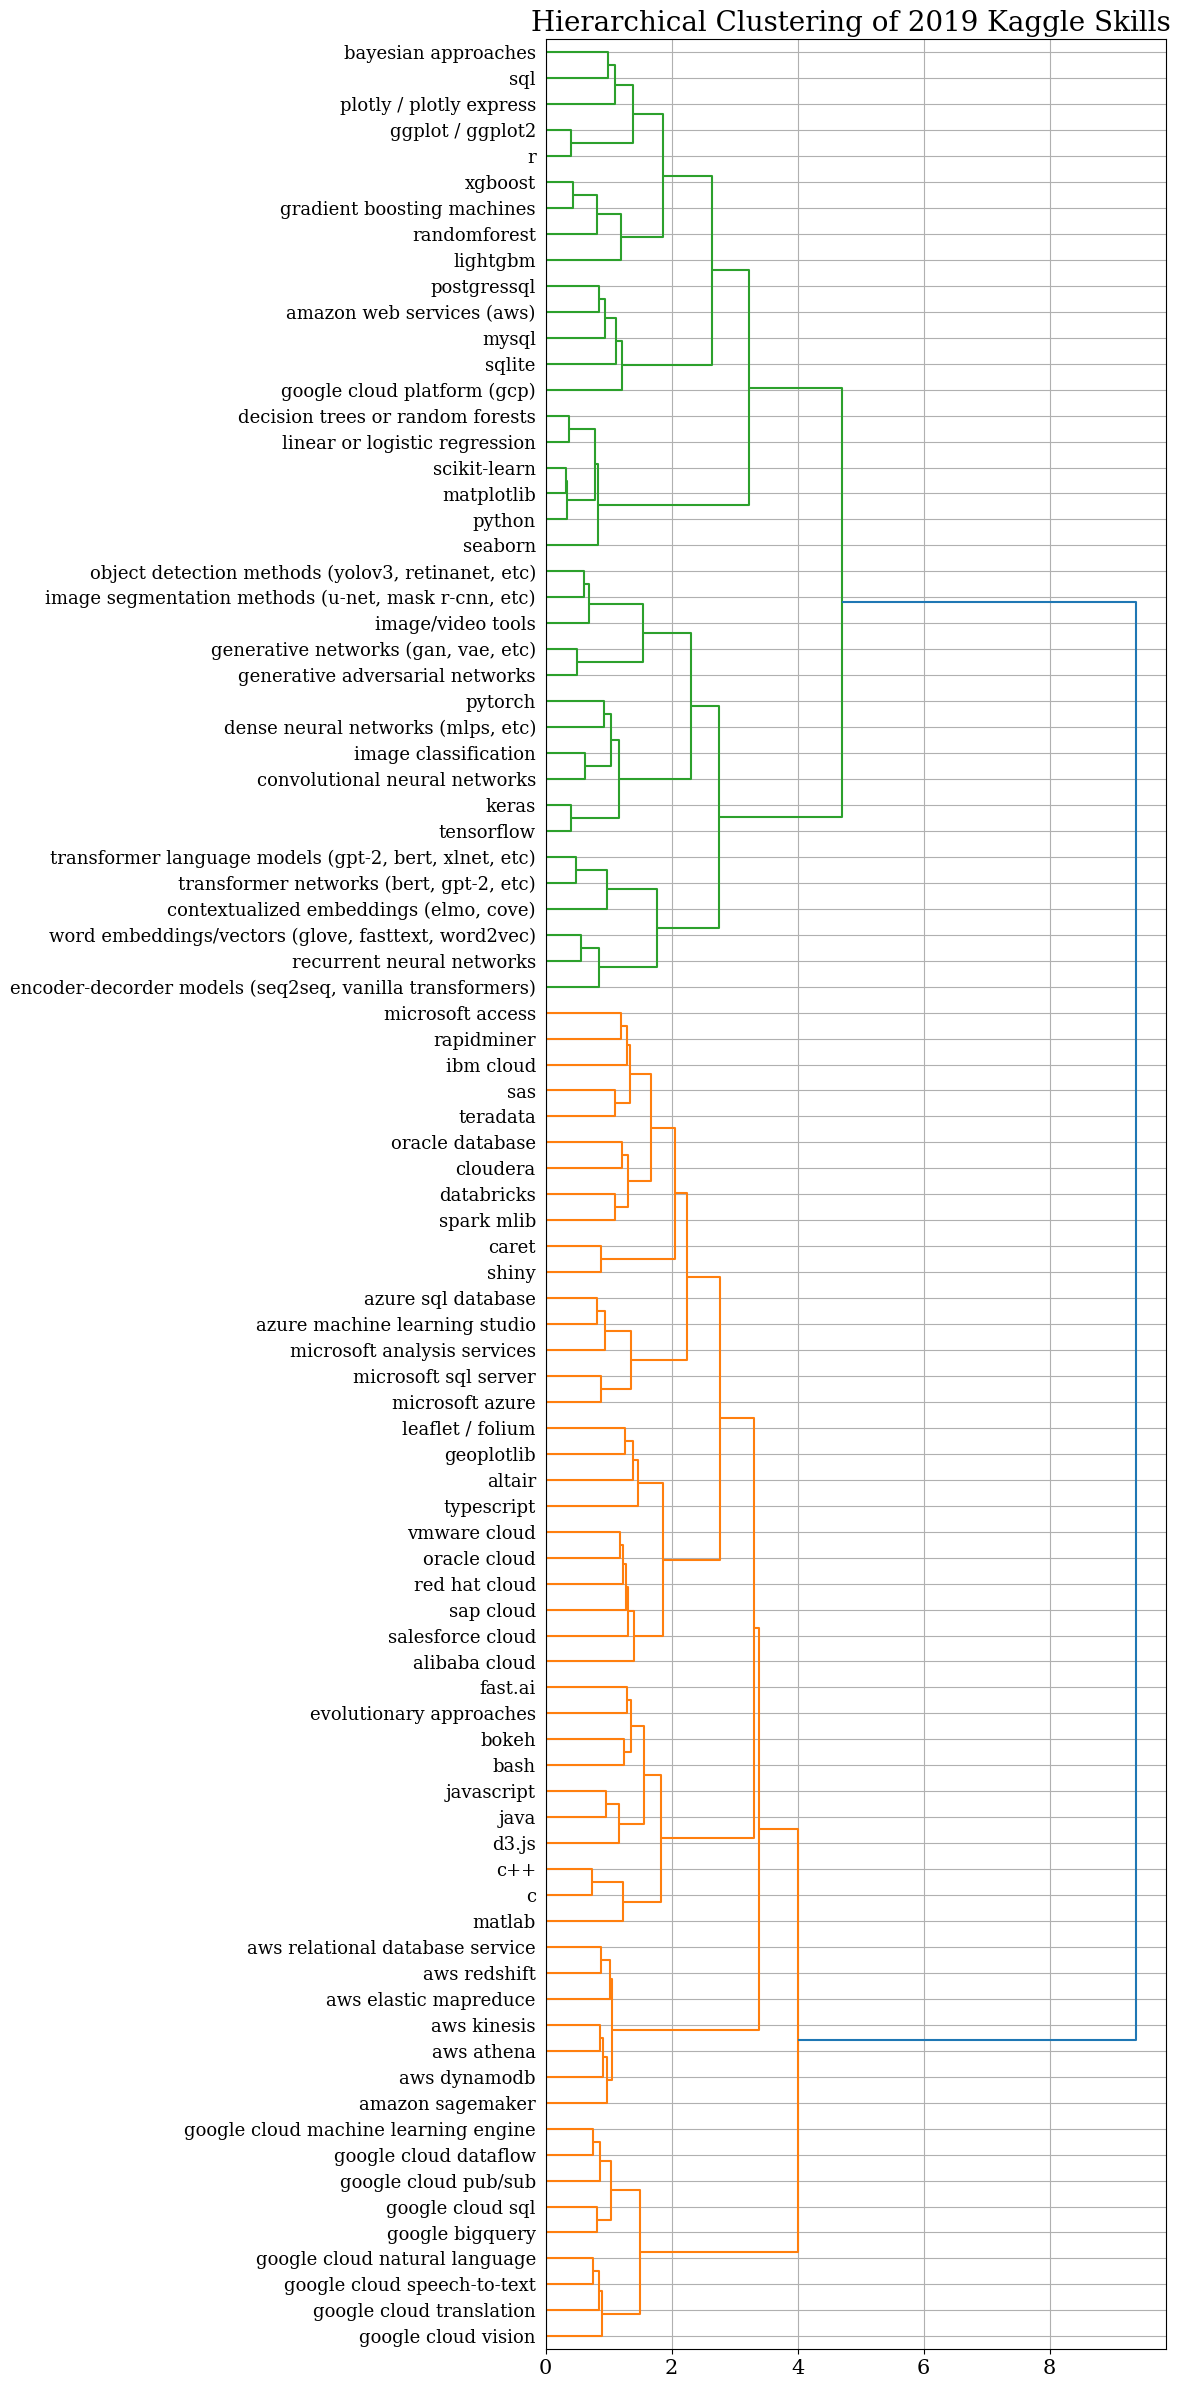
dendrogram(Z, orientation='right', leaf_label_func=llf,leaf_font_size=8)
ax = plt.gca()
ax.tick_params(axis='x', which='major', labelsize=15)
ax.tick_params(axis='y', which='major', labelsize=13)
plt.title("Hierarchical Clustering of 2019 Kaggle Skills ",fontsize=20)Text(0.5, 1.0, 'Hierarchical Clustering of 2019 Kaggle Skills ')
job_info_df = pd.read_csv('indeed_jobs.csv')
job_info_df = job_info_df.drop(['Unnamed: 0'], axis=1)
# Drop rows without description
job_info_df.replace("", np.nan, inplace=True)
job_info_df.dropna(subset = ['description'], inplace=True)
job_info_df.reset_index(drop=True, inplace=True)
job_info_df.head().dataframe tbody tr th {
vertical-align: top;
}
.dataframe thead th {
text-align: right;
}
| employer | link | location | position_title | salary | description | |
|---|---|---|---|---|---|---|
| 0 | STONE TILE INTERNATIONAL | http://ca.indeed.com/pagead/clk?mo=r&ad=-6NYlb... | NaN | Replenishment Analyst | NaN | position: replenishment analystreports to: sen... |
| 1 | exactEarth Ltd. | http://ca.indeed.com/pagead/clk?mo=r&ad=-6NYlb... | NaN | Data Scientist | NaN | about usexactearth is a data services company ... |
| 2 | Biolab Pharma | http://ca.indeed.com/pagead/clk?mo=r&ad=-6NYlb... | NaN | Associate Scientist Formulation Development | $54,000 - $66,000 a year | the formulation development associate scientis... |
| 3 | Canada Infrastructure Bank | http://ca.indeed.com/pagead/clk?mo=r&ad=-6NYlb... | NaN | Analyst, Investments | NaN | headquartered in toronto the canada infrastruc... |
| 4 | Reconnect Community Health Services | http://ca.indeed.com/pagead/clk?mo=r&ad=-6NYlb... | NaN | Decision Support Junior Analyst | $17 an hour | positions available: 3compensation: $17.00 per... |
# List possible skill requirements
skills=['excel','communication','teamwork','critical thinking','presentation', 'marketing','leadership', 'time management', 'collaborate', 'organize',
         'problem-solving', 'project management', 'consulting','negotiation', 'creativity','statisitcal','product management',
        'A.I.','software development','data mining','databases','modeling','spss','spark','optimization','tableau', 'datorama','hadoop', 'spark','power bi','tensorflow', 'sklearns', 'keras','pytorch','theano','data cleaning','Openshift',
       'neural network','deep learning','artificial intelligence','python','r', 'java', 'c', 'c++', 'matlab', 'sas','sql','nosql','linux','big data','data wrangling', 'critical thinking', 'data extraction','feature engineering',
        'powercenter','Informatica','azure','RapidMiner','H2O.ai','DataRobot','api','etl']
skills=[x.lower() for x in skills]
skills = np.array(skills)

#initialize the skills column
for skill in skills:
    job_info_df[skill] = np.zeros(job_info_df.shape[0])
job_info_df.dataframe tbody tr th {
vertical-align: top;
}
.dataframe thead th {
text-align: right;
}
| employer | link | location | position_title | salary | description | excel | communication | teamwork | critical thinking | ... | data extraction | feature engineering | powercenter | informatica | azure | rapidminer | h2o.ai | datarobot | api | etl | |
|---|---|---|---|---|---|---|---|---|---|---|---|---|---|---|---|---|---|---|---|---|---|
| 0 | STONE TILE INTERNATIONAL | http://ca.indeed.com/pagead/clk?mo=r&ad=-6NYlb... | NaN | Replenishment Analyst | NaN | position: replenishment analystreports to: sen... | 0.0 | 0.0 | 0.0 | 0.0 | ... | 0.0 | 0.0 | 0.0 | 0.0 | 0.0 | 0.0 | 0.0 | 0.0 | 0.0 | 0.0 |
| 1 | exactEarth Ltd. | http://ca.indeed.com/pagead/clk?mo=r&ad=-6NYlb... | NaN | Data Scientist | NaN | about usexactearth is a data services company ... | 0.0 | 0.0 | 0.0 | 0.0 | ... | 0.0 | 0.0 | 0.0 | 0.0 | 0.0 | 0.0 | 0.0 | 0.0 | 0.0 | 0.0 |
| 2 | Biolab Pharma | http://ca.indeed.com/pagead/clk?mo=r&ad=-6NYlb... | NaN | Associate Scientist Formulation Development | $54,000 - $66,000 a year | the formulation development associate scientis... | 0.0 | 0.0 | 0.0 | 0.0 | ... | 0.0 | 0.0 | 0.0 | 0.0 | 0.0 | 0.0 | 0.0 | 0.0 | 0.0 | 0.0 |
| 3 | Canada Infrastructure Bank | http://ca.indeed.com/pagead/clk?mo=r&ad=-6NYlb... | NaN | Analyst, Investments | NaN | headquartered in toronto the canada infrastruc... | 0.0 | 0.0 | 0.0 | 0.0 | ... | 0.0 | 0.0 | 0.0 | 0.0 | 0.0 | 0.0 | 0.0 | 0.0 | 0.0 | 0.0 |
| 4 | Reconnect Community Health Services | http://ca.indeed.com/pagead/clk?mo=r&ad=-6NYlb... | NaN | Decision Support Junior Analyst | $17 an hour | positions available: 3compensation: $17.00 per... | 0.0 | 0.0 | 0.0 | 0.0 | ... | 0.0 | 0.0 | 0.0 | 0.0 | 0.0 | 0.0 | 0.0 | 0.0 | 0.0 | 0.0 |
| ... | ... | ... | ... | ... | ... | ... | ... | ... | ... | ... | ... | ... | ... | ... | ... | ... | ... | ... | ... | ... | ... |
| 1264 | The Mason Group | http://ca.indeed.com/pagead/clk?mo=r&ad=-6NYlb... | NaN | Financial Analyst | $70,000 - $80,000 a year | do you have an interest in working for a globa... | 0.0 | 0.0 | 0.0 | 0.0 | ... | 0.0 | 0.0 | 0.0 | 0.0 | 0.0 | 0.0 | 0.0 | 0.0 | 0.0 | 0.0 |
| 1265 | International Financial Group | http://ca.indeed.com/pagead/clk?mo=r&ad=-6NYlb... | NaN | Cyber Fraud Risk Analyst | NaN | position title: cyber fraud risk analyst\nposi... | 0.0 | 0.0 | 0.0 | 0.0 | ... | 0.0 | 0.0 | 0.0 | 0.0 | 0.0 | 0.0 | 0.0 | 0.0 | 0.0 | 0.0 |
| 1266 | Loblaw Digital | http://ca.indeed.com/pagead/clk?mo=r&ad=-6NYlb... | NaN | Senior marketing analyst, sdm ecommerce, Toronto | NaN | please apply on isarta\n\ncompany :\n\nloblaw ... | 0.0 | 0.0 | 0.0 | 0.0 | ... | 0.0 | 0.0 | 0.0 | 0.0 | 0.0 | 0.0 | 0.0 | 0.0 | 0.0 | 0.0 |
| 1267 | Robert Half | http://ca.indeed.com/pagead/clk?mo=r&ad=-6NYlb... | NaN | Sr. Financial Analyst | $80,000 - $90,000 a year | robert half finance & accounting is currently ... | 0.0 | 0.0 | 0.0 | 0.0 | ... | 0.0 | 0.0 | 0.0 | 0.0 | 0.0 | 0.0 | 0.0 | 0.0 | 0.0 | 0.0 |
| 1268 | Accountivity | http://ca.indeed.com/pagead/clk?mo=r&ad=-6NYlb... | NaN | Financial Analyst | $17 - $21 an hour | job title: financial analyst\nlocation: niagar... | 0.0 | 0.0 | 0.0 | 0.0 | ... | 0.0 | 0.0 | 0.0 | 0.0 | 0.0 | 0.0 | 0.0 | 0.0 | 0.0 | 0.0 |
1269 rows × 67 columns
# Helper function for extracting the skills from job description
def extract_skills():
    for i in range(len(job_info_df)):
        for s in skills :
            # This is specifically for C++, escape the ++. Convert C++ to C\+\+
            if any(x in s for x in ['+']):
                skill = re.escape(s)
            else:
                skill = s
            description = job_info_df.loc[i, 'description']
            matching = re.search(r'(?:^|(?<=\s))' + skill + r'(?=\s|$)',description)

            if matching:
                job_info_df[s][i] = 1
#print("matched skill ",s, "for job ",str(i+1))extract_skills()# remove columns other than skills
indeed_skills = job_info_df.drop(['employer', 'link', 'location', 'position_title', 'salary', 'description'], axis=1)
indeed_skills.head().dataframe tbody tr th {
vertical-align: top;
}
.dataframe thead th {
text-align: right;
}
| excel | communication | teamwork | critical thinking | presentation | marketing | leadership | time management | collaborate | organize | ... | data extraction | feature engineering | powercenter | informatica | azure | rapidminer | h2o.ai | datarobot | api | etl | |
|---|---|---|---|---|---|---|---|---|---|---|---|---|---|---|---|---|---|---|---|---|---|
| 0 | 1.0 | 1.0 | 0.0 | 0.0 | 0.0 | 0.0 | 1.0 | 0.0 | 0.0 | 0.0 | ... | 0.0 | 0.0 | 0.0 | 0.0 | 0.0 | 0.0 | 0.0 | 0.0 | 0.0 | 0.0 |
| 1 | 0.0 | 0.0 | 0.0 | 0.0 | 1.0 | 1.0 | 0.0 | 0.0 | 0.0 | 0.0 | ... | 0.0 | 0.0 | 0.0 | 0.0 | 0.0 | 0.0 | 0.0 | 0.0 | 0.0 | 0.0 |
| 2 | 0.0 | 1.0 | 0.0 | 0.0 | 0.0 | 0.0 | 0.0 | 0.0 | 0.0 | 0.0 | ... | 0.0 | 0.0 | 0.0 | 0.0 | 0.0 | 0.0 | 0.0 | 0.0 | 0.0 | 0.0 |
| 3 | 0.0 | 1.0 | 0.0 | 0.0 | 1.0 | 0.0 | 0.0 | 0.0 | 0.0 | 0.0 | ... | 0.0 | 0.0 | 0.0 | 0.0 | 0.0 | 0.0 | 0.0 | 0.0 | 0.0 | 0.0 |
| 4 | 0.0 | 1.0 | 0.0 | 0.0 | 0.0 | 0.0 | 1.0 | 0.0 | 0.0 | 0.0 | ... | 0.0 | 0.0 | 0.0 | 0.0 | 0.0 | 0.0 | 0.0 | 0.0 | 0.0 | 0.0 |
5 rows × 61 columns
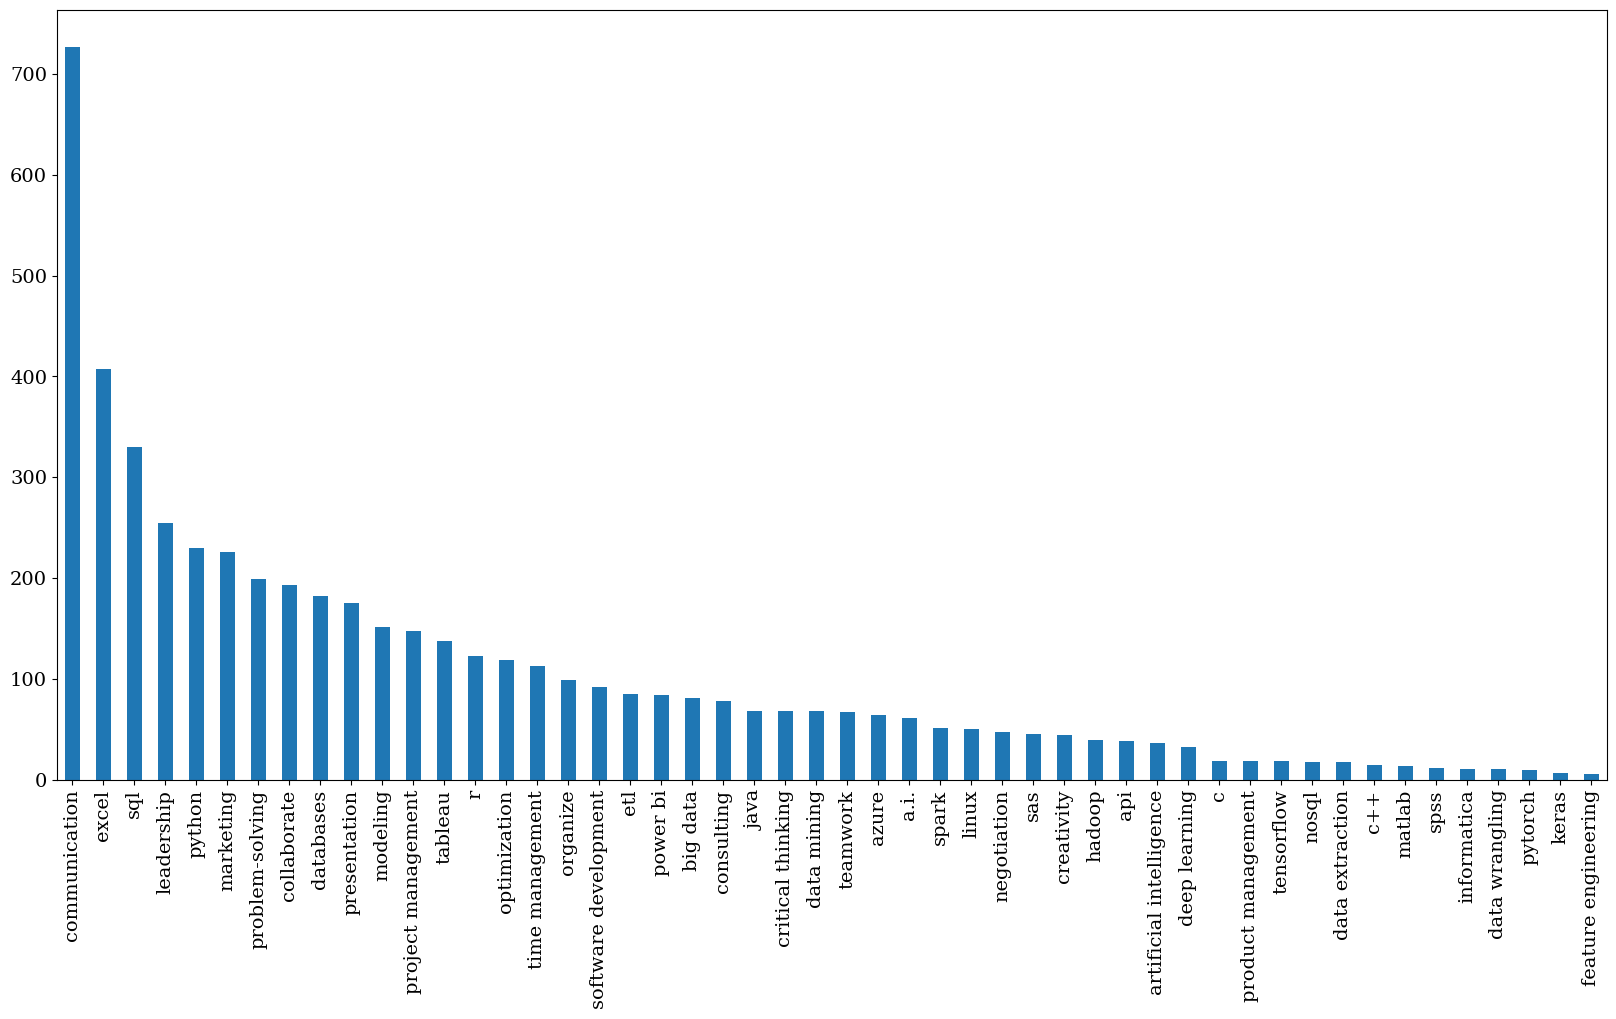
# Visualize the frequency of the skills in indeed job postings
plt.figure(figsize=(20,10))
ax = indeed_skills.sum().sort_values(ascending=False)[:50].plot(kind="bar")
plt.show()
#Remove skills that are not found in indeed job postings
indeed_df = indeed_skills.drop(columns=indeed_skills.columns[indeed_skills.sum()==0])
indeed_df.head().dataframe tbody tr th {
vertical-align: top;
}
.dataframe thead th {
text-align: right;
}
| excel | communication | teamwork | critical thinking | presentation | marketing | leadership | time management | collaborate | organize | ... | nosql | linux | big data | data wrangling | data extraction | feature engineering | informatica | azure | api | etl | |
|---|---|---|---|---|---|---|---|---|---|---|---|---|---|---|---|---|---|---|---|---|---|
| 0 | 1.0 | 1.0 | 0.0 | 0.0 | 0.0 | 0.0 | 1.0 | 0.0 | 0.0 | 0.0 | ... | 0.0 | 0.0 | 0.0 | 0.0 | 0.0 | 0.0 | 0.0 | 0.0 | 0.0 | 0.0 |
| 1 | 0.0 | 0.0 | 0.0 | 0.0 | 1.0 | 1.0 | 0.0 | 0.0 | 0.0 | 0.0 | ... | 0.0 | 1.0 | 1.0 | 0.0 | 0.0 | 0.0 | 0.0 | 0.0 | 0.0 | 0.0 |
| 2 | 0.0 | 1.0 | 0.0 | 0.0 | 0.0 | 0.0 | 0.0 | 0.0 | 0.0 | 0.0 | ... | 0.0 | 0.0 | 0.0 | 0.0 | 0.0 | 0.0 | 0.0 | 0.0 | 0.0 | 0.0 |
| 3 | 0.0 | 1.0 | 0.0 | 0.0 | 1.0 | 0.0 | 0.0 | 0.0 | 0.0 | 0.0 | ... | 0.0 | 0.0 | 0.0 | 0.0 | 0.0 | 0.0 | 0.0 | 0.0 | 0.0 | 0.0 |
| 4 | 0.0 | 1.0 | 0.0 | 0.0 | 0.0 | 0.0 | 1.0 | 0.0 | 0.0 | 0.0 | ... | 0.0 | 0.0 | 0.0 | 0.0 | 0.0 | 0.0 | 0.0 | 0.0 | 0.0 | 0.0 |
5 rows × 54 columns
from sklearn.metrics import pairwise
cos_similarity_matrix=pairwise.cosine_similarity(indeed_df.T)# Compute cosine similarity between all samples in indeed data
cos_similarity=pd.DataFrame(cos_similarity_matrix,columns=indeed_df.columns, index=indeed_df.columns)
distance_between_skills=cos_similarity.apply(lambda col: (1-col))
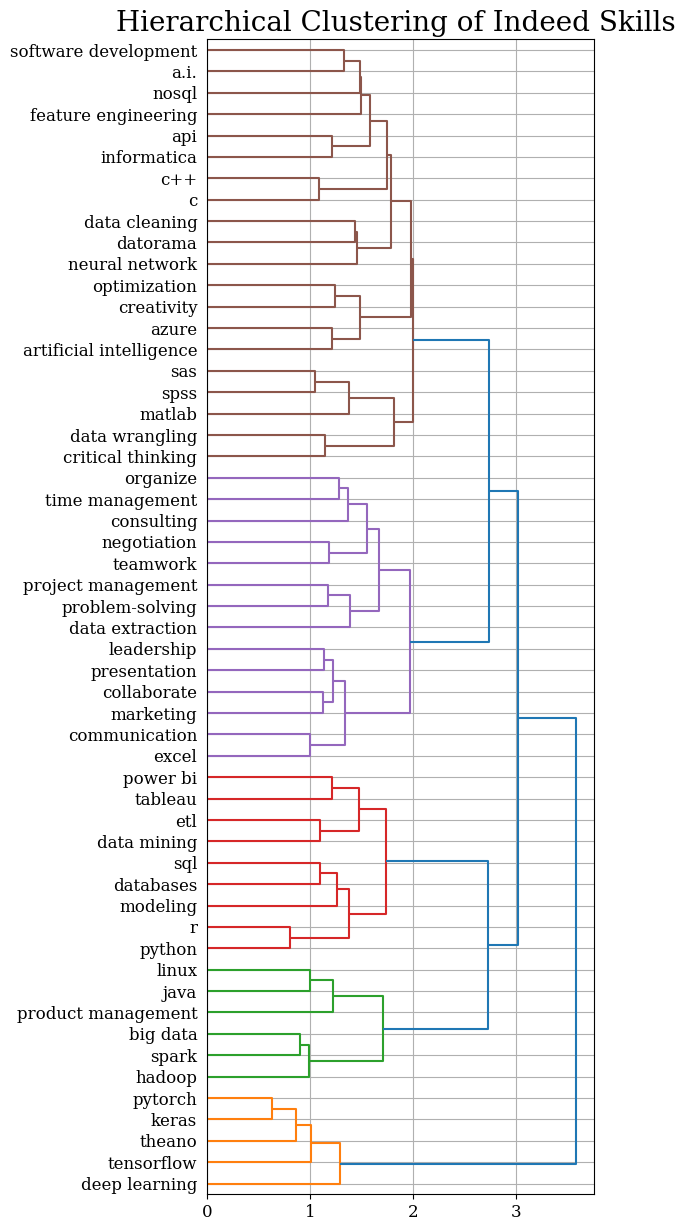
from scipy.cluster.hierarchy import dendrogram, linkage
# Method 'ward' requires the distance metric to be Euclidean
Z = linkage(distance_between_skills, method='ward', metric='euclidean')
fig = plt.figure(figsize=(5, 15))
font = {'font.family' : 'serif',
'font.size' : 22,
'font.weight' : 'normal'}
plt.rcParams.update(font)
plt.grid(True)
# First define the leaf label function.
n=distance_between_skills.shape[0]
labels=distance_between_skills.columns.values.tolist()
def llf(id):
if id < n:
return labels[id]
else:
return '[%d]' % (id)
# The text for the leaf nodes is going to be big so force
# a rotation of 90 degrees.
dendrogram(Z, orientation='right', leaf_label_func=llf,leaf_font_size=10)
ax = plt.gca()
ax.tick_params(axis='x', labelsize=12)
ax.tick_params(axis='y', labelsize=12)
plt.title("Hierarchical Clustering of Indeed Skills ",fontsize=20)Text(0.5, 1.0, 'Hierarchical Clustering of Indeed Skills ')
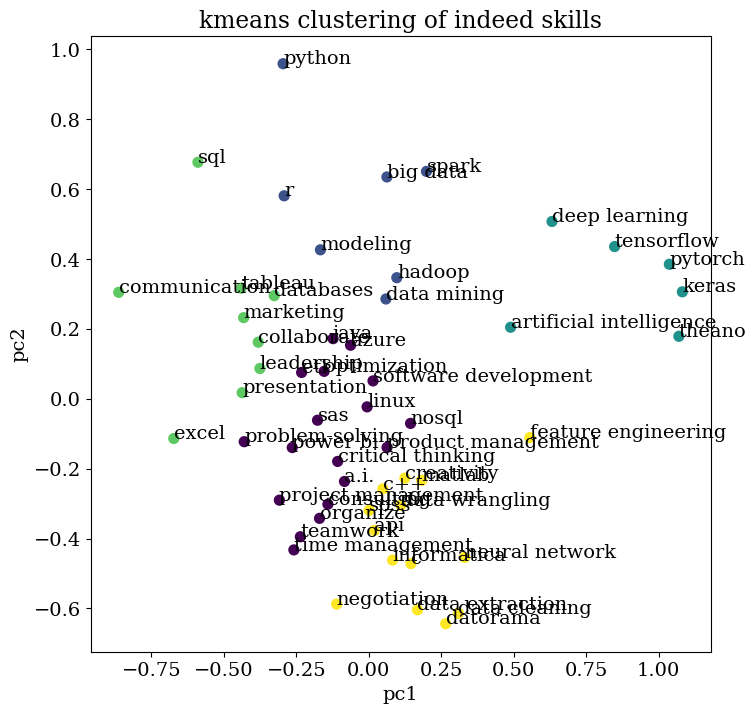
from sklearn.cluster import KMeans
from sklearn.decomposition import PCA
#PCA reduce dimensionality to visualize clustering
# k-means clustering
sklearn_pca = PCA(n_components = 2)
Y_sklearn = sklearn_pca.fit_transform(distance_between_skills)
kmeans = KMeans(n_clusters=5, algorithm = 'auto')
kmeans.fit(Y_sklearn)
prediction = kmeans.predict(Y_sklearn)fig = plt.figure(figsize=(10, 10))
#plt.scatter(Y_sklearn[:, 0], Y_sklearn[:, 1], c=prediction, s=50, cmap='viridis')
x=Y_sklearn[:, 0]
y=Y_sklearn[:, 1]
label = distance_between_skills.index.values
fig, ax = plt.subplots()
ax.scatter(x, y, c=prediction, s=50, cmap='viridis')
plt.rcParams["figure.figsize"] = [8,8]
for i, txt in enumerate(label):
ax.annotate(txt, (x[i], y[i]))
centers = fitted.cluster_centers_
#plt.scatter(centers[:, 0], centers[:, 1],c='grey', s=300, alpha=0.6);
plt.title("kmeans clustering of indeed skills")
plt.xlabel("pc1")
plt.ylabel("pc2")Text(0, 0.5, 'pc2')
<Figure size 1000x1000 with 0 Axes>
from sklearn.feature_extraction.text import TfidfTransformer
from sklearn.preprocessing import normalize
# use PCA to reduce the dimension to 2
sklearn_pca = PCA(n_components = 2)
Y_sklearn = sklearn_pca.fit_transform(distance_between_skills)
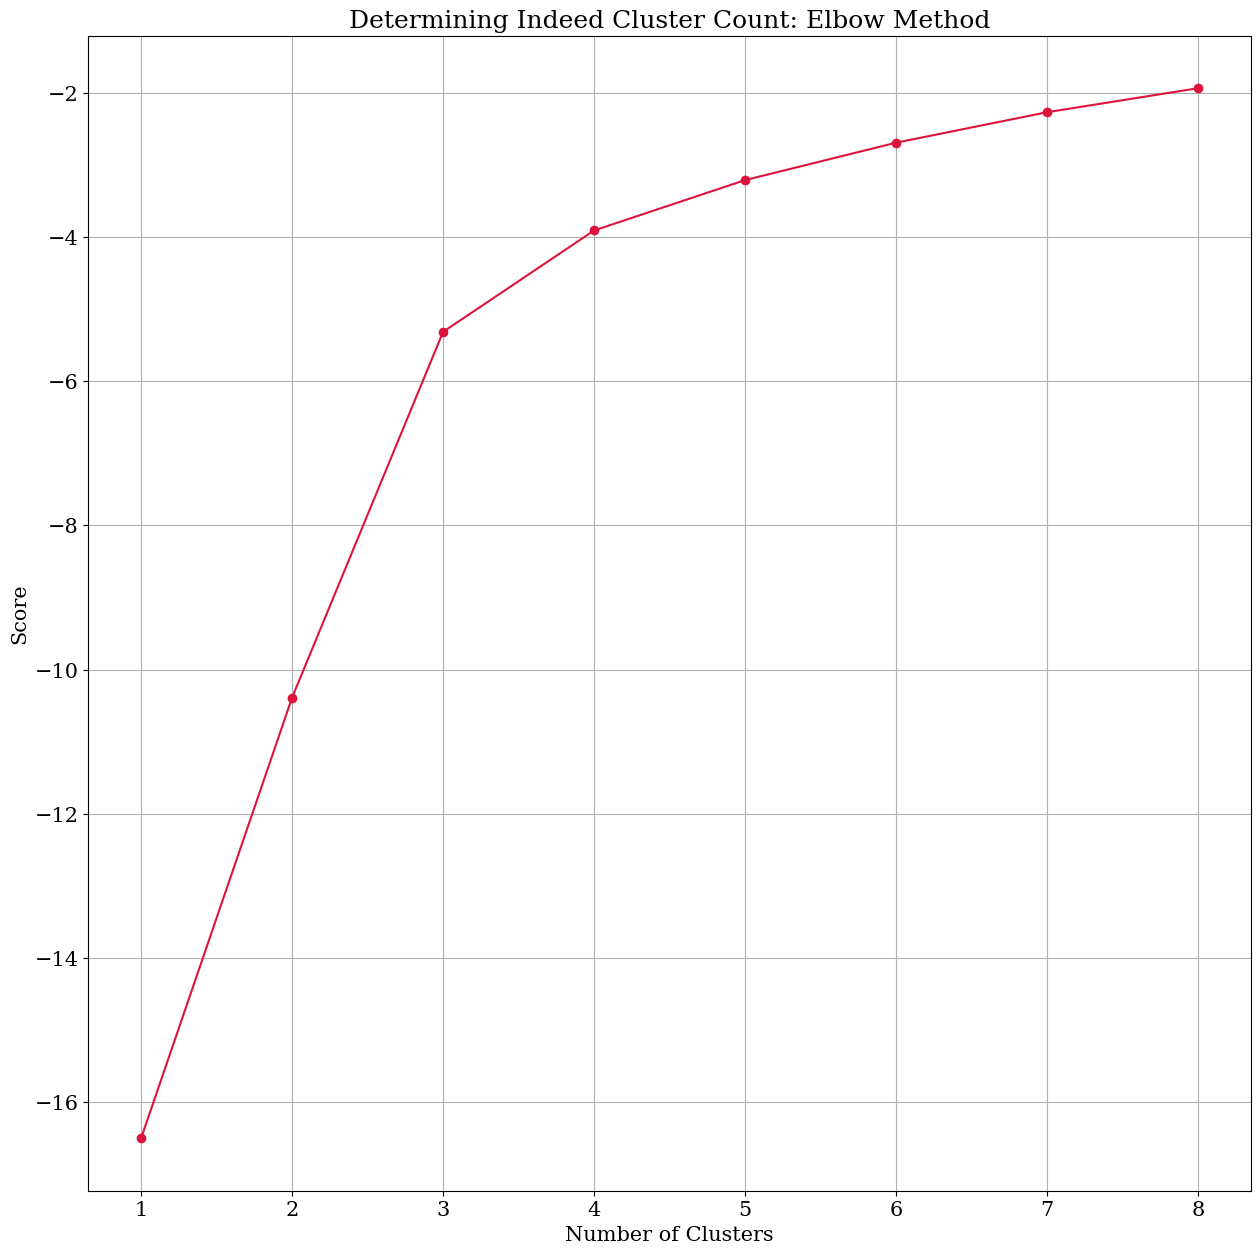
number_clusters = range(1, 9)
kmeans = [KMeans(n_clusters=i, max_iter = 600) for i in number_clusters]
# kmeans
score = [kmeans[i].fit(Y_sklearn).score(Y_sklearn) for i in range(len(kmeans))]
# score
plt.figure(figsize=(15, 15))
plt.plot(number_clusters, score,marker='o', color="crimson")
plt.xlabel('Number of Clusters')
plt.ylabel('Score')
plt.title('Determining Indeed Cluster Count: Elbow Method')
font = {'font.family' : 'serif',
'font.size' : 22,
'font.weight' : 'normal'}
plt.rcParams.update(font)
plt.grid(True)
plt.show()#PCA reduce dimensionality to visualize clustering
# k-means clustering
sklearn_pca = PCA(n_components = 2)
Y_sklearn = sklearn_pca.fit_transform(distance_between_skills)
kmeans = KMeans(n_clusters=5, algorithm = 'auto')
kmeans.fit(Y_sklearn)
prediction = kmeans.predict(Y_sklearn)# use TF-IDF to evaluate the frequency of kaggle skills
tfidfTran = TfidfTransformer(norm=None)
tf_idf = tfidfTran.fit_transform(kaggle_skills.values)
# normalize each frequency
tf_idf_norm = normalize(tf_idf)
tf_idf_array = tf_idf_norm.toarray()
tf_idf_arrayarray([[0.20029316, 0.34454841, 0.29503565, ..., 0. , 0. ,
0. ],
[0. , 0. , 0. , ..., 0. , 0. ,
0. ],
[0. , 0. , 0. , ..., 0. , 0. ,
0. ],
...,
[0. , 0. , 0. , ..., 0. , 0. ,
0. ],
[0. , 0. , 0. , ..., 0. , 0. ,
0. ],
[0.19163095, 0. , 0.28227604, ..., 0. , 0. ,
0. ]])
tf_idf_df = pd.DataFrame(tf_idf_array, columns=kaggle_skills.columns).head()# PCA reduce dimensionality to visualize clustering
# k-means clustering
sklearn_pca = PCA(n_components = 2)
Y_sklearn = sklearn_pca.fit_transform(tf_idf_array)
kmeans = KMeans(n_clusters=6, max_iter=600, algorithm = 'auto')
fitted = kmeans.fit(Y_sklearn)
prediction = kmeans.predict(Y_sklearn)plt.figure(figsize=(20, 20))
font = {'font.family' : 'serif',
'font.size' : 22,
'font.weight' : 'normal'}
plt.rcParams.update(font)
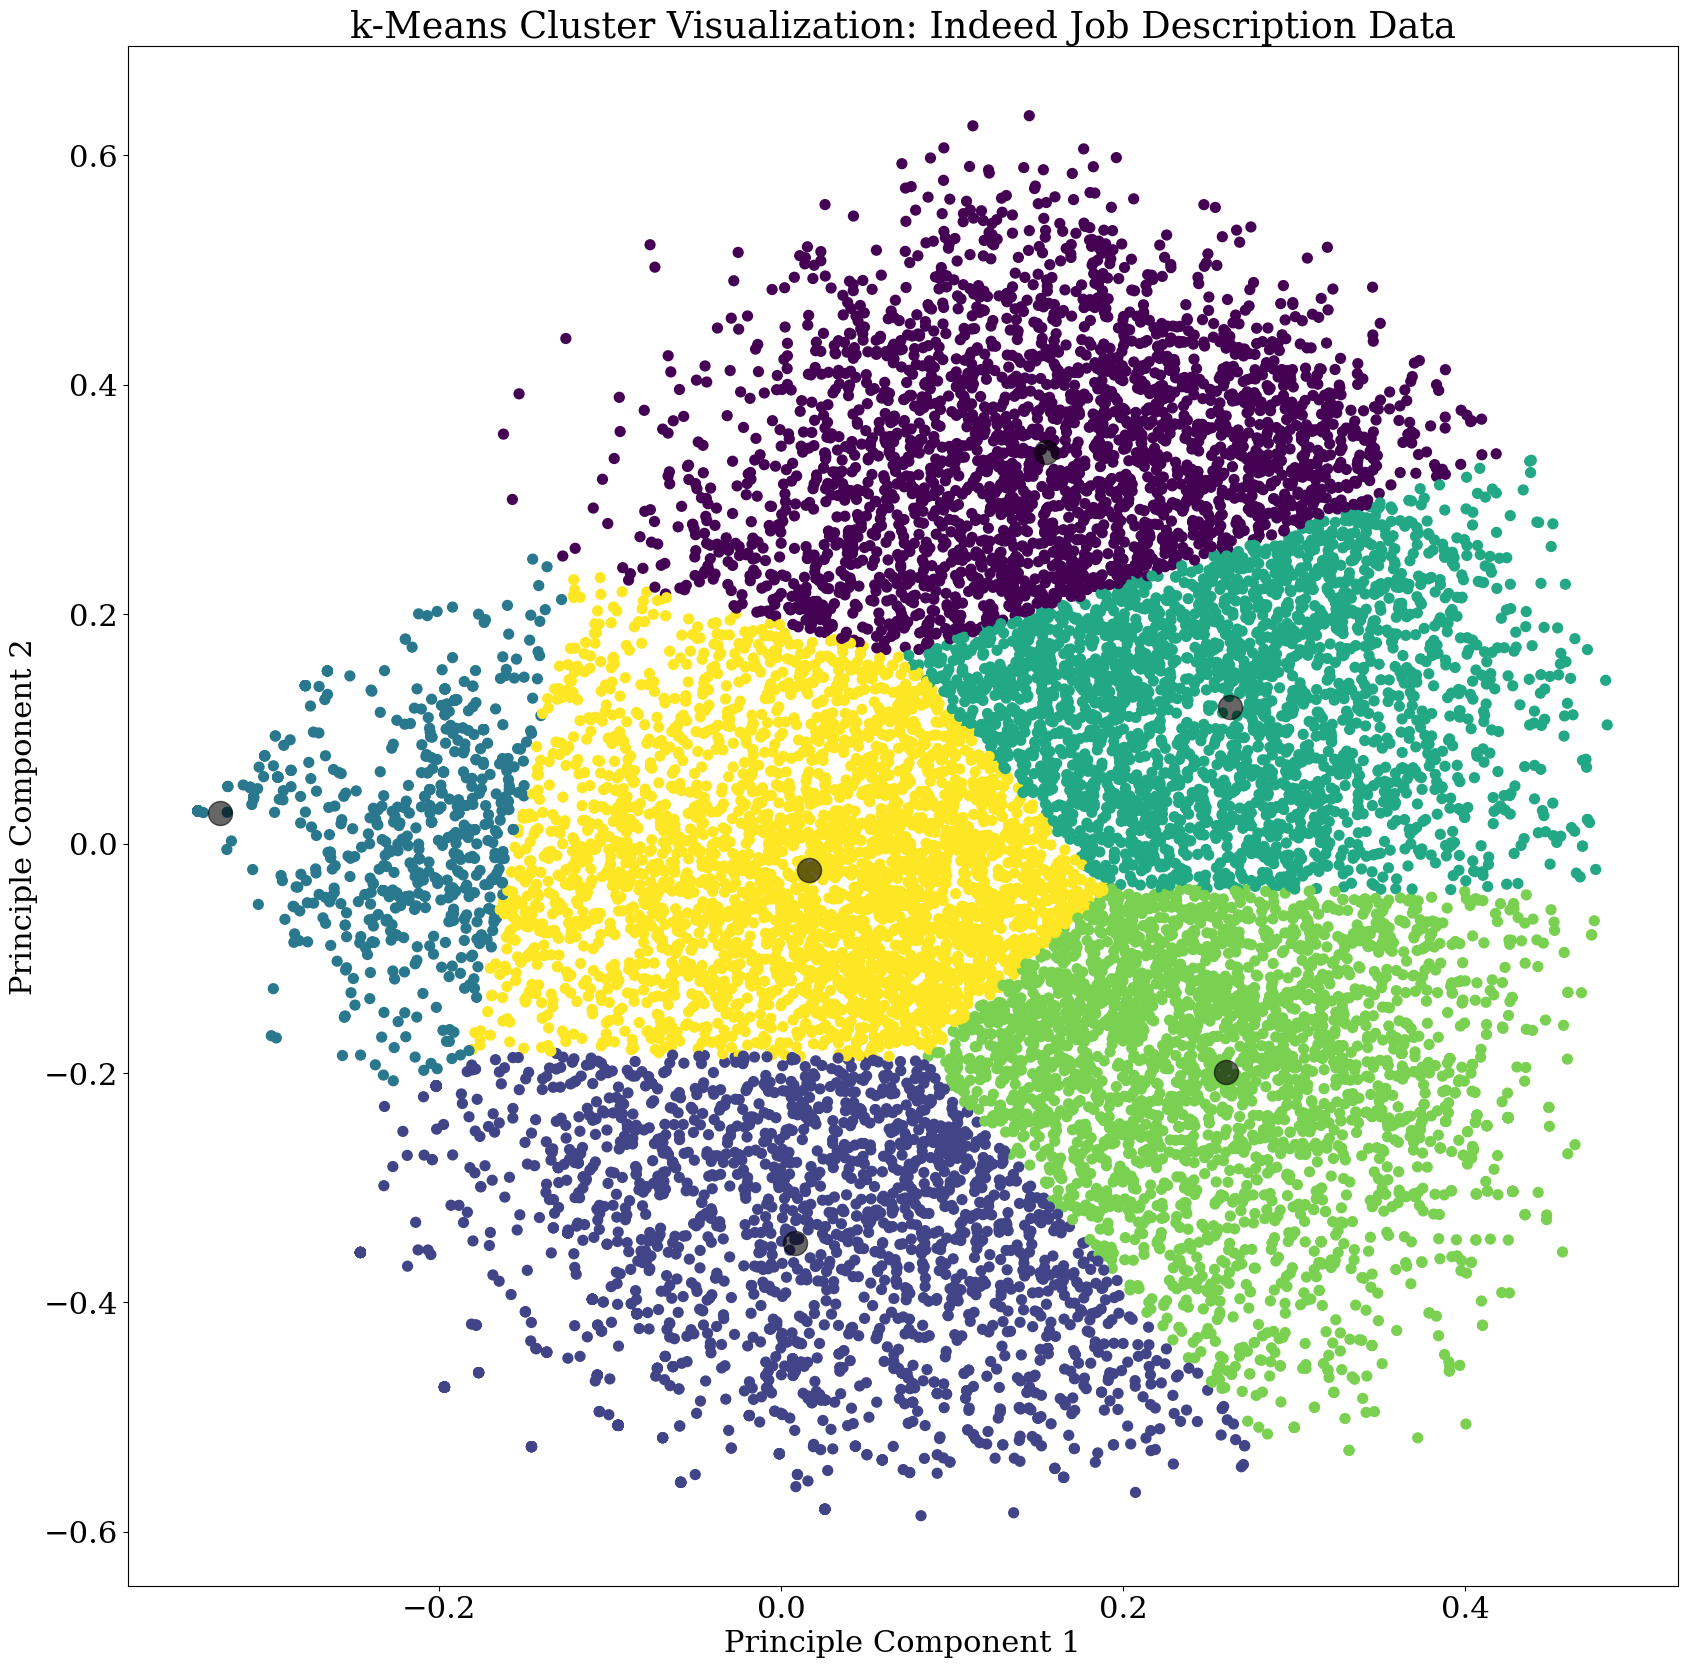
plt.scatter(Y_sklearn[:, 0], Y_sklearn[:, 1], c=prediction, s=50, cmap='viridis')
plt.title("k-Means Cluster Visualization: Indeed Job Description Data")
plt.xlabel("Principle Component 1")
plt.ylabel("Principle Component 2")
centers = fitted.cluster_centers_
plt.scatter(centers[:, 0], centers[:, 1],c='black', s=300, alpha=0.6)<matplotlib.collections.PathCollection at 0x1581ffb0fd0>
import numpy as np
import matplotlib.pyplot as plt
from mpl_toolkits.mplot3d import Axes3D
from sklearn.decomposition import PCA
from sklearn.preprocessing import StandardScaler
from sklearn.preprocessing import MaxAbsScaler
#Standardize data
scaled = StandardScaler().fit_transform(indeed_skills)# use PCA to reduce the dimension to 3
pca = PCA(n_components=3, svd_solver='full')PC_scores = pca.fit_transform(scaled)scores_pd = pd.DataFrame(data = PC_scores
,columns = ['PC1', 'PC2', 'PC3'])scores_pd.dataframe tbody tr th {
vertical-align: top;
}
.dataframe thead th {
text-align: right;
}
| PC1 | PC2 | PC3 | |
|---|---|---|---|
| 0 | -1.676329 | 1.155205 | 0.694676 |
| 1 | 6.025748 | -5.195273 | 10.119855 |
| 2 | -0.968903 | 0.427692 | 0.362807 |
| 3 | -1.032450 | 0.521395 | 0.863298 |
| 4 | -1.203176 | 0.902230 | 0.405145 |
| ... | ... | ... | ... |
| 1264 | -0.167060 | -0.870812 | -1.410856 |
| 1265 | 3.757479 | -2.308775 | 0.543477 |
| 1266 | 2.443237 | -3.751268 | -4.293080 |
| 1267 | -0.710922 | 0.525267 | 1.158982 |
| 1268 | -1.946912 | 1.080835 | 0.271721 |
1269 rows × 3 columns
loadings_pd = pd.DataFrame(data = pca.components_.T
                           ,columns = ['PC1', 'PC2', 'PC3']
                           ,index = indeed_skills.columns)
# function to plot how each skill is affected by principal components
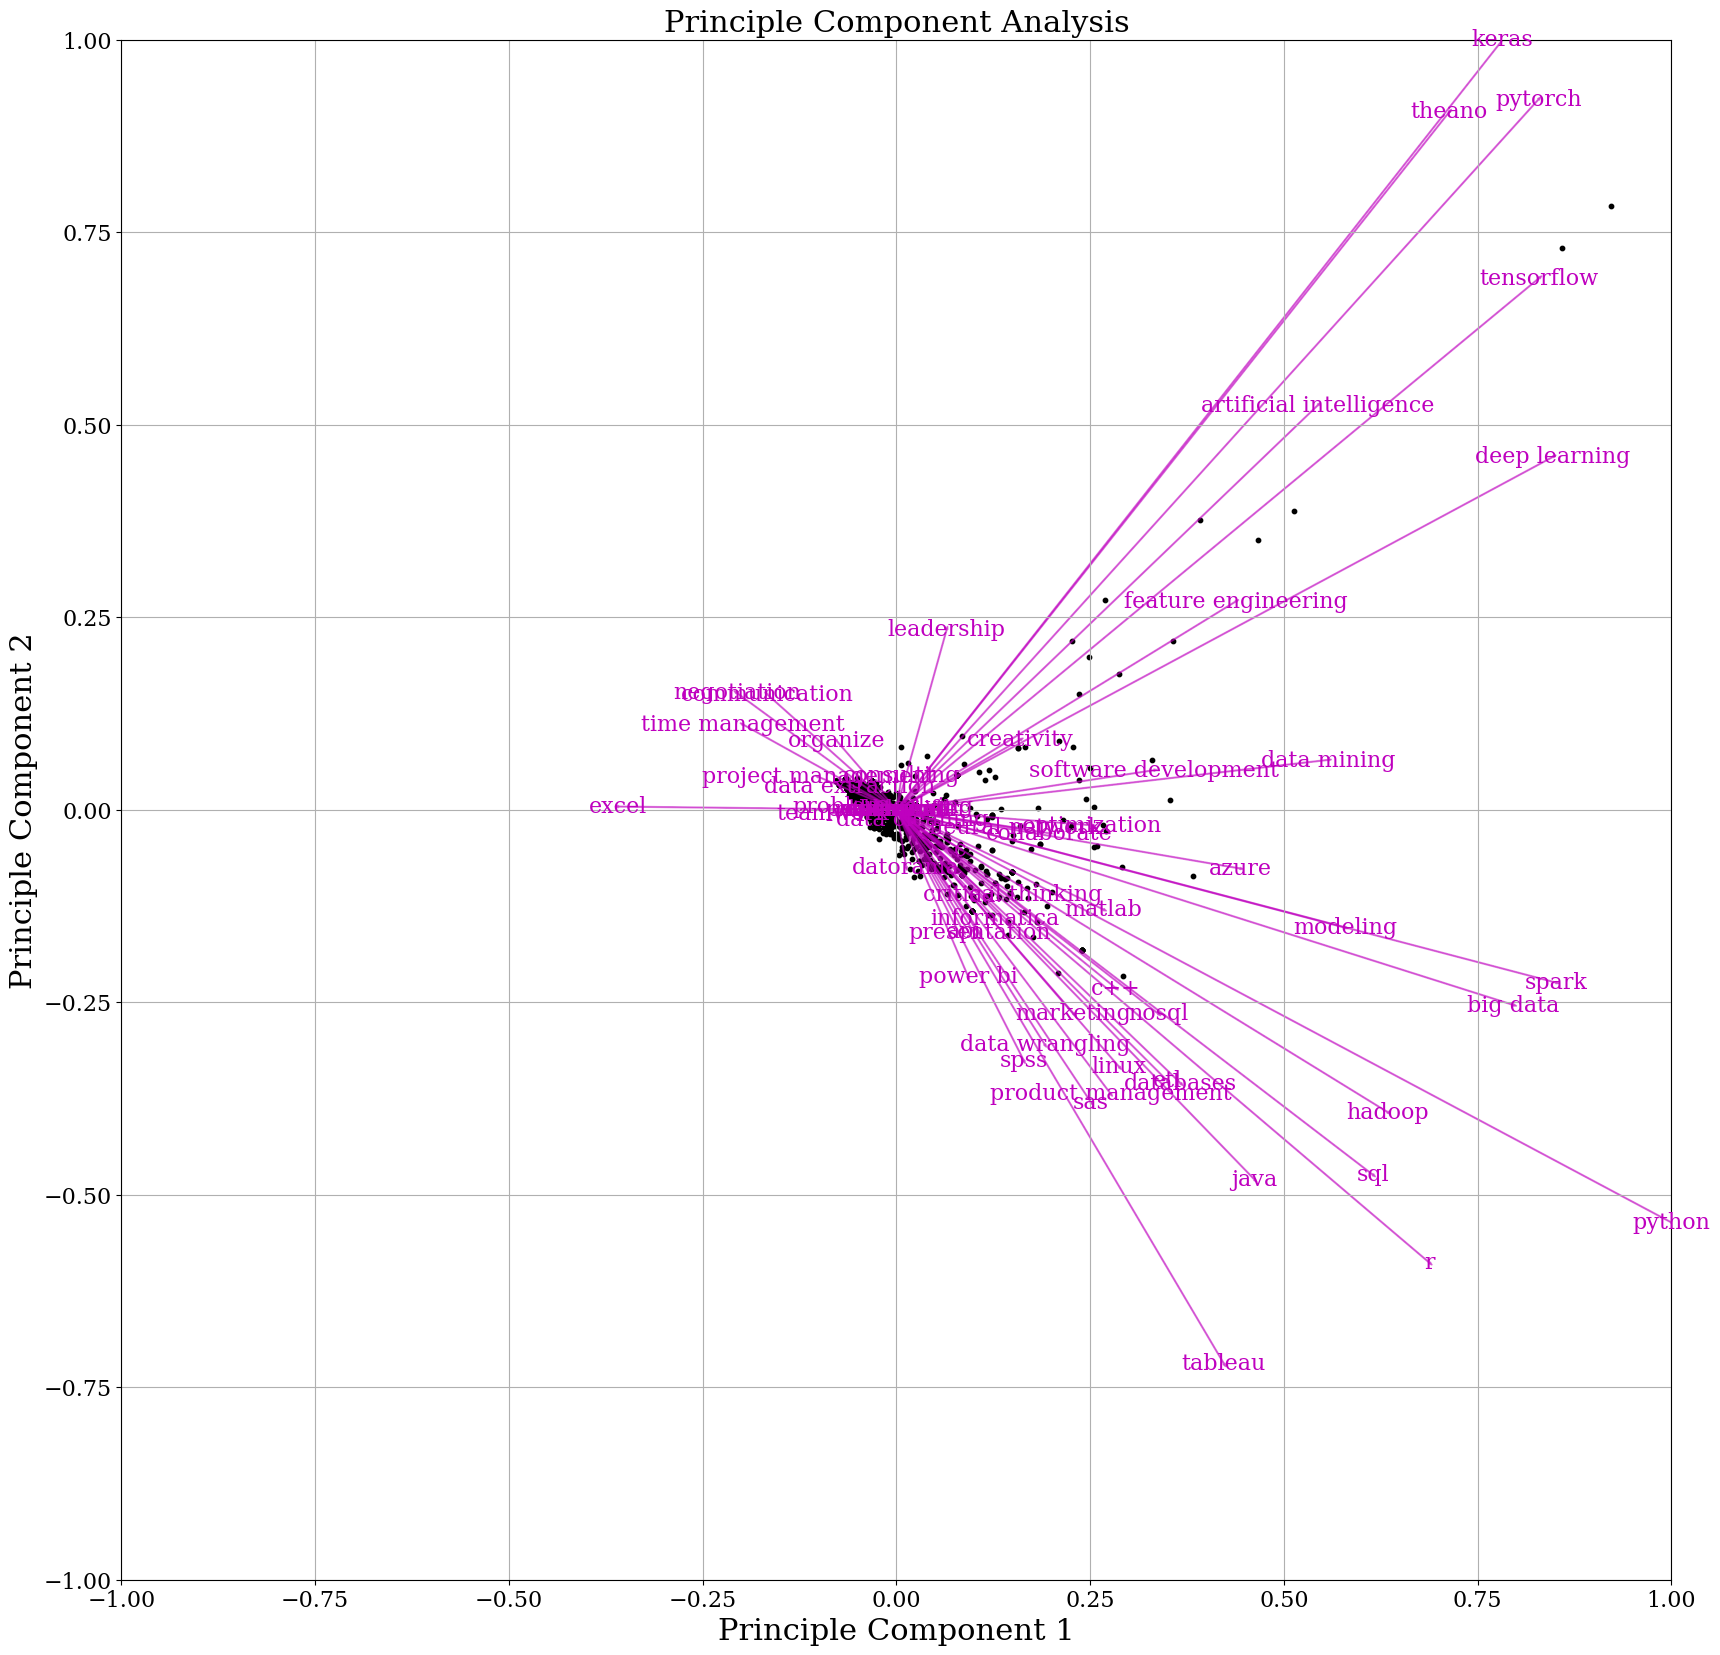
def myplot(scores,loadings,loading_labels=None,score_labels=None):
# adjusting the scores to fit in (-1,1)
xt = scores[:,0]
yt = scores[:,1]
n = loadings.shape[0]
scalext = 1.0/(xt.max() - xt.min())
scaleyt = 1.0/(yt.max() - yt.min())
xt_scaled = xt * scalext
yt_scaled = yt * scaleyt
# adjusting the loadings to fit in (-1,1)
p = loadings
p_scaled = MaxAbsScaler().fit_transform(p)
plt.scatter(xt * scalext,yt * scaleyt, s=10,color='k')
for i in range(n):
plt.arrow(0, 0, p_scaled[i,0], p_scaled[i,1], color = 'm',alpha = 0.5)
if loading_labels is None:
plt.text(p_scaled[i,0], p_scaled[i,1], "Var"+str(i+1), color = 'g', ha = 'center', va = 'center')
else:
plt.text(p_scaled[i,0], p_scaled[i,1], loading_labels[i], color = 'm', ha = 'center', va = 'center', size=16)
plt.xlim(-1,1)
plt.ylim(-1,1)
plt.title("Principle Component Analysis",fontsize=22)
plt.tick_params(labelsize=16)
plt.grid()plt.rcParams["figure.figsize"] = [20,20]
myplot(PC_scores[:,:2],loadings_pd.iloc[:,:2],loading_labels=loadings_pd.index,score_labels=scores_pd.index)
plt.xlabel("Principle Component 1")
plt.ylabel("Principle Component 2")
font = {'font.family' : 'serif',
'font.size' : 18,
'font.weight' : 'normal'}
plt.rcParams.update(font)
plt.show()def get_top_features_cluster(tf_idf_array, prediction, n_feats):
labels = np.unique(prediction)
dfs = []
for label in labels:
id_temp = np.where(prediction==label) # indices for each cluster
x_means = np.mean(tf_idf_array[id_temp], axis = 0) # returns average score across cluster
sorted_means = np.argsort(x_means)[::-1][:n_feats] # indices with top 20 scores
features = kaggle_skills.columns.values
best_features = [(features[i], x_means[i]) for i in sorted_means]
df = pd.DataFrame(best_features, columns = ['features', 'score'])
dfs.append(df)
return dfs
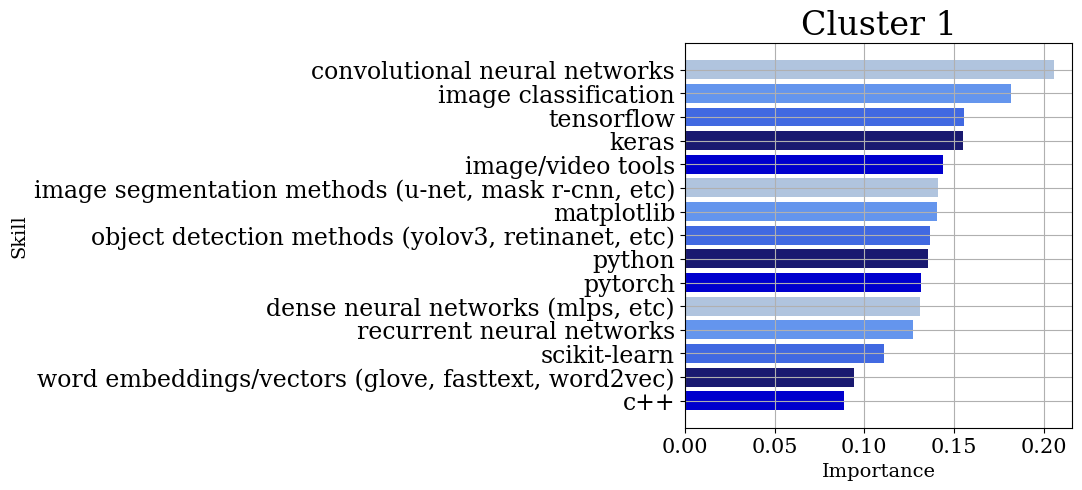
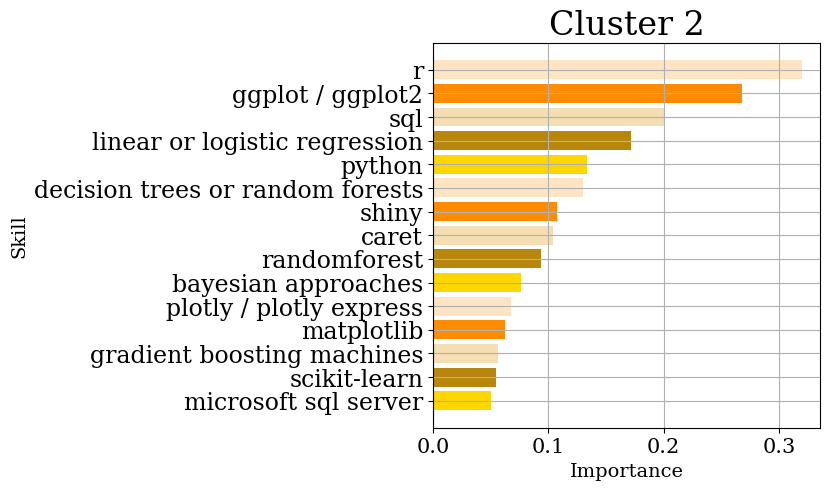
dfs = get_top_features_cluster(tf_idf_array, prediction, 15)dfs[ features score
0 convolutional neural networks 0.205498
1 image classification 0.181419
2 tensorflow 0.155251
3 keras 0.154766
4 image/video tools 0.143932
5 image segmentation methods (u-net, mask r-cnn,... 0.141113
6 matplotlib 0.140692
7 object detection methods (yolov3, retinanet, etc) 0.136463
8 python 0.135161
9 pytorch 0.131429
10 dense neural networks (mlps, etc) 0.130771
11 recurrent neural networks 0.127091
12 scikit-learn 0.110949
13 word embeddings/vectors (glove, fasttext, word... 0.094268
14 c++ 0.088446,
features score
0 r 0.319782
1 ggplot / ggplot2 0.268143
2 sql 0.200299
3 linear or logistic regression 0.171582
4 python 0.133161
5 decision trees or random forests 0.130376
6 shiny 0.107111
7 caret 0.103966
8 randomforest 0.093472
9 bayesian approaches 0.076171
10 plotly / plotly express 0.067813
11 matplotlib 0.062540
12 gradient boosting machines 0.056546
13 scikit-learn 0.054921
14 microsoft sql server 0.050142,
features score
0 javascript 0.014698
1 java 0.013218
2 c++ 0.011280
3 python 0.010743
4 sql 0.009925
5 c 0.009189
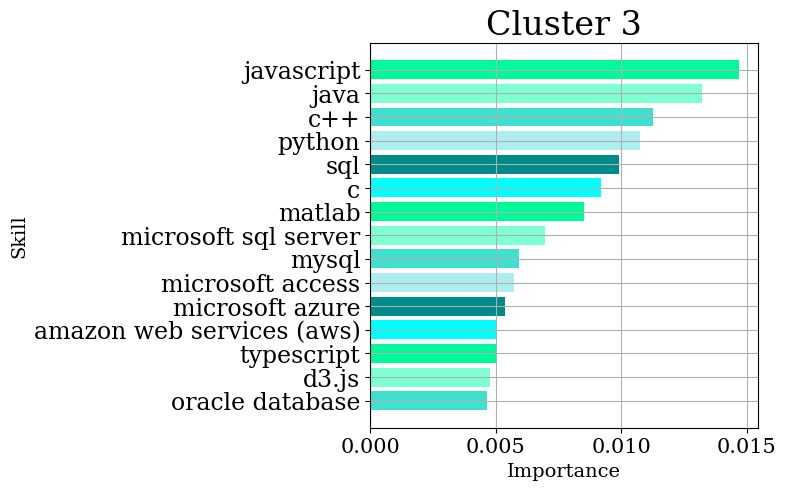
6 matlab 0.008524
7 microsoft sql server 0.006974
8 mysql 0.005943
9 microsoft access 0.005719
10 microsoft azure 0.005352
11 amazon web services (aws) 0.005049
12 typescript 0.005006
13 d3.js 0.004775
14 oracle database 0.004646,
features score
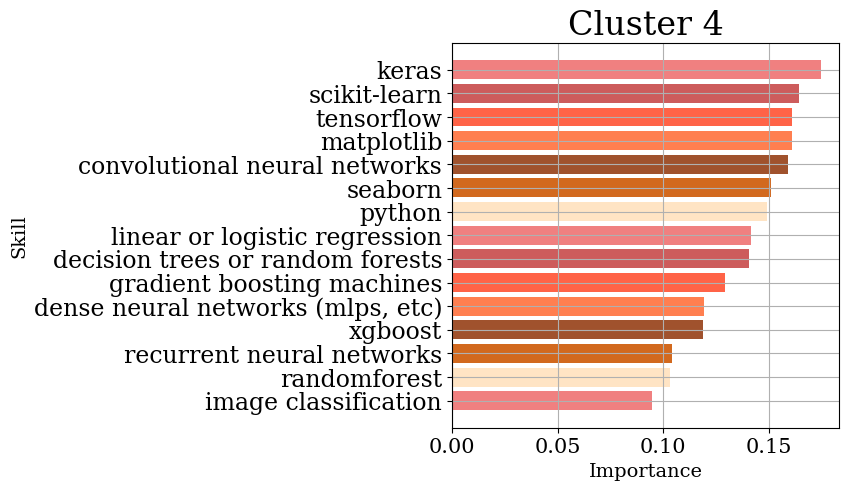
0 keras 0.174569
1 scikit-learn 0.164256
2 tensorflow 0.161053
3 matplotlib 0.160850
4 convolutional neural networks 0.158975
5 seaborn 0.151097
6 python 0.148841
7 linear or logistic regression 0.141510
8 decision trees or random forests 0.140684
9 gradient boosting machines 0.129275
10 dense neural networks (mlps, etc) 0.119443
11 xgboost 0.118611
12 recurrent neural networks 0.103982
13 randomforest 0.102957
14 image classification 0.094499,
features score
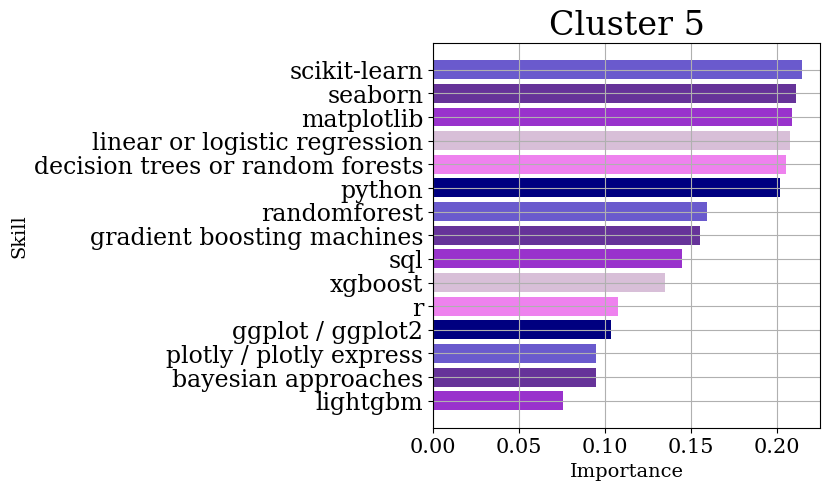
0 scikit-learn 0.214456
1 seaborn 0.211092
2 matplotlib 0.208848
3 linear or logistic regression 0.207684
4 decision trees or random forests 0.205272
5 python 0.201496
6 randomforest 0.159142
7 gradient boosting machines 0.155180
8 sql 0.144778
9 xgboost 0.134989
10 r 0.107646
11 ggplot / ggplot2 0.103375
12 plotly / plotly express 0.094567
13 bayesian approaches 0.094551
14 lightgbm 0.075858,
features score
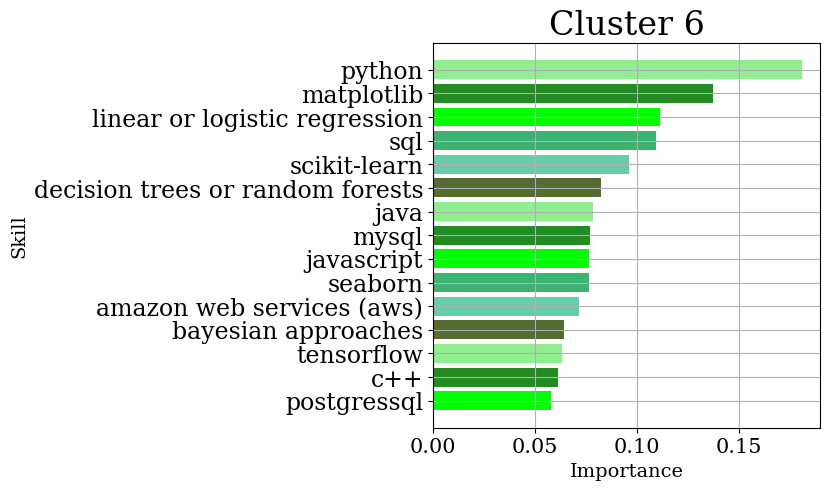
0 python 0.181032
1 matplotlib 0.137194
2 linear or logistic regression 0.111168
3 sql 0.109554
4 scikit-learn 0.096255
5 decision trees or random forests 0.082565
6 java 0.078567
7 mysql 0.077133
8 javascript 0.076773
9 seaborn 0.076353
10 amazon web services (aws) 0.071577
11 bayesian approaches 0.064348
12 tensorflow 0.063227
13 c++ 0.061594
14 postgressql 0.058118]
my_color_matrix = [
    ["lightsteelblue", "cornflowerblue", "royalblue", "midnightblue", "mediumblue"]*10,
    ["bisque", "darkorange", "wheat", "darkgoldenrod", "gold"]*10,
    ["mediumspringgreen", "aquamarine", "turquoise", "paleturquoise", "darkcyan", "cyan"]*10,
    ["lightcoral", "indianred", "tomato", "coral", "sienna", "chocolate", "bisque"]*10,
    ["slateblue", "rebeccapurple", "darkorchid", "thistle", "violet", "navy"]*10,
    ["lightgreen", "forestgreen", "lime", "mediumseagreen", "mediumaquamarine", "darkolivegreen"]*10
    ]

for i in range(0, 6):
    fig, ax = plt.subplots(figsize=(5, 5))
    font = {'font.family' : 'serif',
        'font.size'   : 14,
        'font.weight' : 'normal'}
    plt.rcParams.update(font)
    plt.grid(True)

    df=dfs[i]
    ax.barh(df['features'],df['score'], align='center', color=my_color_matrix[i])
    ax.invert_yaxis()  # labels read top-to-bottom
    ax.set_ylabel("Skill")
    ax.set_xlabel('Importance')
    ax.tick_params(axis='x', which='major', labelsize=15)
    ax.tick_params(axis='y', which='major', labelsize=17)
    ax.set_title("Cluster {}".format(i+1), fontsize=24)
    plt.show(fig)

#Below are five graphs corresponding to the top 15 skills in each cluster ordered by relative importance as measured by TF-IDF.-
Cluster 1: Neural Networks and Deep Learning (Neural network, Tensorflow, keras)
-
Cluster 2: Machine learning algorithm (supervised learning, unsupervised learning algorithms)
-
Cluster 3: Analytical Tools and Techniques (python, java, c, matlab, c++, r, SQL)
-
Cluster 4: Data acquisition and management (Data structure, web-scraping, API, SQL, noSQL,keras)
-
Cluster 5: Artificial Intelligence (focus on the important foundations of AI, such as knowledge representation and reasoning)
-
Cluster 6: Structuring and Visualizing Data for Analytics
!pip install selenium
import requests
from bs4 import BeautifulSoup
from selenium.common.exceptions import NoSuchElementException, ElementClickInterceptedException
from selenium import webdriver

import numpy as np
import pandas as pd
import matplotlib.pyplot as plt
%matplotlib inline
Collecting selenium
Downloading selenium-3.141.0-py2.py3-none-any.whl (904 kB)
Requirement already satisfied: urllib3 in c:\users\dijia\anaconda3\lib\site-packages (from selenium) (1.25.9)
Installing collected packages: selenium
Successfully installed selenium-3.141.0
In this section, we want to identify which companies can be approached for internships in data science. We will use two use cases to show how data can be used to answer the question.
In the first use case, we assume that the student is interested in companies with high ratings and that pay well. To make recommendations, we use glassdoor to retrieve company ratings and workopolist to obtain company salaries. Note that for each company associated with a job posting on glassdoor, ratings on career opportunities, benefits, culture & values, senior management, work/life balance are included as well as the overall company ratings. We will look at all these ratings to score a company.
In the second use case, we assume the student is interested in identifying the best location. To make recommendations, we use indeed to get job locations and make recommendations.
As discussed above, we will be using Glassdoor to get ratings of different companies, which will later help in identifying which companies to choose. The following process will be used:
- Web scapping Glassdoor to get the ratings features and basic company information
- Visualize and analyse the data obtained above to make the final decision
In this step, we extract company details and ratings from Glassdoor. The following features are extracted:
- Ratings including career opportunities, benefits, culture & values, senior management, work/life balance and overall ratings
- Company details including, the name and its industry
Note that selenium library and XPath are used in addition to beautiful to BeautifulSoup to parse and extract data from glassdood pages. When Glassdoor loads pages, details like ratings, reviews for a specific job are provided under different tabs. However, BeautifulSoup doesn't have the capability to parse a non static page. Thus, selenium's webdriver is used to overcome that problem (i.e can navigate different pages or dynamic content of the page).
import time

#options = webdriver.ChromeOptions()

#Make sure to download chromedriver (https://chromedriver.storage.googleapis.com/index.html?path=86.0.4240.22/)
#and the executable to PATH or current working directory
#driver = webdriver.Chrome(executable_path = "./chromedriver", options=options)
Here, we define a helper function that extracts the discussed features from data science job postings on Glassdoor. Note that the function call was commented out as the runtime is long; uncomment it if new data is needed. All data that was retrieved initially is saved in glassdoor_ratings.csv file.
types = ['Overall', 'Culture & Values', 'Work/Life Balance', 'Senior Management', 'Comp & Benefits', 'Career Opportunities']

def get_glassdoor_ratings():

    #initialize dataframe that will contain the scraped data
    ratings_df = pd.DataFrame()

    pages = list(range(0,1000,20))

    # glassdoor has about 20 jobs per page. GO through every page
    for page in pages:
        url = "https://www.glassdoor.ca/Job/toronto-data-science-jobs-SRCH_IL.0,7_IC2281069_KO8,20_IP" + str(page) + ".htm"
        driver.get(url)

        #Retrieve every job on current page and scrape them
        jobs = driver.find_elements_by_class_name("jl")

        for job in jobs:
            details = {}
            job.click()
            time.sleep(5)

            # get company name and job title
            try:
                company = driver.find_element_by_xpath('.//div[@class="employerName"]').text.split("\n")[0]
            except:
                company = None

            try:
                job_title = driver.find_element_by_xpath('.//div[contains(@class, "title")]').text
            except:
                job_title = None

            try:
                #Get company ratings: overall rating
                driver.find_element_by_xpath('.//div[@data-test="tab" and @data-tab-type="rating"]').click()
                overall_rating = driver.find_element_by_xpath('.//span[@class="avg"]').text

                #Get all other ratings
                soup = BeautifulSoup(driver.page_source, 'html.parser')

                rating_types = ['Overall']
                for rtype in soup.find_all(class_ = "ratingType"):
                    #text = rtype.text.lower()
                    #text = text.replace("&", "").replace(" ", "")

                    rating_types.append(rtype.text)

                ratings = [float(overall_rating)]
                for rating in soup.find_all(class_ = "ratingValue"):
                    rating = float(re.findall(r"[-+]?\d*\.\d+|\d+", rating.text)[0])
                    ratings.append(rating)

                details = dict(zip(types, ratings))
            except:
                details = dict(zip(rating_types, [None, None, None, None, None, None]))

            try:
                #Get the company's industry
                driver.find_element_by_xpath('.//div[@data-test="tab" and @data-tab-type="overview"]').click()
                industry = driver.find_element_by_xpath('.//div[@class="infoEntity"]//label[text()="Industry"]//following-sibling::*').text
            except:
                industry = None

            details['Industry'] = industry
            details['Company'] = company
            details['Title'] = job_title
            #add all the details to the dataframe
            ratings_df = ratings_df.append(details, ignore_index=True)
    return ratings_df
#uncoment if new data is needed
#ratings_df = get_glassdoor_ratings()
#ratings_df.head()
#ratings_df = ratings_df[pd.notna(ratings_df['Overall'])]
#ratings_df.to_csv('./glassdoor_ratings.csv', index=True)After we have the data, let's take a look at what the data looks like and draw some conclusion to answer the question.
#Read in the already saved data
ratings_df = pd.read_csv('glassdoor_ratings.csv')
ratings_df.drop(['Unnamed: 0'], axis=1, inplace=True)
ratings_df.head().dataframe tbody tr th {
vertical-align: top;
}
.dataframe thead th {
text-align: right;
}
| Career Opportunities | Comp & Benefits | Company | Culture & Values | Industry | Overall | Senior Management | Title | Work/Life Balance | Diversity & Inclusion | |
|---|---|---|---|---|---|---|---|---|---|---|
| 0 | 2.9 | 2.5 | Spin Master Ltd | 3.0 | Consumer Products Manufacturing | 3.0 | 2.2 | Senior Manager, Data Science | 3.2 | NaN |
| 1 | 3.8 | 4.2 | Ian Martin | 4.4 | Staffing & Outsourcing | 4.2 | 4.3 | Data Engineer - BNSJP00016223 | 4.6 | NaN |
| 2 | 3.3 | 3.6 | Softchoice | 4.1 | IT Services | 3.7 | 3.8 | Customer Insights Program Manager | 4.4 | NaN |
| 3 | 3.4 | 3.4 | HUB International | 3.7 | Insurance Agencies & Brokerages | 3.6 | 3.6 | Data Analyst (Insurance) | 4.2 | NaN |
| 4 | 3.9 | 3.8 | Enhance IT | 4.0 | NaN | 4.1 | 4.0 | Big Data Engineer | 5.0 | NaN |
ratings_df.drop_duplicates(subset=['Company'], keep='first', inplace=True)

#Drop the column since almost all companies don't have that rating
#ratings_df.drop(['Diversity & Inclusion'], axis=1, inplace=True)

#creat average rating column: to be of use during visualization
ratings_df['avg_rating'] = ratings_df[types].sum(axis=1)
ratings_df.sort_values(by=['avg_rating'], ascending=False, inplace=True)
ratings_df.info()
<class 'pandas.core.frame.DataFrame'>
Int64Index: 66 entries, 77 to 11
Data columns (total 11 columns):
# Column Non-Null Count Dtype
--- ------ -------------- -----
0 Career Opportunities 55 non-null float64
1 Comp & Benefits 55 non-null float64
2 Company 66 non-null object
3 Culture & Values 55 non-null float64
4 Industry 64 non-null object
5 Overall 66 non-null float64
6 Senior Management 55 non-null float64
7 Title 66 non-null object
8 Work/Life Balance 55 non-null float64
9 Diversity & Inclusion 0 non-null float64
10 avg_rating 66 non-null float64
dtypes: float64(8), object(3)
memory usage: 6.2+ KB
From the first glance at the data, all companies present in the dataset don't have Diversity & Inclusion rating, so we will drop that rating.
Since we are looking into companies for potential internships, some ratings are going to be more important than others. That is, it is reasonable to say that a Career Opportunities rating is more likely important than a Senior Management rating. Thus, for visualization, we will focus mainly on Career Opporunities, Culture & Values, Work/Life balance and the overall ratings.
ratings_df.plot(x="Company", y=types, kind="bar", figsize=(20,8))
plt.show()
high_rating = ratings_df.sort_values(by=['Overall'], ascending=False)
font = {'font.family' : 'serif',
'font.size' : 18,
'font.weight' : 'normal'}
plt.rcParams.update(font)
ax = high_rating.plot(x="Company", y=['Overall', 'Culture & Values', 'Work/Life Balance', 'Career Opportunities'],
kind="bar", figsize=(20,8), title="Company ratings with no threshold on ratings")
ax.set_ylabel("Ratings")
plt.show()The above plot is clearly not very legible as there are still many companies being visualized. However, if we are looking for companies to approach, it is reasonable to set a threshold rating below which the company is not considered. Let's set a threshold of an overall rating of 4
#Only companies with high overall rating
high_rating = ratings_df[ratings_df['Overall'] > 4].sort_values(by=['Overall'], ascending=False)

ax = high_rating.plot(x="Company", y=['Overall', 'Culture & Values', 'Work/Life Balance', 'Career Opportunities'],
                 kind="bar", figsize=(20,8), title="Company ratings with thershold of overall rating = 4")
ax.set_ylabel("Ratings")
plt.show()
From the plot above, companies like Validere, Senso.ai, DNAstack, Loopio, Zynga, Affinity among others have the highers overall rating.
Given, we are looking for potential companies for internships, it is reasonable to look for companies that have available/potential opportunities. So, let's set a threshold for the Career Opportunities rating (of 4) in addition to the existing overall rating threshold.
# Companies with high ratings and high career opportunities ratings (useful info for interns)
high_rating = ratings_df[(ratings_df['Overall'] > 4) & (ratings_df['Career Opportunities'] > 3.5)].sort_values(
    by=['Overall','Career Opportunities'], ascending=False)

ax = high_rating.plot(x="Company", y=['Overall', 'Culture & Values', 'Work/Life Balance', 'Career Opportunities'],
                 kind="bar", figsize=(20,8),title="Company ratings with thershold of overall rating = 4, career opportunites = 3.5")
ax.set_ylabel("Ratings")
plt.show()
From the plot above, it is clear that most of the top companies from the previous plots are still at the top in the above plot too. Note that some companies like SickKids moved to the top 20 when the Career Opportunities threshold was introduced.
high_rating = ratings_df[(ratings_df['Overall'] > 4) & (ratings_df['Career Opportunities'] > 3.5) &
                         (ratings_df['Work/Life Balance'] > 3.5)].sort_values(by=['Overall','Career Opportunities',
                                                                                 'Work/Life Balance'], ascending=False)


ax = high_rating.plot(x="Company", y=['Overall', 'Culture & Values', 'Work/Life Balance', 'Career Opportunities'],
                 kind="bar", figsize=(20,8),
                      title="Company ratings with thershold on career opportunites, Work/Life Balance and overall ratings")
ax.set_ylabel("Ratings")
plt.show()
From the above plot, the top companies from previous plots are at the top again.
high_rating[['Company','Industry','Title']].dataframe tbody tr th {
vertical-align: top;
}
.dataframe thead th {
text-align: right;
}
| Company | Industry | Title | |
|---|---|---|---|
| 77 | Validere | Energy | Data Scientist |
| 37 | Senso.ai | Enterprise Software & Network Solutions | Account Executive |
| 64 | Loopio | Enterprise Software & Network Solutions | Data Scientist |
| 25 | DNAstack | Enterprise Software & Network Solutions | Genomics Data Science Lead |
| 24 | Zynga | Video Games | Data Scientist II |
| 26 | Affinity | Enterprise Software & Network Solutions | Data Analyst |
| 43 | Kinaxis | Enterprise Software & Network Solutions | Principal Data Engineer (Analytics Solutions) |
| 45 | Cloudbeds | Computer Hardware & Software | Principal Data Engineer (Remote) |
| 8 | Prodigy Game | Computer Hardware & Software | Data Scientist, Game |
| 52 | Geotab | Computer Hardware & Software | Data Scientist, Video Analytics |
| 6 | Dean Group | Staffing & Outsourcing | Machine Learning Engineer |
| 49 | Achievers | Enterprise Software & Network Solutions | Senior Product Manager, Listen (Employee Voice) |
| 21 | Uken Games | Audiovisual | Data Analyst |
| 76 | NorthOne | Banks & Credit Unions | Data Scientist |
| 1 | Ian Martin | Staffing & Outsourcing | Data Engineer - BNSJP00016223 |
| 28 | SickKids | Health Care Services & Hospitals | Senior Data Architect- Artificial Intelligence... |
| 4 | Enhance IT | NaN | Big Data Engineer |
| 50 | Coursera | Colleges & Universities | Senior Data Scientist, Machine Learning |
| 19 | BrainStation | Education Training Services | Educator, Data Scientist |
Mention that the choices are arbitrary, and from narrowing down the places, one can choose ones in a desired industry
Here, we use Workopolis to extract salaries from companies with data science jobs. Webscraping is used to get salary information regarding job postings and their respective companies relevant details. Next the retrieve data is cleaned and visualized.
In this section, job postings related to data science are webscraped from the website to get salary estimates. BeautifulSoup is used to parse the pages.
# Code adapted from Group 15 in-class presentation

def scrape_workopolis():
    job_info = pd.DataFrame()

    # For workopolis, each page only displays ~25 jobs

    base = "https://www.workopolis.com"
    w_link = "https://www.workopolis.com/jobsearch/find-jobs?ak=data+science&lg=en&pn="
    result = ""
    for i in range(1,15):
        page = w_link + str(i)
        curr_r = requests.get(page).text
        result = result + curr_r

    soup = BeautifulSoup(result, 'lxml')

    for jobs in soup.find_all("article",class_ = "JobCard"):
      try:
        position_title = jobs.find('h2', class_ = 'JobCard-title').text.strip()
      except:
        position_title = None

      try:
        employer = jobs.find('div',attrs={'class': 'JobCard-property JobCard-company'}).find('span').text.strip()
      except:
        employer = None

      try:
        location = jobs.find('span', class_ = 'JobCard-property JobCard-location').text.strip()
      except:
        location = None

      try:
        link = jobs.find('h2', attrs={'class': 'JobCard-title'}).find('a', href=True)['href']
      except:
        link = None

      try:
        salary = jobs.find('span', class_ = 'Salary').text.strip()
      except:
        location = None

      job_info = job_info.append({
          'position_title': position_title,
          'employer': employer,
          'location': location,
          'link': link,
          'estimated_salary': salary}, ignore_index = True)
    return job_info
#uncomment if new data is needed, otherwise read the scraped data from workopolis_jobs.csv as below
#jobs_df = scrape_workopolis()
#jobs_df.to_csv('./workopolis_jobs.csv', index=True)1#Read in the already saved data
jobs_df = pd.read_csv('workopolis_jobs.csv')
jobs_df.drop(['Unnamed: 0'], axis=1, inplace=True)
jobs_df.head().dataframe tbody tr th {
vertical-align: top;
}
.dataframe thead th {
text-align: right;
}
| employer | estimated_salary | link | location | position_title | |
|---|---|---|---|---|---|
| 0 | Société Conseil Groupe LGS | $65,000 - $120,000 a year | /jobsearch/viewjob/B1WzUSCL08V4fHKqPSuVmt-ScDl... | — Montréal, QC | Architecte de solutions AI |
| 1 | Spin Master Ltd | Estimated: $84,000 - $120,000 a year | /jobsearch/viewjob/CAV4qCvR7aX0DbTTtqlSuqAU6bQ... | — Toronto, ON | Senior Manager, Data Science |
| 2 | MSi Corp (Bell Canada) | $60 - $70 an hour | /jobsearch/viewjob/vIutwtUUWteTuDjx9sbKUTlmnWN... | — Montréal, QC | Senior BI Manager |
| 3 | Yelp | Estimated: $64,000 - $87,000 a year | /jobsearch/viewjob/yMpYOTSrFli_UUO9o5DHYfyVuYr... | — Remote | Data Analyst (Remote) |
| 4 | LeapGrad Corp. | Estimated: $48,000 - $67,000 a year | /jobsearch/viewjob/yY1D_g2NnZitlS5SYVFUPA06lqF... | — Toronto, ON | Data Science Intern (New Grads) - Starts Novem... |
Before visualizing the data, let's clean the data first. Workopolis provide salary estimates as a range. Given that interns are more likely to be paid lower, we will use the lower salary in the range for the purposes of visualizing.
#Clean the salary data
hourly_rate = jobs_df[jobs_df['estimated_salary']. apply(lambda x: x.find('hour') != -1)]
#print(len(hourly_rate))

#Since the hourly rate jobs are very few, they will be dropped from the dataframe for consistency in salary
jobs_df.drop(hourly_rate.index, inplace=True)

#drop rows where salary is null
jobs_df.drop(jobs_df[pd.isna(jobs_df['estimated_salary'])].index, inplace=True)
# Given we are working within an internship context, will extract only the lower salary of the salary range
#given in the estimated_salary column for purposes of vizualization
def clean_salary(salary):
salary = salary.replace('Estimated:', '')
salary = salary.replace ('a year', '').strip()
range_salary = salary #keep the range of the salaries
#get only the lower of the range
salary = salary.split('-')[0]
salary = int(salary.replace('$', '').replace(',', ''))
return salaryjobs_df['salary'] = jobs_df['estimated_salary'].apply(clean_salary)
jobs_df.drop_duplicates(subset=['employer'], keep='last', inplace=True)
jobs_df.head().dataframe tbody tr th {
vertical-align: top;
}
.dataframe thead th {
text-align: right;
}
| employer | estimated_salary | link | location | position_title | salary | |
|---|---|---|---|---|---|---|
| 0 | Société Conseil Groupe LGS | $65,000 - $120,000 a year | /jobsearch/viewjob/B1WzUSCL08V4fHKqPSuVmt-ScDl... | — Montréal, QC | Architecte de solutions AI | 65000 |
| 4 | LeapGrad Corp. | Estimated: $48,000 - $67,000 a year | /jobsearch/viewjob/yY1D_g2NnZitlS5SYVFUPA06lqF... | — Toronto, ON | Data Science Intern (New Grads) - Starts Novem... | 48000 |
| 6 | Cyber Chasse | Estimated: $50,000 - $61,000 a year | /jobsearch/viewjob/w6XNjePOuHJPHdLV0DEbxGCA3_B... | — Canada | Data Science | 50000 |
| 7 | sgsco | Estimated: $50,000 - $61,000 a year | /jobsearch/viewjob/z7kj74wHWhQjtgayJsHapZMnaCm... | NaN | Intern - Data Science | 50000 |
| 8 | Southern Graphics Systems, Canada Co. | Estimated: $77,000 - $110,000 a year | /jobsearch/viewjob/RFn7DKOFpLudLpBTkDvMR5Of6mV... | — Toronto, ON | Intern - Data Science | 77000 |
After cleaning the data, let's visualize 30 companies with the highest salaries
high_salary = jobs_df.sort_values(by=['salary'], ascending=False).iloc[:30, :]
ax = high_salary.plot(x="employer", y=['salary'],
                 kind="bar", figsize=(20,8), title="Companies with the highest salaries ")
ax.set_ylabel("Salary")
plt.show()
Note that the most high rated companies identified earlier are not present in the plot above (except Achievers, Dean Group). In the next step, we will combine the salaries and ratings to make some recommendations.
In this section, we combine salaries and ratings to make final recommendtions. We take the companies with the highest ratings obtained from the first section and search for the salaries associated with the respective companies. We then sort the companies by their ratings and salaries to make our final recommendations.
# clean the company names for consistency and easy comparison
jobs_df['employer_lc'] = jobs_df['employer'].apply(lambda x: str(x).lower().strip())
jobs_df.head().dataframe tbody tr th {
vertical-align: top;
}
.dataframe thead th {
text-align: right;
}
| employer | estimated_salary | link | location | position_title | salary | employer_lc | |
|---|---|---|---|---|---|---|---|
| 0 | Société Conseil Groupe LGS | $65,000 - $120,000 a year | /jobsearch/viewjob/B1WzUSCL08V4fHKqPSuVmt-ScDl... | — Montréal, QC | Architecte de solutions AI | 65000 | société conseil groupe lgs |
| 4 | LeapGrad Corp. | Estimated: $48,000 - $67,000 a year | /jobsearch/viewjob/yY1D_g2NnZitlS5SYVFUPA06lqF... | — Toronto, ON | Data Science Intern (New Grads) - Starts Novem... | 48000 | leapgrad corp. |
| 6 | Cyber Chasse | Estimated: $50,000 - $61,000 a year | /jobsearch/viewjob/w6XNjePOuHJPHdLV0DEbxGCA3_B... | — Canada | Data Science | 50000 | cyber chasse |
| 7 | sgsco | Estimated: $50,000 - $61,000 a year | /jobsearch/viewjob/z7kj74wHWhQjtgayJsHapZMnaCm... | NaN | Intern - Data Science | 50000 | sgsco |
| 8 | Southern Graphics Systems, Canada Co. | Estimated: $77,000 - $110,000 a year | /jobsearch/viewjob/RFn7DKOFpLudLpBTkDvMR5Of6mV... | — Toronto, ON | Intern - Data Science | 77000 | southern graphics systems, canada co. |
#Get the companies with the high ratings and search salaries from the workopolis data
companies_gd = high_rating['Company'].apply(lambda x: str(x).lower().strip())
with_salaries = jobs_df[jobs_df['employer_lc'].apply(lambda x: x in set(companies_gd))]
with_salaries.drop_duplicates(subset=['employer_lc'], keep='last', inplace=True)
with_salaries = with_salaries[['employer', 'position_title', 'salary']].sort_values(by=['salary'], ascending=False)
with_salaries.dataframe tbody tr th {
vertical-align: top;
}
.dataframe thead th {
text-align: right;
}
| employer | position_title | salary | |
|---|---|---|---|
| 32 | Achievers | Data Scientist | 90000 |
| 97 | Dean Group | Machine Learning Engineer | 87000 |
| 267 | Coursera | Senior Data Scientist, Machine Learning | 84000 |
| 166 | Kinaxis | Data Scientist | 83000 |
| 222 | SickKids | Senior Data Architect- Artificial Intelligence... | 81000 |
| 349 | Geotab | Senior Data Scientist | 81000 |
| 35 | NorthOne | Data Scientist | 75000 |
| 137 | Loopio | Data Scientist | 72000 |
| 21 | DNAstack | Genomics Data Science Lead | 67000 |
| 129 | BrainStation | Associate Educator, Data Scientist | 62000 |
| 176 | Zynga | Data Scientist II | 53000 |
| 367 | Prodigy Game | Data Scientist, Game | 53000 |
# Plot the salaries of the highest rating companies
ax = with_salaries.plot(x="employer", y=['salary'],
                 kind="bar", figsize=(20,8), title="Companies from Glassdoor data with the highest salaries ")
ax.set_ylabel("Salary")
ax.set_xlabel("Company")
plt.show()