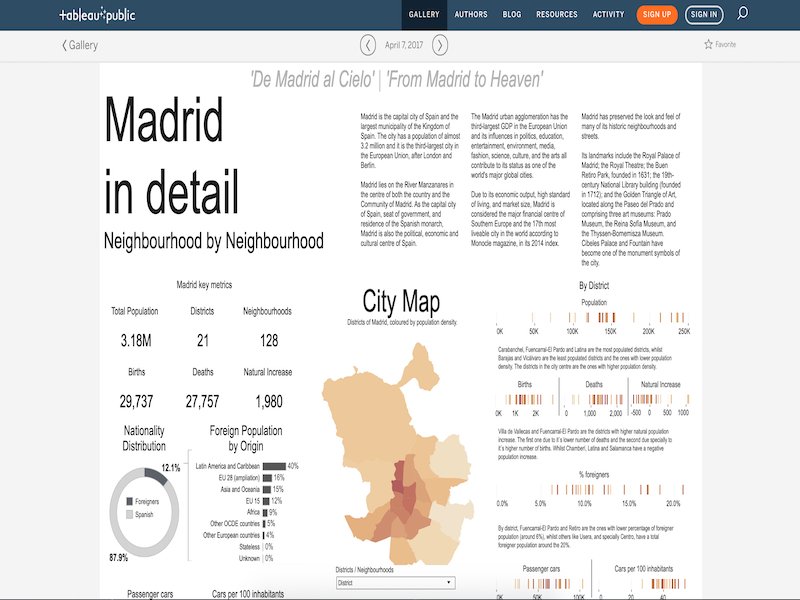
Analyze the Tableau dashboard Madrid in Detail and find 3 insights in the dashboard.
For each insight, provide a static image to share the finding. Write a short report to explain each observation and how the conclusion was reached using the information from the dashboard.
Tool: Tableau Dashboard
Artifact: Project 1-Interpret a Data Visualization.pdf
Analyze a survey data about current Udacity students across a number of programs, go through the process of calculating summary statistics and building visual methods of spreadsheet data to find interesting information out about Udacity students.
Produce a presentation report from the analysis along with visualizations to explain the findings and support the conclusions drawn.
Tool: Microsoft Excel (version Office 365 2019 for Windows or later)
Artifact: Project 2-Analyze Survey Data.pdf, surveydata_Proj2wkbk.xlsx
Analyze the historical transactions (dated between 01/12/2010 and 09/12/2011) in the Ecommerce Data Set of a UK-based online wholesaler of unique all-occasion gifts, come up with a question to explore and create a visual story to answer the question.
Produce a report on the visual story complete with analysis to support the conclusions drawn.
Tool: Microsoft Excel
Artifact: Project 3-Storytelling with Data.pdf, EcommDataClean.xlsx
Analyze the Flight Delays dataset containing the on-time performance of US domestic flights operated by large air carriers in 2015, build 3 visualizations to tell a story or highlight patterns in the data set.
Host the visual story board on Tableau Public and produce a report to communicate the insights drawn from the story board, along with links to the Tableau dashboards or story.
Tool: Tableau Public, Tableau Desktop
Artifact: Project 4-Build Data Dashboards.pdf, project4-Build Data Dashboards.twbx
Click here to see the interactive Tableau Story board. Enjoy ✨ !!!
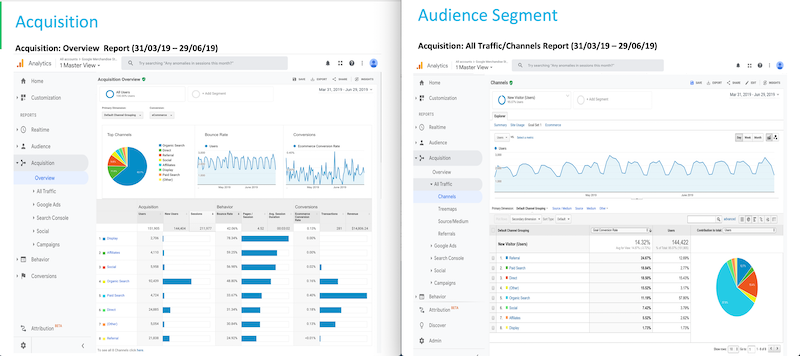
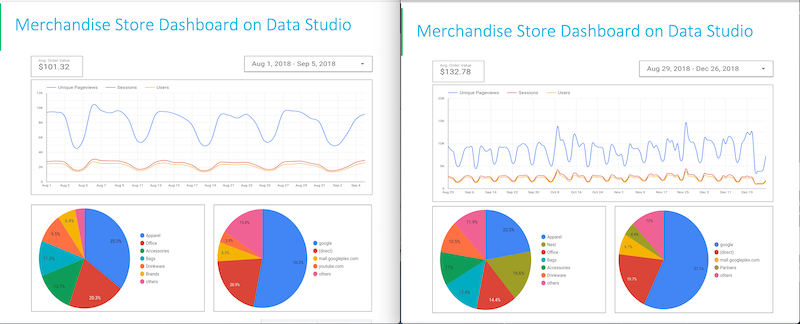
Use readily available tools in Google Analytics to bridge the gap between raw data and actionable insight. Levarage best practices for working in Google Analytics to explore data and apply segmentation techniques to answer questions.
Create a report demonstrating how to create primary view, filter, answer analytics questions using segmentation technique and reports in Audience, Acquisition, Behavior and Conversion areas of Google Analytics.
Tool: Google Analytics
Artifact: Project 5-Advanced Displays Creating Segments and Applying View Settings and Filters.pdf
Craft an Analytics Brief to analyze performance of the marketing efforts of a given company.
Use the brief as a framework to identify the data to capture for measuring performance metrics. Attach a customer journey map to the brief and use it to further evaluate the metrics being captured and evaluate whether the customer journey has revealed any gaps in the brief itself. Provide suggestions for addressing those potential gaps.
Create a report illustrating how to create the analytics brief to unlock the questions needed to be asking and the corresponding answers thru the analytics process.
Tool: Analytic Brief template adapted from Cesar A Brea's approach
Artifact: Project 7-Crafting an Analytic Brief.pdf
Analyze the marketing data dataset containing Black Friday sales for 2017 and 2018. Evaluate the the sales performance for the 2 years and craft a campaign report.
Create a report providing insights on the analysis, answering questions about performance against the stated objectives and evaluations of audience, marketing, sales and product categories.
Tool: Microsoft Excel, Jupter Notebook (Python)
Programming library: panda, numpy, matplotlib, seaborn
Artifact: Project 8-Craft a Report.pdf


