A reusable framework-agnostic D3 charting library.
📊 📈 🚀
- Component status
- Installation
- Demo and documentation
- Code Sample
- Run Charts locally
- Bugs and feature requests
- Contributing
- Community
- Versioning
- Copyright and license
✅ Stable ⏳ In progress
| Component | Vanilla | Angular | React |
|---|---|---|---|
| Simple Bar | ✅ | ⏳ | Soon |
| Grouped Bar | ✅ | ⏳ | Soon |
| Stacked Bar | ✅ | ⏳ | Soon |
| Donut | ✅ | ⏳ | Soon |
| Line | ✅ | ⏳ | Soon |
| Curved Line | ✅ | ⏳ | Soon |
| Pie | ✅ | ⏳ | Soon |
| Step | ✅ | ⏳ | Soon |
| Area | Soon | Soon | Soon |
Run:
npm i -g @storybook/cli

npm install @carbon/charts --saveCharts' demo and documentation can be viewed in GitHub Pages at https://pages.github.com/IBM/carbon-charts/ and https://pages.github.com/IBM/carbon-charts/documentation/ respectively.
HTML:
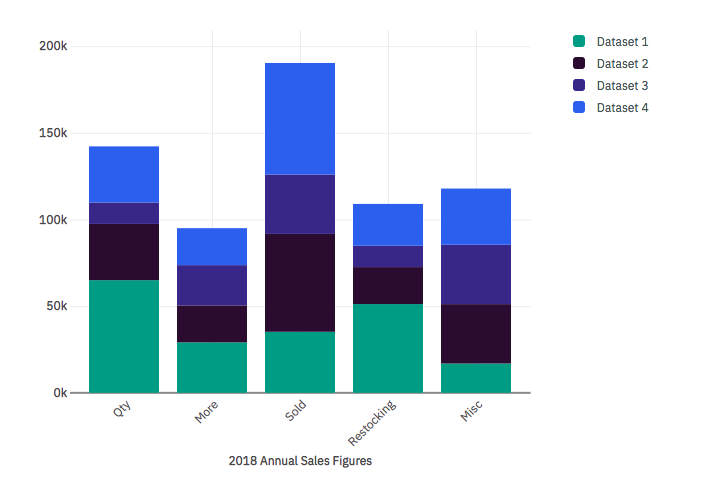
<div id="stacked-bar-chart-holder"></div>JS:
import { BarChart } from "@carbon/charts";

const colors = [
	"#00a68f",
	"#3b1a40",
	"#473793",
	"#3c6df0",
	"#56D2BB"
];

const stackedBarData = {
	labels: ["Qty", "More", "Sold", "Restocking", "Misc"],
	datasets: [
		{
			label: "Dataset 1",
			backgroundColors: [colors[0]],
			data: [
				65000,
				29123,
				35213,
				51213,
				16932
			]
		},
		{
			label: "Dataset 2",
			backgroundColors: [colors[1]],
			data: [
				32432,
				21312,
				56456,
				21312,
				34234
			]
		},
		{
			label: "Dataset 3",
			backgroundColors: [colors[2]],
			data: [
				12312,
				23232,
				34232,
				12312,
				34234
			]
		}
	]
};

const stackedBarOptions = {
	accessibility: false,
	scales: {
		x: {
			title: "2018 Annual Sales Figures",
		},
		y: {
			formatter: axisValue => {
				return `${axisValue / 1000}k`;
			},
			yMaxAdjuster: yMaxValue => yMaxValue * 1.1,
			stacked: true
		}
	},
	legendClickable: true,
	containerResizable: true,
};

// Grab chart holder HTML element and initialize the chart
const chartHolder = document.getElementById("stacked-bar-chart-holder");
const barChart = new BarChart(
	chartHolder,
	{
		data: stackedBarData,
		options: stackedBarOptions,
	}
);-
Fork the project and clone your fork:
# Clone your fork of the repo into the current directory
git clone git@github.com:<your-username>/carbon-charts.git
# Navigate to the newly cloned directory
cd carbon-charts
-
Run
npm installto install Node.js dependencies. -
Run
npm run demo:serverto serve up the demo locally. -
Finally, open http://localhost:9001/ in your browser. SPOILER ALERT: There's no "Hello, World!"
Have a bug or a feature request? First read the issue guidelines and search for existing and closed issues. If your problem or idea is not addressed yet, open a new issue.
See our contributing guidelines. Included are instructions for opening issues, coding guidelines, and submitting pull requests.
We use the semantic-release library to automatically version our releases within the guidelines of Semantic Versioning Semantic Versioning guidelines.
See our releases notes for the changelog of each version of Charts.

