JoyPy
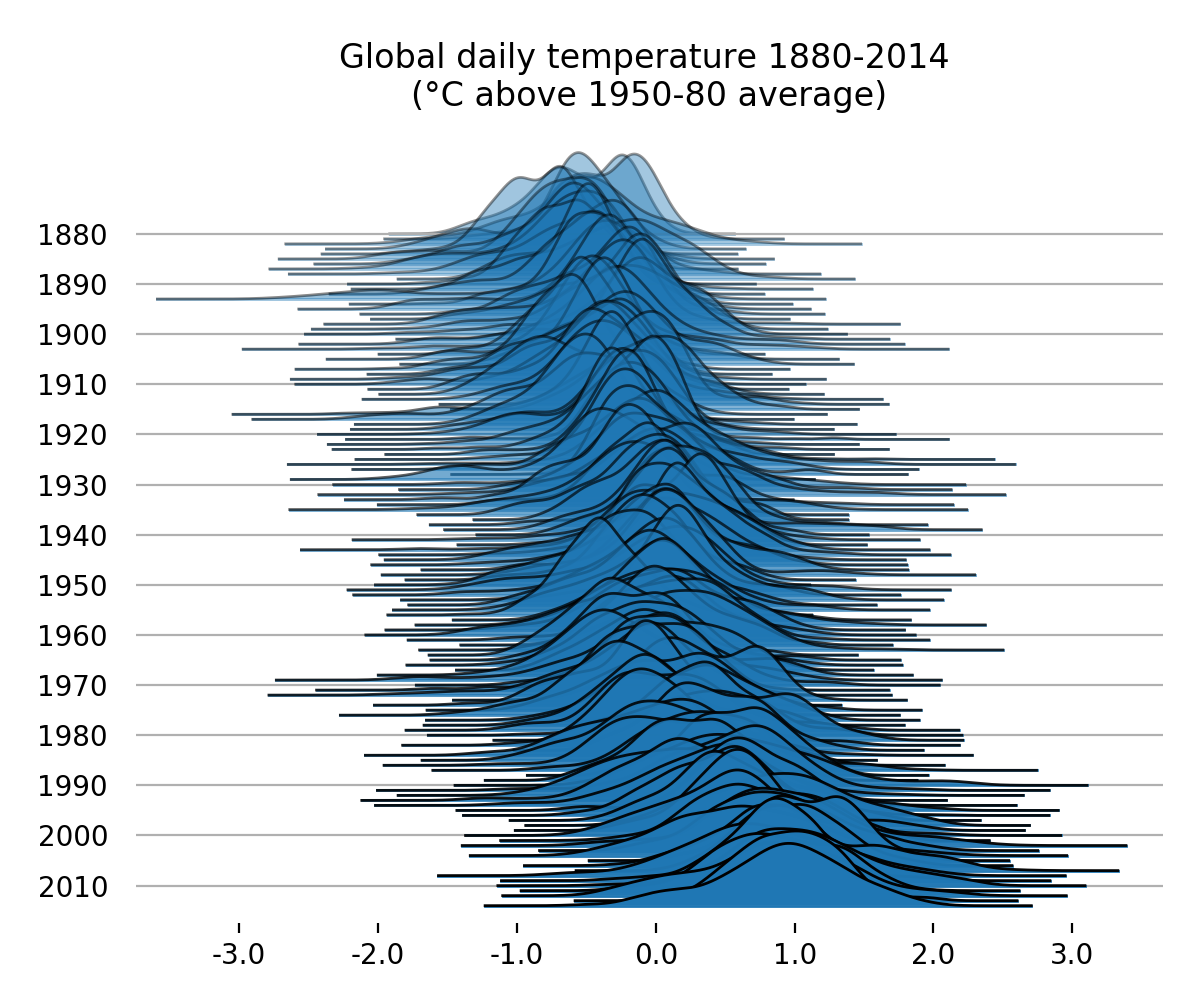
JoyPy is a one-function Python package based on matplotlib + pandas with a single purpose: drawing joyplots.
The code for JoyPy borrows from the code for kdes in pandas.plotting, and uses a couple
of utility functions therein. (This could be probably avoided with a little bit of
extra effort.)
What are joyplots?
Joyplots are stacked, partially overlapping density plots, simple as that. They are a nice way to plot data to visually compare distributions, especially those that change across one dimension (e.g., over time). Though hardly a new technique, they have become very popular lately thanks to the R package ggjoy (which is clearly much better developed/maintained than this one -- and I strongly suggest you to use that if you can use R and ggplot.) Update: the ggjoy package has now been renamed ggridges.
Why are they called joyplots?
If you don't know Joy Division, you are lucky: you can still listen to them for the first time! Here's a hint: google "Unknown Pleasures".
Examples
Take a look at this jupyter notebook for a couple of simple examples.
Dependencies
Not sure what are the oldest supported versions. As long as you have somewhat recent versions, you should be fine.
Installation
It's actually on PyPI, because why not:
pip install joypy
To install from github, run:
git clone git@github.com:sbebo/joypy.git
cd joypy
pip install .
License
Released under the MIT license.
Disclaimer + contributing
This is just a sunday afternoon hack, so no guarantees! If you want to contribute or just copy/fork, feel free to.

