Principal Microbial Groups : a new way to explore microbiome data
PMG = Principal Microbial Groups. This R package provides functions for the analysis of compositional data (e.g., data representing proportions of different variables/parts). Specifically, this package allows analysis of microbiome data where the OTUs can be grouped through a SBP (sequential binary partitioning) and provides a balance of OTU groups to be utilized for for the search of biomarkers in human microbiota.
PMGs procedure is illustrated on a cirrhosis study data. Data is obtained from the https://github.com/knights-lab/MLRepo.
Load Cirrhosis Data
library(readr)
tax_otu <- read.table('data/processed_taxatable.txt', sep="\t",header = TRUE)
tax<-tax_otu[,1:7]
otu<-tax_otu[,-(1:7)]
labels <- read.table('data/task-healthy-cirrhosis.txt', sep="\t",header = FALSE)
Load PMG library
source("lib/PMG_lib.R")Create a Phyloseq object. Data is filtered and 0's are replaced. TAX table and Sampledata are organized.
library(phyloseq)
OTU<-otu_table(otu, taxa_are_rows=TRUE) # taxas x samples
TAX<-tax_table(as.matrix(tax))
SAMPLEDATA<-sample_data(as.data.frame(labels))
taxa_names(OTU)<-taxa_names(TAX)
sample_names(OTU)<-sample_names(SAMPLEDATA)
cir<- phyloseq(OTU,TAX,SAMPLEDATA)
#Taxa that were not seen with more than 20 counts in at least 30% of samples are filtered.
cir2 <-  filter_taxa(cir, function(x) sum(x > 20) > (0.3*length(x)), TRUE)
OTU<-t(as.data.frame(otu_table(cir2)))
library(zCompositions)
otu.no0<-cmultRepl(OTU)
TAX<-as.data.frame(tax_table(cir))
TAX$otuid<-rownames(TAX)
SAMPLEDATA$Label<-ifelse(grepl("Cirrhosis", SAMPLEDATA$V2), 1, 0)
names(SAMPLEDATA)<-c("sampleID","Status","Label")
Before PMGs construction, the analyst should decide the minimum number of groups to construct.
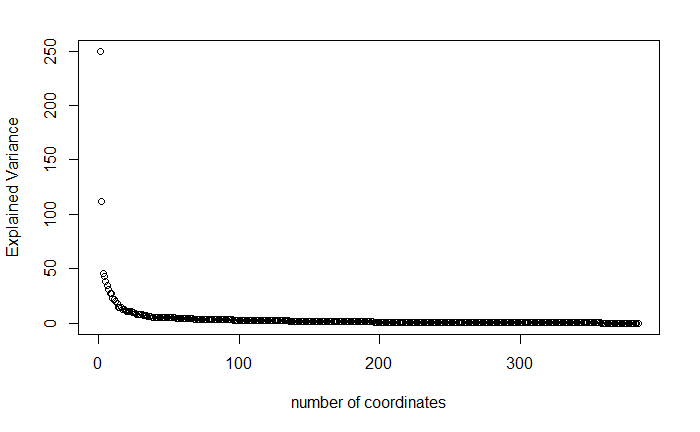
We chose 25 as minimum number for the demo dataset. It means that minimum 24 principal balances will be used for PMG construction.
V<- mPBclustvar(X) #
coord<-milr(X,V)
plot(diag(var(coord)),xlab="number of coordinates",ylab="Explained Variance")
Optimal number of groups is calculated by the method findOptimalNumOfGroups(otu,min). This method uses logistic regression for each number of PMGs and determines the best number of PMG choosing the best accuracy measure.
minimumNumOfGroups<-25
numberofgroup<-findOptimalNumOfGroups(otu.no0,minimumNumOfGroups)
[#] "Optimal Number of group is:27"
Once optimal number is decided, then it is easy to construct PMGs on otu table. The otuput is a PMG table and a OGT(OtuID|Group|Taxa) dataframe. PMG table is the new variables for each samples. OGT table is a table with the OTUs in each PMGs.
PMGs<-createPMGs(otu.no0,numberofgroup)
head(OGT)
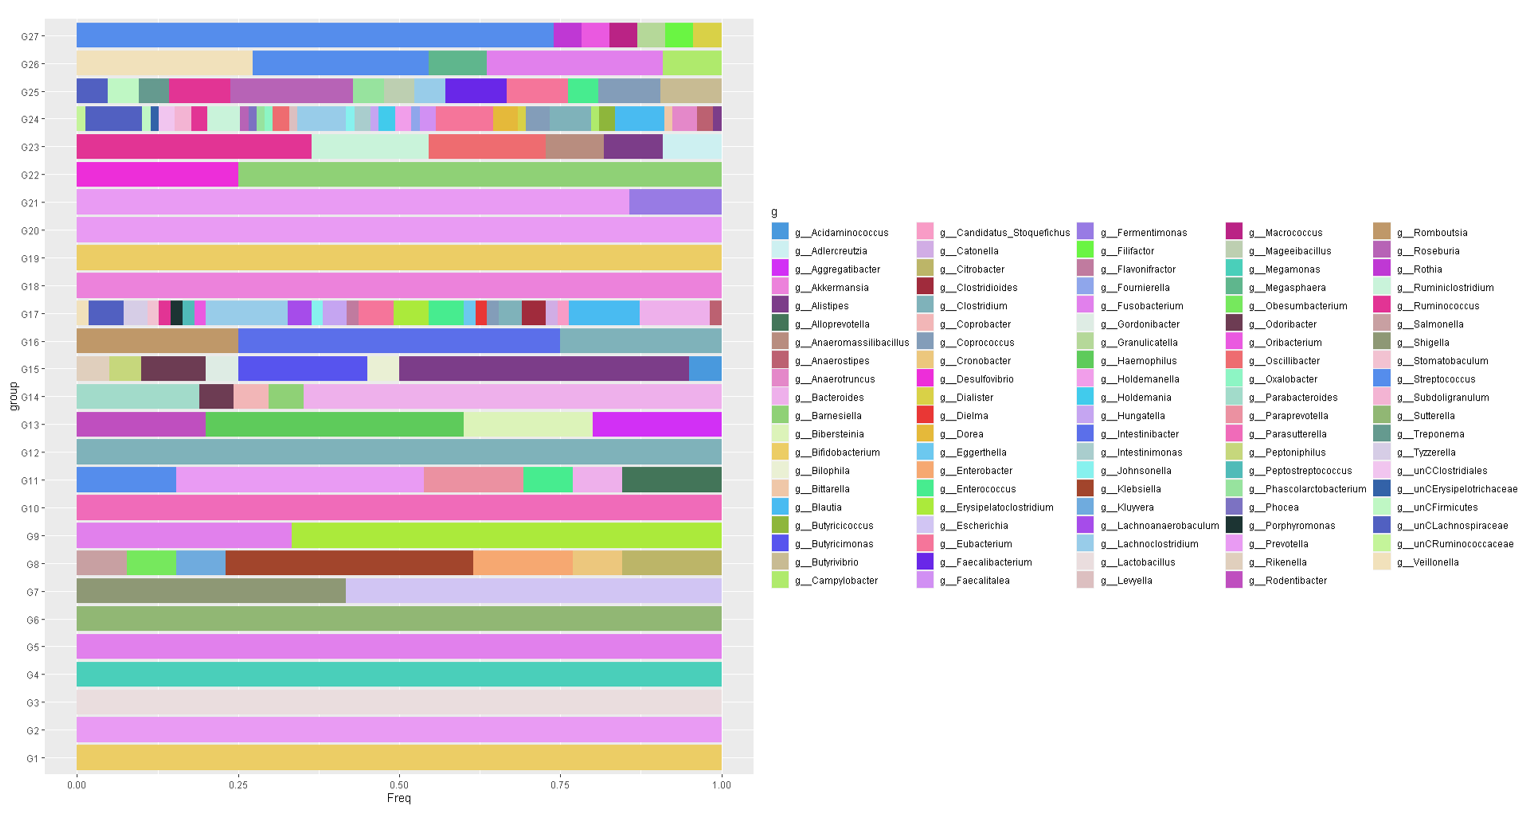
The taxonomical content of PMGs can be visualized by a boxplot. Input "g" for genus level content.
draw_PMGTaxa_boxPlot(OGT,"g",27)
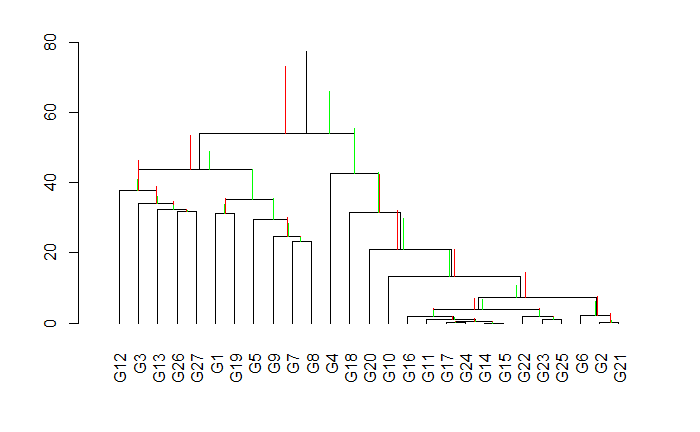
Draw a CODA Dendrogram on PMGs. Red and green horizontal bars represent the cirrhosis and
non-cirrhosis samples respectively.
PMGs_labels<-cbind(PMGs,SAMPLEDATA$Status)
names(PMGs_labels)[ncol(PMGs_labels)]<-"label"
PMGs_labels$label<-as.factor(PMGs_labels$label)
W<- mPBclustvar(PMGs)
library(compositions)
CoDaDendrogram(X=acomp(PMGs),V=W,type="lines",range=c(-10,10))
CoDaDendrogram(X=acomp(PMGs[PMGs_labels$label=="Cirrhosis",]), col="red",add=TRUE,V=E,type="lines",range=c(-7,7))
CoDaDendrogram(X=acomp(PMGs[PMGs_labels$label=="Healthy",]), col="green",add=TRUE,V=E,type="lines",range=c(-7,7))
Find Compositional Biomarkers via Distal PMG Balances
library(caret)
library(balance)

fit.control <- trainControl(method = "repeatedcv", number = 10, repeats = 5,
                            summaryFunction = twoClassSummary, classProbs = TRUE, allowParallel = F, savePredictions = T)

sbp <- sbp.fromADBA(PMGs, SAMPLEDATA$Status) # get discriminant balances
sbp <- sbp.subset(sbp) # get distal balances only

compBiomarkers <- as.data.frame(balance.fromSBP(x=PMGs, y = sbp))
compBiomarkers.labeled <- addLabel(data.distalBal.pmg,SAMPLEDATA$Status)


set.seed(123)
fit <- train(label ~ ., data = compBiomarkers.labeled, method = "glm",
                          family = "binomial", trControl = fit.control)
fit$results
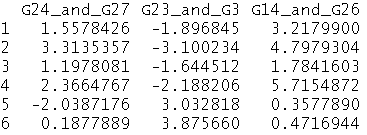
head(compBiomarkers,c((ncol(compBiomarkers.labeled)-3):ncol(compBiomarkers.labeled))))
First 3 Compositional Biomarkers : G14/G26 , G23/G3, G24/G27
I appreciate bug reports and feature requests. Please post to the github issue tracker here.


