An HTTP Server, packaged with postgres, jaegar and perf-test module in a docker, to record ad deliveries, clicks and installs, and query the statistics.
Scala as language
Http4s as server
Postgres as database
doobie as jdbc layer for scala
circe for json encoding and decoding
flywaydb for database migrations
scala open tracing for tracing context
jaegar as the tracer
docker - The application is dockerized along with postgres and jaegar
scalacheck - Generators are used to generate payload for perf-test
- Whenever an ad is loaded on a site, it is captured as a
delivery. - User clicking on the ad is captured as a
click. Click contains thedelivery_idthat lead to the click. - When the
clickleads to an install, it is captured asinstall. Aninstallcontains theclick_idthat lead to the install. - Querying the stats is time based and/or category based (You can query stats grouped by
OSandBrowser) - Sample curls for every request is present in the
curlsdirectory - The project also contains a sub-project called
perf-testwhich bombards the application server with requests (according to the parameters passed) - The
docker-compose.ymlhas the application server, postgres, jaegar-all-in-one and the perf-test-app.
make setup_serverbuilds a fat jar out of the server (ads-stats).make setup_perf_testbuilds a fat jar out of theperf-testsub project.make run_serverpackagespostgres,jaegarandads-stats-app(server) into a docker container and expose127.0.0.1:8080to the outside world.make perf_test_time_travelrunsads-stats-appwithno-op-tracerand runs theperf-testwith the arguments supplied. Use this to pre-populate your database with data while without tracing it. Eg:make perf_test_time_travel deliveries=500 delivery_to_click_ratio=0.5 click_to_install_ratio=0.5. This will insert500deliveries, and clicks and installs will be inserted according to the ratio specified. Note that you will not be able to see any traces in thejaegardashboard after you run the test.make perf_testrunsads-statswith a valid tracer and the traces will show up on thejaegardashboard. Eg:make perf_test delivery_to_click_ratio=0.5 click_to_install_ratio=0.5 delivery_to_query_ratio=0.25 running_time_in_seconds=50. This will run the perf-test for 50 seconds and during this time the inserts will happen in the ratio specified.
You can see the traces by going to http://localhost:16686/ on your browser. Select ads-stats-app service and then you can see the traced requests.
The ads-stats-app server is started with the these properties
-Dcom.sun.management.jmxremote.rmi.port=9090 -Dcom.sun.management.jmxremote=true -Dcom.sun.management.jmxremote.port=9090 -Dcom.sun.management.jmxremote.ssl=false -Dcom.sun.management.jmxremote.authenticate=false -Djava.rmi.server.hostname=127.0.0.1 -Dcom.sun.management.jmxremote.local.only=false
This allows you to monitor the JVM from your localmachine, say using VisualVM. Open Visual VM -> Remote -> Add Remote Host. Here add the IP Address of ads-stats-app. You can find the ip-address by running this command:
docker inspect -f '{{range .NetworkSettings.Networks}}{{.IPAddress}}{{end}}' <container-id-of-ads-stats-app>
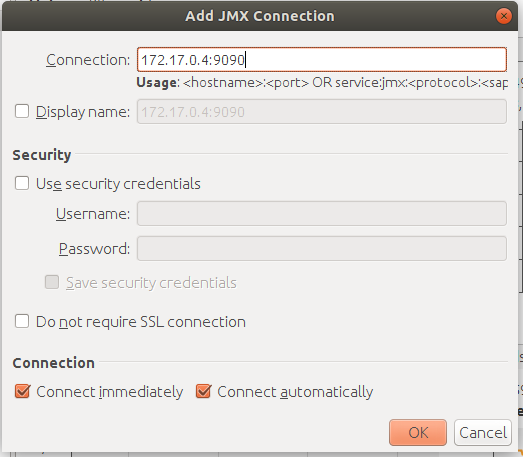
After adding the IP address, right click on the IP address and click Add JMX Connection. A window similar to the one below should show up. Add the port 9090 to the IP address and click Ok (in my machine 172.17.0.4 happened to be the IP address of ads-stats-app).
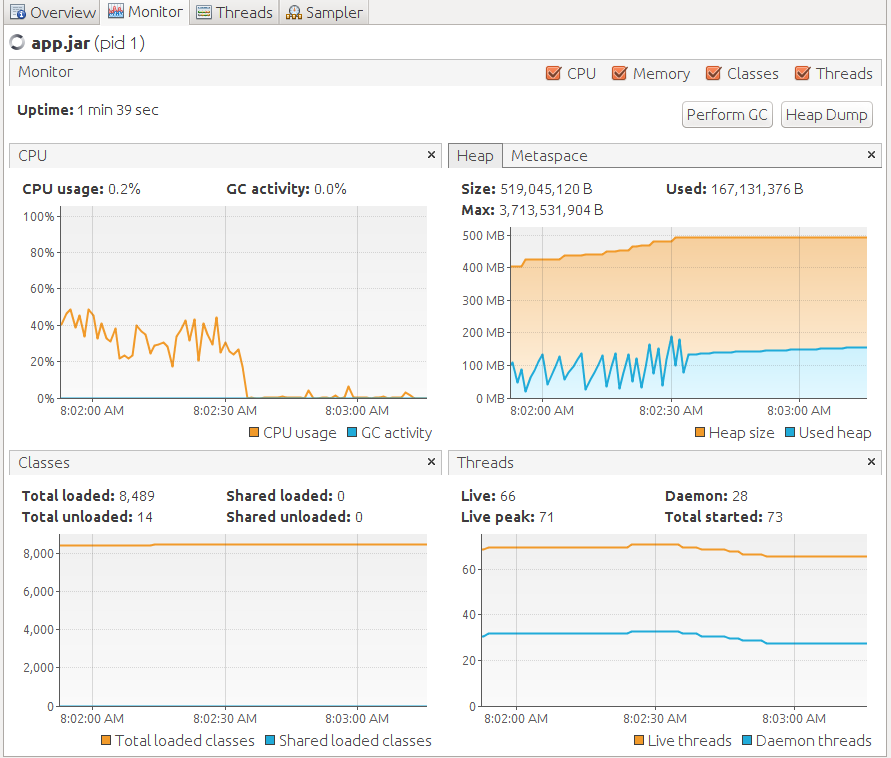
You should be able to monitor the app now.


