DRAFT
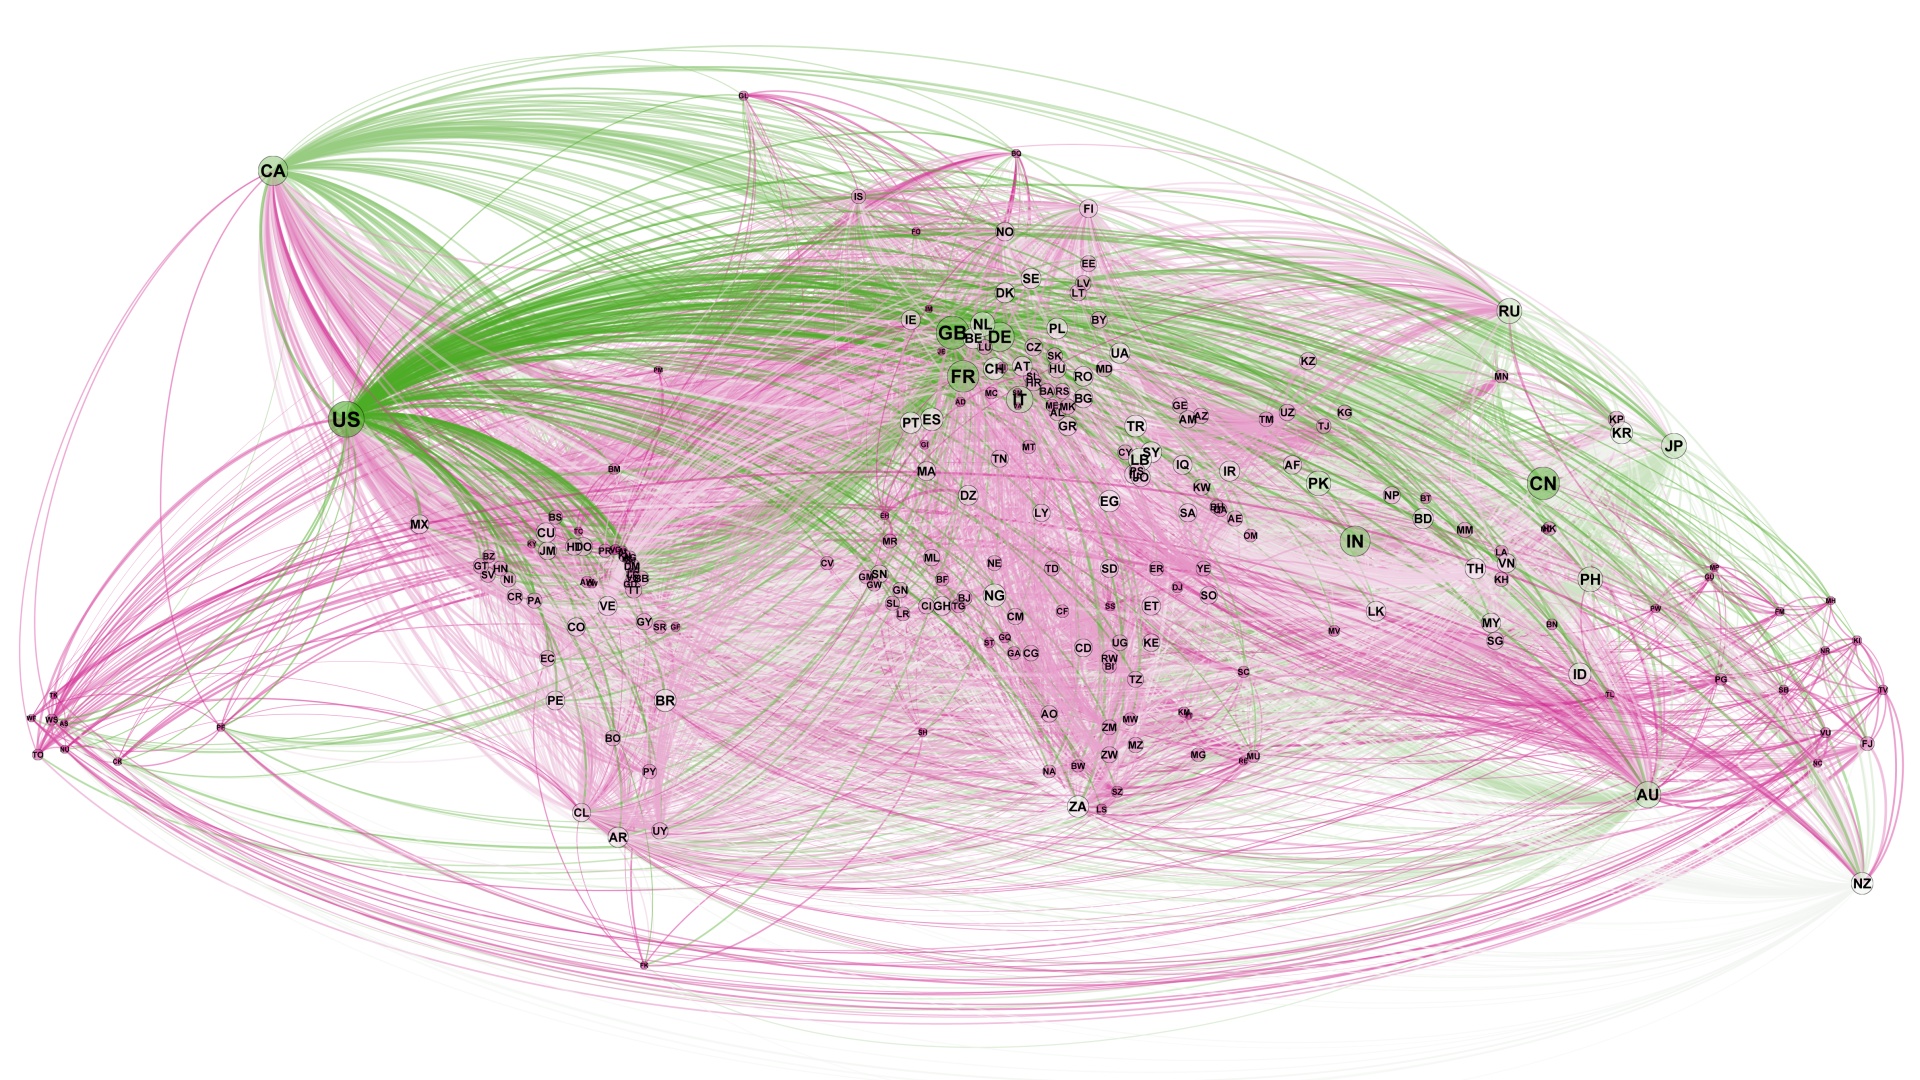
Inspired by "Global Cities: α, β and γ tiers" map (Carta* & González 2010), we set out to visualize global connectivity using open data.
For global migration network, we used UN migrant stock data from UN's "International migrant stock: The 2017 revision"[http://www.un.org/en/development/desa/population/migration/data/estimates2/data/UN_MigrantStockByOriginAndDestination_2017.xlsx] to map source and destination of migrants. The source-destination data was processed in R and exported as csv files for visualisation in Gephi.
For airlines data, we used openflights.org data to map airplane routes. ... coming soon ...
Full source code is available from the following GitHub repo: https://github.com/asheshwor/global
Migrant stock data: "International migrant stock: The 2017 revision" - Table 1 tab in the data "Origin and destination" excel file [http://www.un.org/en/development/desa/population/migration/data/estimates2/data/UN_MigrantStockByOriginAndDestination_2017.xlsx]
Airlines data: airlines route data and airports data from openflights.org https://openflights.org/data.html
World trade data: BACI 2016 data World trade database developed by the CEPII
Code distributed under the terms of the MIT license.
See individual licenses for external data/tools used if any.
-
Bastian M., Heymann S., Jacomy M. (2009). Gephi: an open source software for exploring and manipulating networks. International AAAI Conference on Weblogs and Social Media.
-
Carta, Silvio and González, Marta (2010), Mapping Connectedness of Global Cities: α, β and γ tiers [http://www.lboro.ac.uk/gawc/visual/globalcities2010.html] http://www.lboro.ac.uk/gawc/visual/globalcities2010.html
