- Introduction
- Reference Solution Architecture
- UA Cloud Twin
- A Cloud-based OPC UA Certificate Store and Persisted Storage
- UA Cloud Library
- Production Line Simulation
- Calculating the Product Carbon Footprint (PCF)
- Digital Feedback Loop with UA Cloud Commander and UA Cloud Action
- Installation of Production Line Simulation and Cloud Services
- Running the Production Line Simulation
- Viewing Digital Twins in Azure Digital Twins Explorer
- Generating a Digital Twins Graph with the ADT Generator Tool
- Condition Monitoring, Calculating OEE, Detecting Anomalies and Making Predictions in Azure Data Explorer
- Using Azure Managed Grafana Service
- Using 3D Scenes Studio
- Onboarding the Kubernetes Instance for Management via Azure Arc
- Enabling the Product Carbon Footprint Calculation (PCF) in the Asset Admin Shell (AAS) Repository
- Connecting the Reference Solution to Microsoft Power BI
- A turn-key alternative: Microsoft Fabric
- Connecting the Reference Solution to On-Premises SAP Systems
- Replacing the Production Line Simulation with a Real Production Line
- Enabling Automatic Asset Onboarding with Azure OpenAI Service
- License
An ontology defines the language used to describe a system. In the manufacturing domain, these systems can represent a factory or plant but also enterprise applications or supply chains. There are several established ontologies in the manufacturing domain. Most of them have long been standardized. In this repository, we have focused on two of these ontologies, namely ISA95 to describe a factory ontology and IEC 63278 Asset Administration Shell to describe a manufacturing supply chain. Furthermore, we have included a factory simulation and an end-to-end solution architecture for you to try out the ontologies, leveraging IEC 62541 OPC UA and the Microsoft Azure Cloud.
The ontologies defined in this repository are described by leveraging the Digital Twin Definition Language (DTDL), which is specified here.
ISA95 / IEC 62264 is one of the ontologies leveraged by this solution. It is a standard and described here and here.
The IEC 63278 Asset Administration Shell (AAS) enables vendor-neutral, platform-independent data exchange along a manufacturing supply chain and leveraged by this solution. The standard is described here. A script to convert from Asset Administration Shell models to DTDL to manually upload AAS models to Azure Digital Twins service is provided here. Furthermore, the reference solution provided in this repository also contains an AAS Repository service from the Digital Twin Consortium's reference implementation here. This service makes the Product Carbon Footprint (PCF) of the simulated products built by the simulated production lines available to customers. Please see below about how to enable this service.
This solution leverages IEC 62541 Open Platform Communications Unified Architecture (OPC UA) for all Operational Technology (OT) data. This standard is described here.
This repository contains a reference solution leveraging the ontologies described above with an implementation on Microsoft Azure. Other implementations can be easily added by implementing the open interface IDigitalTwin within the UA Cloud Twin application.

Here are the components involved in this solution:
| Component | Description |
|---|---|
| Industrial Assets | A set of simulated OPC-UA enabled production lines hosted in Docker containers |
| UA Cloud Publisher | This edge application converts OPC UA Client/Server requests into OPC UA PubSub cloud messages. It's hosted in a Docker container. |
| UA Cloud Commander | This edge application converts messages sent to an MQTT or Kafka broker (possibly in the cloud) into OPC UA Client/Server requests for a connected OPC UA server. It's hosted in a Docker container. |
| UA Edge Translator | This industrial connectivity edge application translates from proprietary asset interfaces to OPC UA leveraging W3C Web of Things (WoT) Thing Descriptions as the schema to describe the industrial asset interface. |
| Data Gateway | This gateway connects your on-premises data sources (like SAP) to Azure Logic Apps in the cloud. |
| AKS Edge Essentials | This Kubernetes implementation (both K3S and K8S are supported) runs at the Edge and provides single- and multi-node Kubernetes clusters for a fault-tolerant Edge configuration on embedded or PC-class hardware, like an industrial gateway. |
| Azure Event Hubs | The cloud message broker that receives OPC UA PubSub messages from edge gateways and stores them until they're retrieved by subscribers like the UA Cloud Twin. |
| UA Cloud Twin | This cloud application converts OPC UA PubSub cloud messages into digital twin updates. It also creates digital twins automatically by processing the cloud messages. Twins are instantiated from models in ISA95-compatible DTDL ontology. It's hosted in a Docker container. |
| Azure Digital Twins | The platform that enables the creation of a digital representation of real-world assets, places, business processes, and people. |
| Azure Data Explorer | The time series database and front-end dashboard service for advanced cloud analytics, including built-in anomaly detection and predictions. |
| Azure Logic Apps | Azure Logic Apps is a cloud platform you can use to create and run automated workflows with little to no code. |
| UA Cloud Action | This cloud application queries the Azure Data Explorer for a specific data value (the pressure in one of the simulated production line machines) and calls UA Cloud Commander via Azure Event Hubs when a certain threshold is reached (4000 mbar). UA Cloud Commander then calls the OpenPressureReliefValve method on the machine via OPC UA. |
| Azure Arc | This cloud service is used to manage the on-premises Kubernetes cluster at the edge. New workloads can be deployed via Flux. |
| Azure Storage | This cloud service is used to manage the OPC UA certificate store and settings of the Edge Kubernetes workloads. |
| Azure 3D Scenes Studio | This cloud app allows the creation of 3D immersive viewers for your manufacturing data. |
| Azure Digital Twins Explorer | This cloud app allows you to view your digital twins in an interactive UI. |
| Azure Data Explorer Dashboards | This cloud app allows the creation of 2D viewers for your manufacturing data. |
| Asset Admin Shell Repository | This REST web service and UI allows you to host Asset Administration Shells containing product information for your customers in a machine-readable format. |
| AASX Package Explorer | This app allows you to view and modify Asset Administration Shells on your PC. |
| UA Cloud Metaverse | This Industrial Metaverse app allows you to view digital twins of your manufacturing assets via Augmented Reality or Virtual Reality headsets. Work in progress! |
| Microsoft Sustainability Manager | Microsoft Sustainability Manager is an extensible solution that unifies data intelligence and provides comprehensive, integrated, and automated sustainability management for organizations at any stage of their sustainability journey. It automates manual processes, enabling organizations to more efficiently record, report, and reduce their emissions. |
| Azure Managed Grafana | Azure Managed Grafana is a data visualization platform built on top of the Grafana software by Grafana Labs. It's built as a fully managed Azure service operated and supported by Microsoft. |
| Azure OpenAI Service | Azure OpenAI Service provides REST API access to OpenAI's powerful language models including the GPT-4, GPT-35-Turbo, and Embeddings model series. |
| UA Cloud Library | The UA Cloud Library is an online store of OPC UA Information Models, hosted by the OPC Foundation here. |
| WattTime Service | The WattTime service can be used to get the carbon intensity for a unit of electrical energy consumed during a manufacturing process, specific to a particular geographic coordinate passed into the service. |
| Microsoft Power BI | Microsoft Power BI is a collection of software services, apps, and connectors that work together to turn your unrelated sources of data into coherent, visually immersive, and interactive insights. |
❗ In a real-world deployment, something as critical as opening a pressure relief valve would of course be done on-premises and this is just a simple example of how to achieve the digital feedback loop.
Here are the data flow steps:
- The UA Cloud Publisher reads OPC UA data from each simulated factory, and forwards it via OPC UA PubSub to Azure Event Hubs.
- The UA Cloud Twin reads and processes the OPC UA data from Azure Event Hubs, and forwards it to an Azure Digital Twins instance.
- The UA Cloud Twin automatically creates digital twins in Azure Digital Twins in response, mapping each OPC UA element (publishers, servers, namespaces) to a separate digital twin.
- Azure Data Explorer also reads and processes the OPC UA data from Azure Event Hubs and generates time series data, which can be used for analytics, such as OEE (Overall Equipment Effectiveness) calculation and predictive maintenance scenarios.
The simulation makes use of the UA Cloud Twin also available from the Digital Twin Consortium here. It automatically detects OPC UA assets from the OPC UA telemetry messages sent to the cloud and registers ISA95-compatible digital twins in Azure Digital Twins service for you.

UA Cloud Twin takes the combination of the OPC UA Application URI and the OPC UA Namespace URIs discovered in the OPC UA telemetry stream (specifically, in the OPC UA PubSub metadata messages) and creates OPC UA Nodeset digital twin instances (inherited from the ISA95 Work Center digital twin model) for each one. UA Cloud Publisher sends the OPC UA PubSub metadata messages to a separate broker topic to make sure all metadata can be read by UA Cloud Twin before the processing of the telemetry messages starts.
UA Cloud Twin takes the OPC UA Publisher ID and creates ISA95 Area digital twin instances (derived from the digital twin model of the same name) for each one.
When running OPC UA applications, their OPC UA configuration files, keys and certificates must be persisted. While Kubernetes has the ability to persist these files in volumes, a safer place for them is the cloud, especially on single-node clusters where the volume would be lost when the node fails. This is why the OPC UA applications used in this solution (i.e. the UA Cloud Publisher, the MES and the simulated machines/production line stations) store their configuration files, keys and certificates in the cloud. This also has the advantage of providing a single location for mutually trusted certificates for all OPC UA applications.
The Asset Admin Shell Repository used in this reference solution reads OPC UA Information Models referenced by products described within Asset Admin Shells from the UA Cloud Library automatically. You can also read OPC UA Information Models directly from Azure Data Explorer (also used in this reference solution) and import the OPC UA nodes defined in the OPC UA Information Model into a table for lookup of additional metadata within queries. Simply run the following Azure Data Explorer query:
    let uri='https://uacloudlibrary.opcfoundation.org/infomodel/download/<insert information model identifier from cloud library here>';
    let headers=dynamic({'accept':'text/plain'});
    let options=dynamic({'Authorization':'Basic <insert your cloud library credentials hash here>'});
    evaluate http_request(uri, headers, options)
    | project title = tostring(ResponseBody.['title']), contributor = tostring(ResponseBody.contributor.name), nodeset = parse_xml(tostring(ResponseBody.nodeset.nodesetXml))
    | mv-expand UAVariable=nodeset.UANodeSet.UAVariable
    | project-away nodeset
    | extend NodeId = UAVariable.['@NodeId'], DisplayName = tostring(UAVariable.DisplayName.['#text']), BrowseName = tostring(UAVariable.['@BrowseName']), DataType = tostring(UAVariable.['@DataType'])
    | project-away UAVariable
    | take 100
The solution leverages a production line simulation made up of several Stations, leveraging an OPC UA information model, as well as a simple Manufacturing Execution System (MES). Both the Stations and the MES are containerized for easy deployment.
The simulation is configured to include 2 production lines. The default configuration is depicted below:
| Production Line | Ideal Cycle Time (in seconds) |
|---|---|
| Munich | 6 |
| Seattle | 10 |
| Shift Name | Start | End |
|---|---|---|
| Morning | 07:00 | 14:00 |
| Afternoon | 15:00 | 22:00 |
| Night | 23:00 | 06:00 |
Note: Shift times are in local time, i.e. the time zone the VM hosting the production line simulation is set to!
The following OPC UA Node IDs are used in the Station OPC UA Server for telemetry to the cloud
- i=379 - manufactured product serial number
- i=385 - number of manufactured products
- i=391 - number of discarded products
- i=398 - running time
- i=399 - faulty time
- i=400 - status (0=station ready to do work, 1=work in progress, 2=work done and good part manufactured, 3=work done and scrap manufactured, 4=station in fault state)
- i=406 - energy consumption
- i=412 - ideal cycle time
- i=418 - actual cycle time
- i=434 - pressure
One of the most popular use cases for the Asset Administration Shell (AAS) is to make the Product Carbon Footprint (PCF) of manufactured products available to customers of those products. In fact, the AAS will most likely become the underlying technology in the upcoming Digital Product Passport (DPP) initiative from the European Union. To calculate the PCF, all three scopes (1, 2 & 3) of emissions need to be taken into account. See here about how to enable the AAS to calculate and provide the PCF to external consumers via a standardized REST interface and see here about how to enable the Microsoft Sustainability Manager (MSM) to calculate the PCF.
These emissions come from all sources the manufacturer uses to burn fossil fuels, either during production (for example when the manufacturer has a natural gas-powered production process) or before (for example picking up parts by truck) or afterwards (for example the cars of sales people or the delivery trucks with the produced products). They are relatively easy to calculate as the emissions from fossil fuel-powered engines are a well-understood quantity. This reference solution simply adds a fixed value for scope 1 emissions to the total product carbon footprint.
These emissions come from the electricity used during production. If the manufacturer uses a 100% renewable energy provider, the scope 2 emissions are zero. However, most manufacturers have long-term contracts with energy providers and need to ask their energy provider for the carbon intensity per KWh of energy delivered. If this data is not available, an average for the electricity grid region the manufacturing site is in should be used. This data is available through services like WattTime and this is what this reference solution uses via the built-in Asset Admin Shell Repository also available open-source from the Digital Twin Consortium. Please see below on how to configure this part of the reference solution after deployment. The PCF calculation first checks if a new product was successfully produced by the production line, retrieves the produced product's serial number, followed by the energy consumption of each machine of the production line while the new product was produced by the machine and then applies the carbon intensity to the sum of all machines' energy consumption.
These emissions come from the parts and raw materials used within the product being manufactured as well as from using the product by the end customer (and getting it into the customer's hands in the first place!) and are the hardest to calculate simply due to a lack of data from the worldwide suppliers manufacturer uses today. Unfortunately, scope 3 emissions make up almost 90% of the emissions in manufacturing. However, this is where the AAS can help create a standardized interface and data model to provide and retrieve scope 3 emissions. This reference solution does just that by making an AAS available for each manufactured product built by the simulated production line and also reads PCF data from another AAS simulating a manufacturing supply chain.
This reference implementation implements a "digital feedback loop", i.e. triggering a command on one of the OPC UA servers in the simulation from the cloud, based on a time-series reaching a certain threshold (the simulated pressure). You can see the pressure of the assembly machine in the Seattle production line being released on regular intervals in the Azure Data Explorer dashboard.
Clicking on the button below will deploy all required resources (on Microsoft Azure):
Note: During deployment, you must provide a password for a VM used to host the production line simulation and for UA Cloud Twin. The password must have 3 of the following: 1 lower case character, 1 upper case character, 1 number, and 1 special character. The password must be between 12 and 72 characters long.
You can also visualize the resources that will get deployed by clicking the button below:

Note: To save cost, the deployment deploys just a single Windows 11 Enterprise VM for both the production line simulation and the base OS for the Azure Kubernetes Services Edge Essentials instance. In production scenarios, the production line simulation is obviously not required and for the base OS for the Azure Kubernetes Services Edge Essentials instance, we recommend Windows IoT Enterprise Long Term Servicing Channel (LTSC).
Once the deployment completes, follow these steps to setup a single-node Edge Kubernetes cluster and finish configuring the simulation:
-
Connect to the deployed Windows VM with an RDP (remote desktop) connection. You can download the RDP file in the Azure portal page for the VM, under the Connect options. Sign in using the credentials you provided during deployment.
-
From the deployed VM, open a Windows command prompt, navigate to the
C:\ManufacturingOntologies-main\AKSEdgeToolsdirectory and runAksEdgePrompt. This will open a PowerShell window: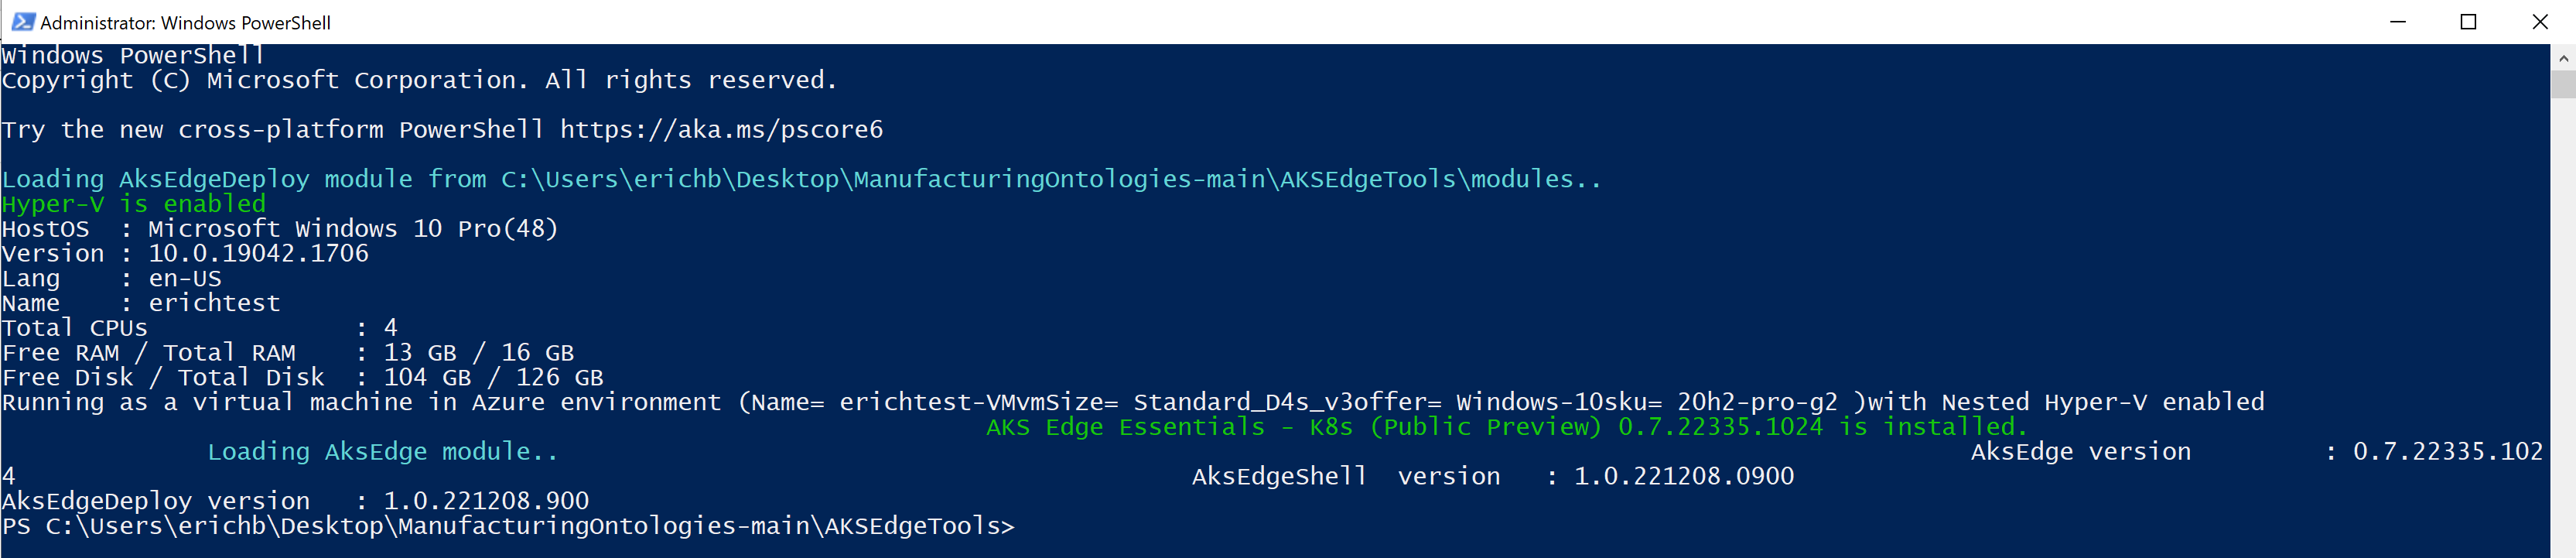
-
Run
New-AksEdgeDeployment -JsonConfigFilePath .\aksedge-config.jsonfrom the PowerShell window.

Once the script is finished, close all command prompt windows. Your Kubernetes installation is now complete and you can start deploying workloads.
Note: To get logs from all your Kubernetes workloads and services at any time, simply run Get-AksEdgeLogs from the Powershell window that can be opened via AksEdgePrompt.
From the deployed VM, open a Windows command prompt, navigate to the C:\ManufacturingOntologies-main\Tools\FactorySimulation directory and run the StartSimulation command by supplying the following parameters:
Syntax:
StartSimulation <EventHubsCS> <StorageAccountCS> <AzureSubscriptionID>
Parameters:
| Parameter | Description |
|---|---|
| EventHubCS | Copy the Event Hubs namespace connection string as described here. |
| StorageAccountCS | In the Azure Portal, navigate to the Storage Account created by this solution. Select "Access keys" from the left-hand navigation menu. Then, copy the connection string for key1. |
| AzureSubscriptionID | In Azure Portal, browse your Subscriptions and copy the ID of the subscription used in this solution. |
Example:
StartSimulation Endpoint=sb://ontologies.servicebus.windows.net/;SharedAccessKeyName=RootManageSharedAccessKey;SharedAccessKey=abcdefgh= DefaultEndpointsProtocol=https;AccountName=ontologiesstorage;AccountKey=abcdefgh==;EndpointSuffix=core.windows.net 9dd2eft0-3dad-4aeb-85d8-c3adssd8127a
Note: If you have access to several Azure subscriptions, it is worth first logging into the Azure Portal from the VM through the web browser. You can also switch Active Directory tenants through the Azure Portal UI (in the top-right-hand corner), to make sure you are logged in to the tenant used during deployment. Once logged in, simply leave the browser window open. This will ensure that the StartSimulation script can more easily connect to the right subscription.
Note: In this solution, the OPC UA application certificate store for UA Cloud Publisher, as well as the simulated production line's MES and individual machines' store, is located in the cloud in the deployed Azure Storage account.
You can use Azure Digital Twins Explorer to monitor twin property updates and add more relationships to the digital twins that are created. For example, you might want to add Next and Previous relationships between machines on each production line to add more context to your solution.
To access Azure Digital Twins Explorer, first make sure you have the Azure Digital Twins Data Owner role on your Azure Digital Twins instance. Then open the explorer.
You can use ADT Generator to simplify the creation of a digital twin graph, based on the ISA95 models provided in this repository.

To use the ADT Generator tool, first make sure you have Microsoft Excel installed, you have the production line simluation running and you have the Azure Digital Twins Data Owner role on your Azure Digital Twins instance.
Condition Monitoring, Calculating OEE, Detecting Anomalies and Making Predictions in Azure Data Explorer
You can also visit the Azure Data Explorer documentation to learn how to create no-code dashboards for condition monitoring, yield or maintenance predictions, or anomaly detection. We have provided a sample dashboard in the ./Tools/ADXQueries folder for you to deploy to the ADX Dashboard by following the steps outlined here. After import, you need to update the dashboard's data source by specifying the HTTPS endpoint of your ADX server cluster instance in the format https://ADXInstanceName.AzureRegion.kusto.windows.net/ in the top-right-hand corner of the dashboard.
Note: There is also an alternative calculation function for the OEE of the production line calculation provided in that folder. You should overwrite the default CalculateOEEForLine function with this one when the USE_ISA95_EQUIPMENT_MODELS environment variable is used in UA Cloud Twin.

Note: To calculate the OEE for the entire production lines, you need to set your ADT instance URL in the CalculateOEEForLine query. Also, you need to have the Azure Digital Twins Data Owner role on your Azure Digital Twins instance.
Note: If you want to display the OEE for a specific shift, select Custom Time Range in the Time Range drop down in the top-left hand corner of the ADX Dashboard and enter the date and time from start to end of the shift you are interested in.
You can also leverage Grafana to create a dashboard on Azure for this reference solution. Please see the documentation here.

If you want to add a 3D viewer to the simulation, you can follow the steps to configure the 3D Scenes Studio outlined here and map the 3D robot model from here to the digital twins automatically generated by the UA Cloud Twin:

-
On your virtual machine, From a Windows PowerShell window, navigate to the
AKSEdgeToolsdirectory. -
Run
notepad aide-userconfig.jsonand provide the following information:Attribute Description SubscriptionName The name of your Azure subscription. You can find this in the Azure portal under Subscriptions. SubscriptionId Your subscription ID. In the Azure portal, click on the subscription you're using and copy/paste the subscription ID. TenantId Your tenant ID. In the Azure portal, click on Azure Active Directory and copy/paste the tenant ID. ResourceGroupName The name of the Azure resource group which was deployed for this solution. ServicePrincipalName The name of the Azure Service Principal to use as credentials. AKS uses this service principal to connect your cluster to Arc. Set this to the same name as your ResourceGroupName for simplicity. -
Save the file, and run
SetupArcfrom the PowerShell window.
You can now manage your Kubernetes cluster from the cloud via the newly deployed Azure Arc instance. In the Azure Portal, browse to the Azure Arc instance and select Workloads. The required service token can be retrieved via Get-AideArcKubernetesServiceToken from the AksEdgePrompt on your virtual machine.

The Asset Admin Shell (AAS) Repository is automatically configured during deployment of the reference solution, but for the Product Carbon Footprint (PCF) calculation, a WattTime service account needs to be provided. Please refer to the WattTime API documentation on how to register for an account. Once your account has been activated, provide your username and password in the settings of the AAS Repo website from the Azure Portal via YourDeploymentName-AAS-Repo -> Configuration -> Application settings.

-
You need access to a Power BI subscription.
-
Install the Power BI Desktop app from here.
-
Login to Power BI Desktop app using the user with access to the Power BI subscription.
-
From the Azure Portal, navigate to your Azure Data Explorer database instance (
ontologies) and addDatabase Adminpermissions to an Azure Active Directory user with access to just a single Azure subscription, i.e. the subscription used for your deployed instance of this reference solution. Create a new user in Azure Active Directory if you have to. -
From Power BI, create a new report and select Azure Data Explorer time-series data as a data source via
Get data->Azure->Azure Data Explorer (Kusto). -
In the popup window, enter the Azure Data Explorer endpoint of your instance (e.g.
https://erichbtest3adx.eastus2.kusto.windows.net), the database name (ontologies) and the following query:let _startTime = ago(1h); let _endTime = now(); opcua_metadata_lkv | where Name contains "assembly" | where Name contains "munich" | join kind=inner (opcua_telemetry | where Name == "ActualCycleTime" | where Timestamp > _startTime and Timestamp < _endTime ) on DataSetWriterID | extend NodeValue = todouble(Value) | project Timestamp, NodeValue -
Click
Load. This will import the actual cycle time of the Assembly station of the Munich production line for the last hour. -
When prompted, log into Azure Data Explorer using the Azure Active Directory user you gave permission to access the Azure Data Explorer database earlier.
-
From the
Data view, select the NodeValue column and selectDon't summarizein theSummarizationmenu item. -
Switch to the
Report view. -
Under
Visualizations, select theLine Chartvisualization. -
Under
Visualizations, move theTimestampfrom theDatasource to theX-axis, click on it and selectTimestamp. -
Under
Visualizations, move theNodeValuefrom theDatasource to theY-axis, click on it and selectMedian. -
Save your new report.
Note: You can add other data from Azure Data Explorer to your report similarily.

Microsoft Fabric is an all-in-one analytics solution that covers everything from data movement to data science, analytics, and business intelligence. It offers a comprehensive suite of services, including data lake, data engineering, and data integration, all in one place. You don't even need an Azure subscription for it, let alone deploy or manage any apps or services. As a simpler alternative to the reference solution provided in this repository, you can get started with Microsoft Fabric here.

To configure Microsoft Fabric for production line data, you need at least 1 OPC UA server integrated into your produciton line that support OPC UA PubSub. Alternatively, you can use an OPC UA Client/Server to OPC UA PubSub adapter app like UA Cloud Publisher used in this reference solution. Then follow these steps:
-
Log into Microsoft Fabric here.
-
Create a
KQL Databaseby clickingCreate->See all->KQL Databaseand give it a name, e.g.kql_db_opcua. ClickCreate. -
Under
Database details, edit theOneLake foldersetting and set it toActive. This will enable sharing your OPC UA time-series data from your production line within your organization via OneLake in Parquet file format. ClickDone. -
Create the tables you need for ingesting the OPC UA PubSub production line data by clicking
Check your data, deleting the sample data in the text box and by entering the following Kusto command, one at a time and then clickingRunfor each line:.create table opcua_raw(payload: dynamic) .create table opcua_metadata_raw (payload: dynamic) .create table opcua_raw ingestion json mapping "opcua_mapping" @'[{"column":"payload","path":"$","datatype":"dynamic"}]' .create table opcua_metadata_raw ingestion json mapping "opcua_metadata_mapping" @'[{"column":"payload","path":"$","datatype":"dynamic"}]' .create table opcua_intermediate(DataSetWriterID: string, Timestamp: datetime, Payload: dynamic) .create table opcua_telemetry (DataSetWriterID: string, Timestamp: datetime, Name: string, Value: dynamic) .create table opcua_metadata (DataSetWriterID: string, Name: string) -
Create the OPC UA PubSub production line data parsing functions, by entering the following function definitions, one at a time, clicking
Runfor each line:.create-or-alter function OPCUARawExpand() { opcua_raw |mv-expand records = payload.Messages | where records != '' |project DataSetWriterID = tostring(records["DataSetWriterId"]), Timestamp = todatetime(records["Timestamp"]), Payload = todynamic(records["Payload"]) } .create-or-alter function OPCUADatasetExpand() { opcua_intermediate | mv-apply Payload on ( extend key = tostring(bag_keys(Payload)[0]) | extend p = Payload[key] | project Name = key, Value = todynamic(p.Value) ) } .create-or-alter function OPCUAMetaDataExpand() { opcua_metadata_raw | project DataSetWriterId = tostring(payload.DataSetWriterId), Name = tostring(payload.MetaData.Name) } -
Apply the OPC UA PubSub parsing functions to your tables, by entering the following policy updates, one at a time, clicking
Runfor each line:.alter table opcua_intermediate policy update @'[{"Source": "opcua_raw", "Query": "OPCUARawExpand()", "IsEnabled": "True"}]' .alter table opcua_telemetry policy update @'[{"Source": "opcua_intermediate", "Query": "OPCUADatasetExpand()", "IsEnabled": "True"}]' .alter table opcua_metadata policy update @'[{"Source": "opcua_metadata_raw", "Query": "OPCUAMetaDataExpand()", "IsEnabled": "True"}]' -
Create a "Last Known Value" OPC UA PubSub metadata table to make sure you always use the latest metadata available, by entering the following materialized view definition and clicking
Run:.create materialized-view opcua_metadata_lkv on table opcua_metadata { opcua_metadata | extend iTime = ingestion_time() | summarize arg_max(iTime, *) by Name, DataSetWriterID } -
Create an
Eventstreamby clickingCreate->See all->Eventstreamand give it a name (e.g.eventstream_opcua_telemetry). ClickCreate. This component will receive the OPC UA PubSub production line telemetry and send it to your KQL database. -
Click
New sourceand selectCustom Appand give it a name (e.g.opcua_telemetry). ClickAdd. In theInformationbox, click onConnection string-primary keyand copy it. You will need it soon when configuring UA Cloud Publisher. -
Create another
Eventstreamby clickingCreate->See all->Eventstreamand give it a name (e.g.eventstream_opcua_metadata). ClickCreate. This component will receive the OPC UA PubSub production line metadata and send it to your KQL database. -
Click
New sourceand selectCustom Appand give it a name (e.g.opcua_metadata). ClickAdd. In theInformationbox, click onConnection string-primary keyand copy it. You will need it soon when configuring UA Cloud Publisher. -
Now configure UA Cloud Publisher. You can either follow the steps for connecting your own production line described here or you can modify the configuration of the UA Cloud Publisher setup in the production line simulation provided in this repository, for example for the Munich production line. For the latter, follow these steps:
-
Log into the VM deployed with this reference solution, open a Powershell window and run
Get-AksEdgeNodeAddras well askubectl get services -n munich. -
Open a browser on the VM and enter the IP address and port retrieved for UA Cloud Publisher in the previous step in the address field (e.g.
http://192.168.0.2:30356) to access the UA Cloud Publisher UI. -
In the UA Cloud Publisher UI, click
Configurationand enter theConnection string-primary keyfrom theopcua_telemetrycustom app you copied earlier into theBroker Passwordfield, enter$ConnectionStringinto theBroker Usernamefield, enter theEntityPathinto theBroker Message Topic(the entity path is contained at the end of the connection string and starts with "es_") and the name of your custom app into theBroker URLfield (the custom app name is contained within the connection string and starts witheventstream-and ends with.servicebus.windows.net). -
Select the checkbox
Use Alternative Broker For OPC UA Metadata Messagesand enter theConnection string-primary keyfrom theopcua_metadatacustom app you copied earlier into theAlternative Broker Passwordfield, enter9093in theAlternative Broker Portfield, enter$ConnectionStringinto theAlternative Broker Usernamefield, enter theEntityPathinto theBroker Metadata Topic(the entity path is contained at the end of the connection string and starts with "es_") and the name of your custom app into theAlternative Broker URLfield (the custom app name is contained within the connection string and starts witheventstream-and ends with.servicebus.windows.net). -
Set the
Metadata Send Interval in Secondsto3000.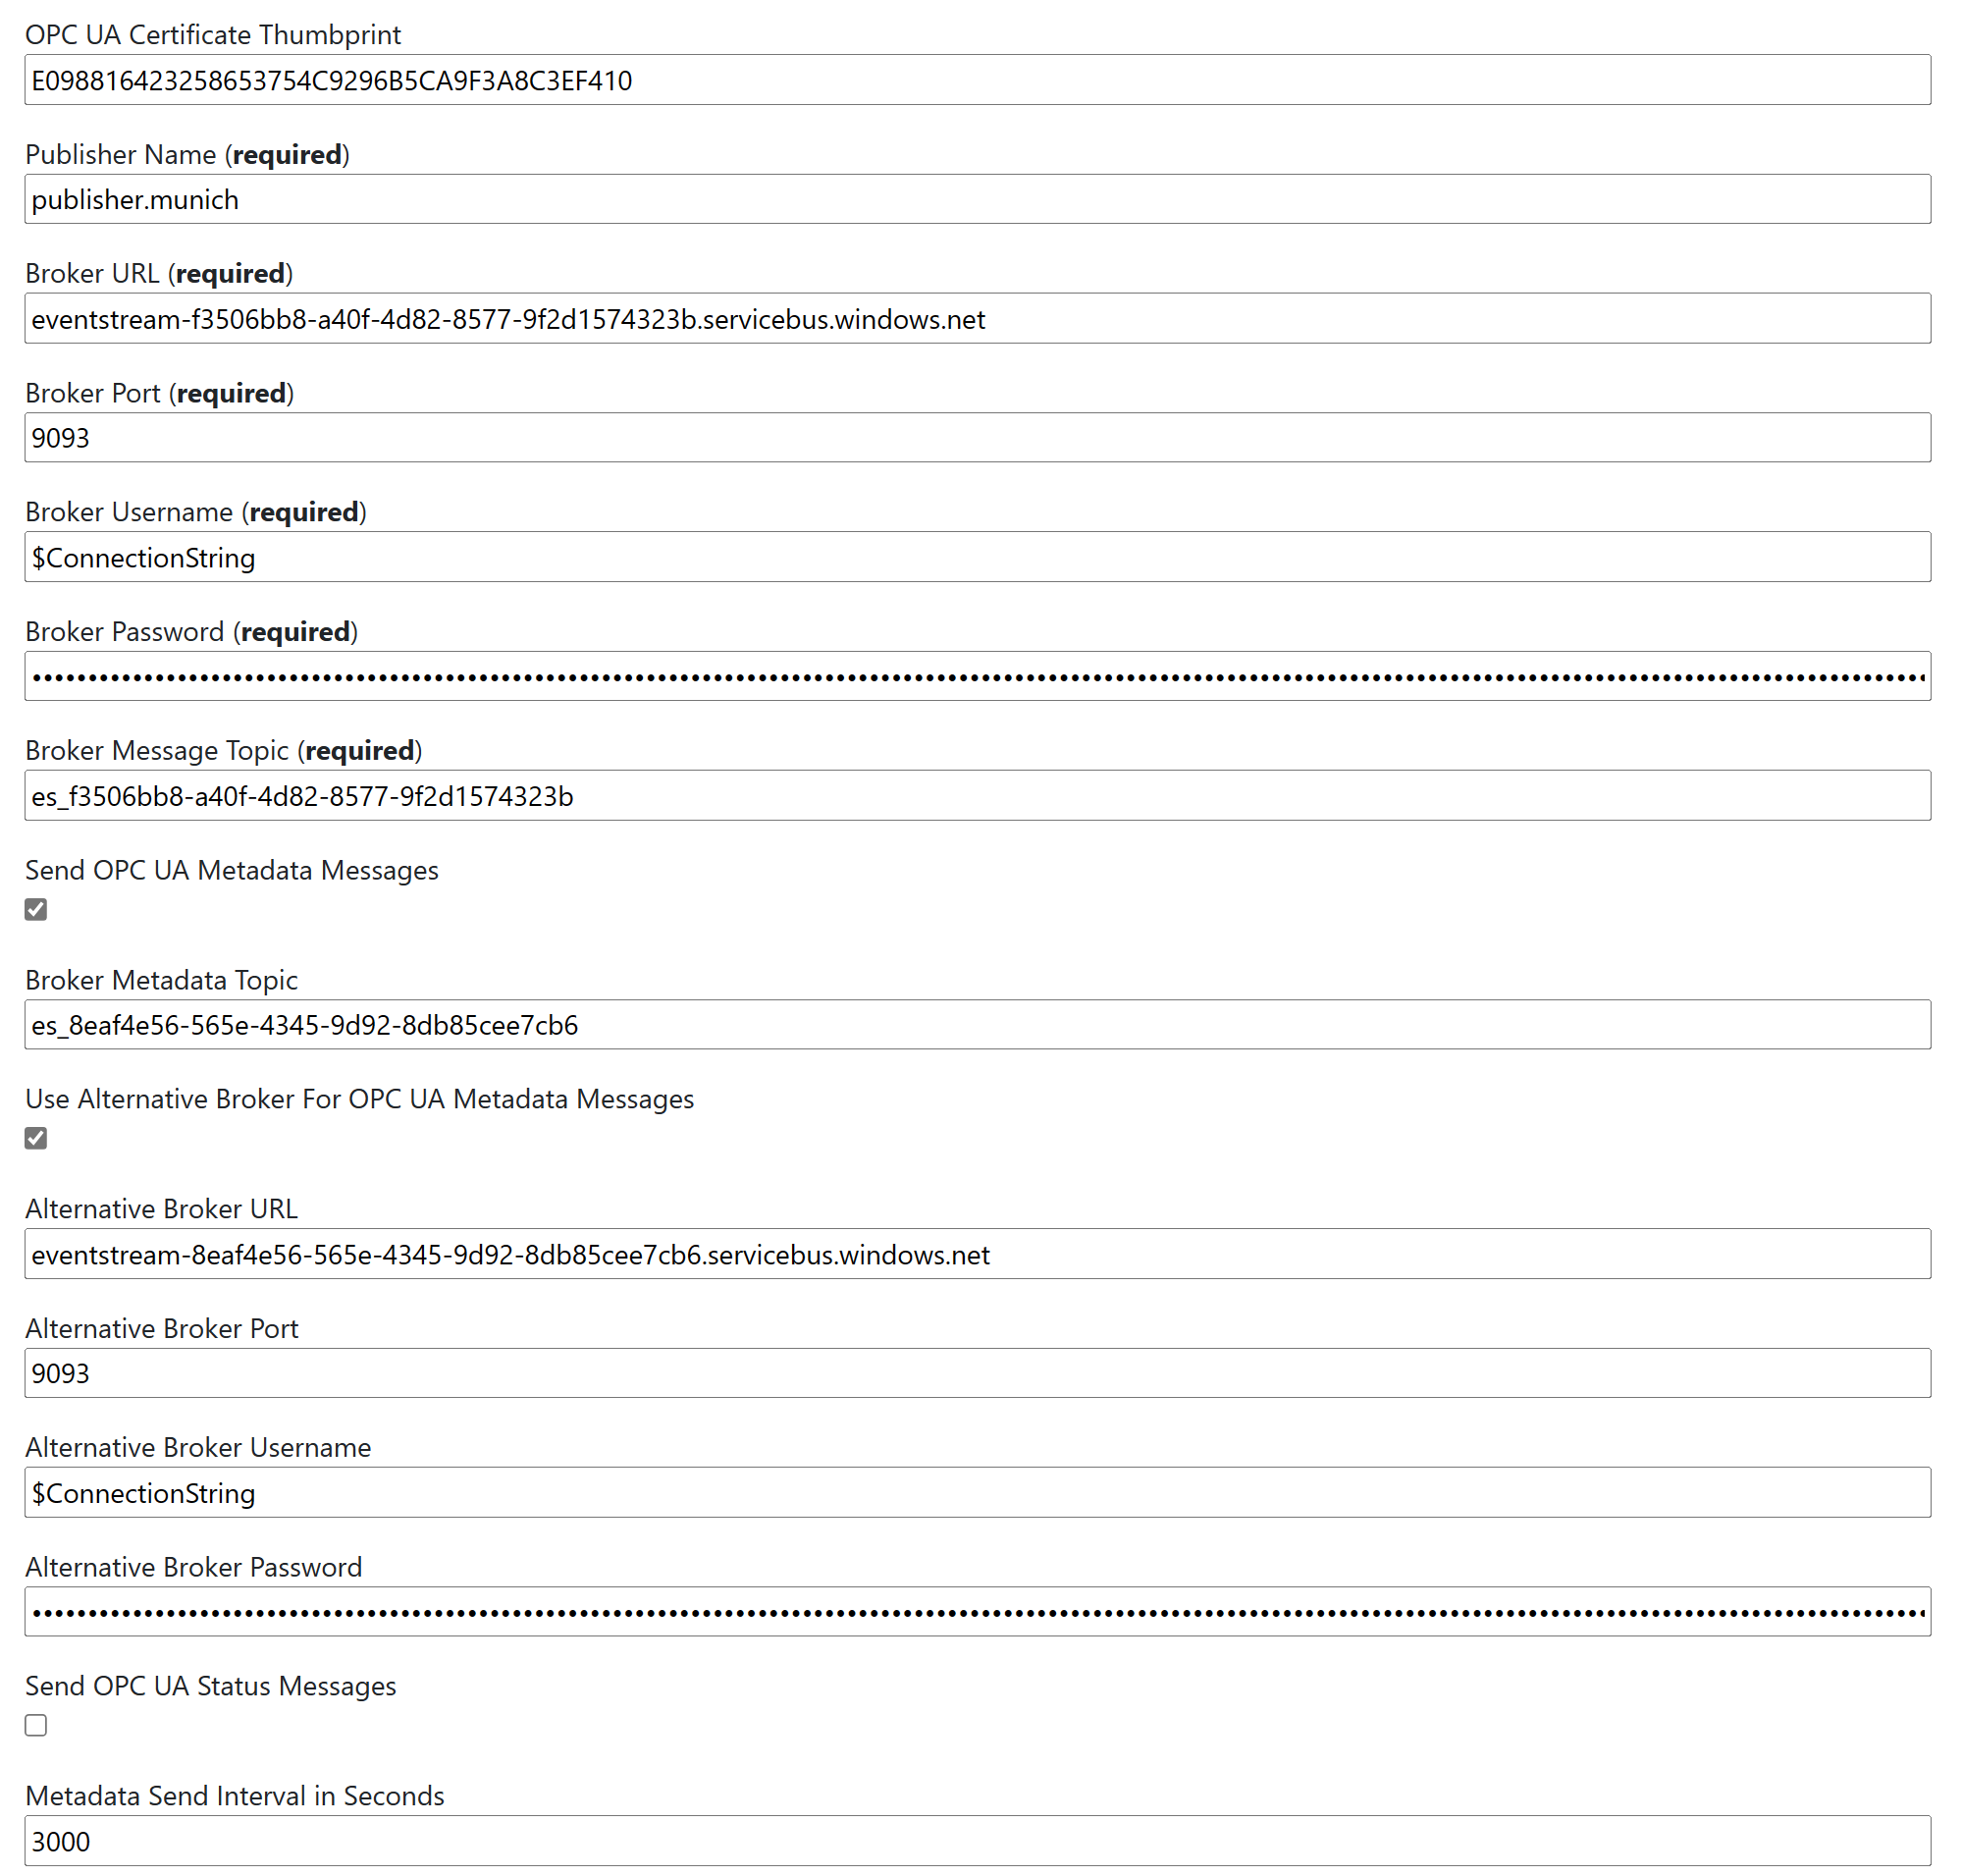
-
Click
Applyat the top of the configuration page. -
In the UA Cloud Publisher UI, click
Diagnosticsand verify that you have a connection to Microsoft Fabric (Connected to broker(s)is set toTrue).
-
-
Back in Microsoft Fabric, select your workspace, click on your
eventstream_opcua_telemetryevent stream and selectOpen Eventsteam. -
Click
New destinationand selectKQL Databaseand give it a name (e.g.kql_db_opcua_telemetry). UnderWorkspace, select you Fabric workspace (e.g.My workspace) and underKQL Database, select your KQL database you setup earlier. ClickAdd and configure. -
In the
Ingest datapopup window, underTable, selectExisting table, selectopcua_rawand clickNext: Source. Leave everything the way it is and clickNext: Schema. Wait a few seconds for the ingested data to be made available. UnderData format, selectJSON. UnderMapping name, selectUse existing mappingand selectopcua_mapping. ClickNext: Summary. ClickClose. -
Select your workspace, click on your
eventstream_opcua_metadataevent stream and selectOpen Eventsteam. -
Click
New destinationand selectKQL Databaseand give it a name (e.g.kql_db_opcua_metadata). UnderWorkspace, select you Fabric workspace (e.g.My workspace) and underKQL Database, select your KQL database you setup earlier. ClickAdd and configure. -
In the
Ingest datapopup window, underTable, selectExisting table, selectopcua_raw_metadataand clickNext: Source. Leave everything the way it is and clickNext: Schema. Wait a few seconds for the ingested data to be made available. UnderData format, selectJSON. UnderMapping name, selectUse existing mappingand selectopcua_metadata_mapping. ClickNext: Summary. ClickClose. -
To share your OPC UA data via OneLake, create a
Lakehouseby clickingCreate->See all->Lakehouseand give it a name, e.g.opcua_lake. ClickCreate. -
Click
New shortcut, selectMicrosoft OneLake, select your KQL database, expand theTablesand selectopcua_telemetry. -
Click
New shortcut, selectMicrosoft OneLake, select your KQL database, expand theTablesand selectopcua_metadata. -
Click on your workspace, select
Lineage viewto see the entire flow of OPC UA data you have just setup in Microsoft Fabric: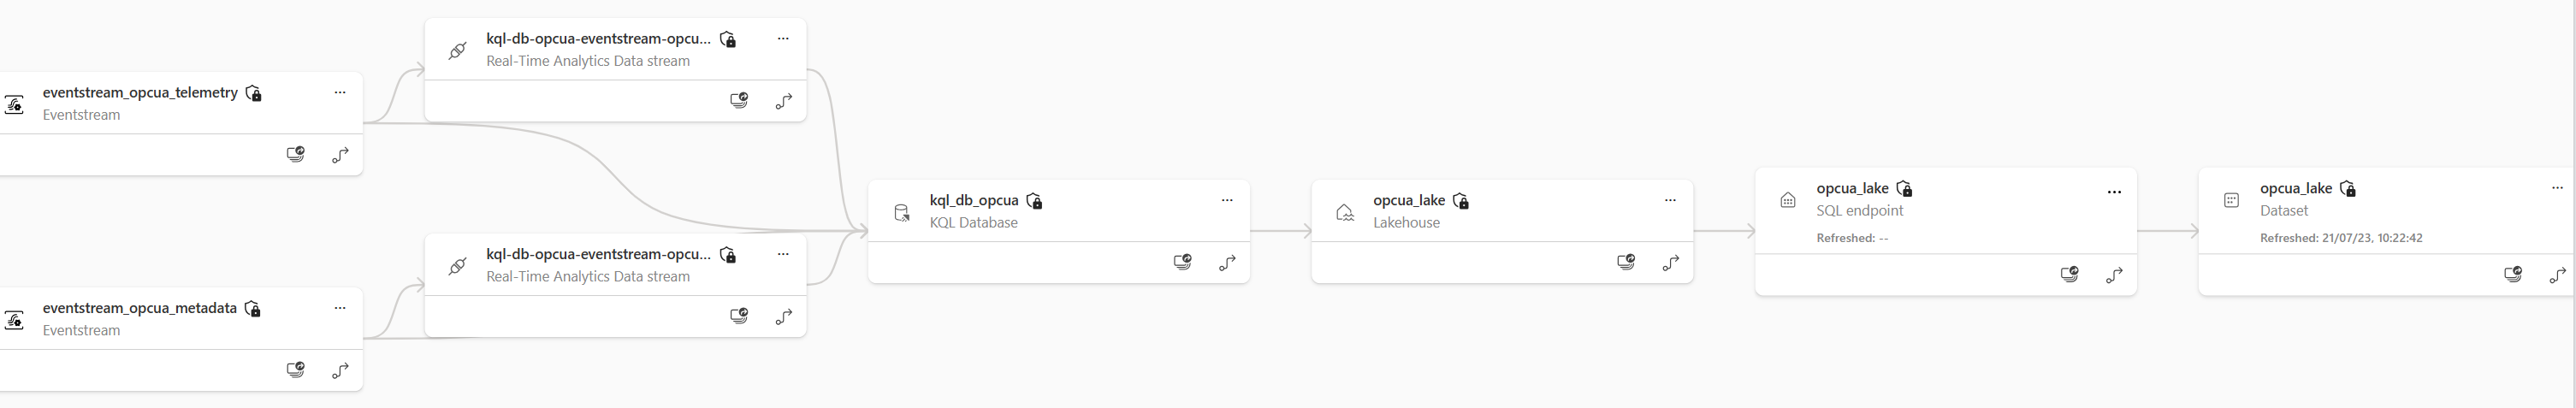
-
Click on our KQL Database and select
Open KQL Databasefollowed byCheck your data. Delete the sample queries and enter the following query in the text box:let _startTime = ago(1h); let _endTime = now(); opcua_metadata_lkv | where Name contains "assembly" | where Name contains "munich" | join kind=inner (opcua_telemetry | where Name == "ActualCycleTime" | where Timestamp > _startTime and Timestamp < _endTime ) on DataSetWriterID | extend NodeValue = todouble(Value) | project Timestamp, NodeValue | sort by Timestamp desc | render linechart


This will result in is a line graph rendered directly in Fabric:

Note: If you want to simply try out SAP connectivity before connecting your real SAP system, you can deploy an SAP S/4 HANA Fully-Activated Appliance to Azure from here and use that instead.
The Azure services handling connectivity to your on-premises SAP systems is called Azure Logic Apps. Azure Logic Apps is a no-code Azure service to orchestrate workflows that can trigger actions in e.g. Azure Digital Twins service.
To create a new Azure Logic Apps workflow from your on-premises SAP system to Azure Logic Apps and further on to your Azure Digital Twins service instance and also store the data sent from SAP in your Azure Storage Account deployed in this reference solution, follow these steps:
- Deploy an instance of Azure Logic Apps in the same region you picked during deployment of this reference solution via the Azure Portal. Select the consumption-based version.
- Once deployed, go to the resource, select
Identityand enableSystem assigned. Click onAzure Role Assignments->Add role assignment. SelectResource GroupforScope, your subscription name forSubscription, the resource group you have picked during the deployment of this reference solution forResource GroupandAzure Digital Twin Data OwnerforRole. ClickSave. - From the Azure Logic App Designer, select the trigger template
When a HTTP request is received. - Select
+ New step, selectAzure File Storageand selectCreate file. Give the connection a name and select the storage account name of the Azure Storage Account deployed for this reference solution. ForFolder path, entersap, forFile nameenterIDoc.xmland forFile contentselectBodyfrom the dynamic content. In the Azure Portal, navigate to your storage account deployed in this reference solution, selectStorage browser, selectFile sharesand selectAdd file share. Entersapfor the name and selectCreate. - Hover over the arrow between your trigger and your create file action, select the
+button and selectAdd a parallel branch. SelectAzure Digital Twinsand add the actionAdd Twinfrom the list of Azure Digital Twins actions available. Specify the ADT instance (host) name of your Azure Digital Twins service instance deployed in this reference solution. Click theConnect with managed identityfield, give it a name, specify the ADT instance (host) name of your Azure Digital Twins service instance deployed in this reference solution in theADT Instance Namefield and make sureSystem-assigned managed identityis selected forManaged identity. ClickCreate. Click on theDigital twin idfield and entersap. Then selectAdd new parameterand selectRequest. In the new Request field, enter{ "$metadata": { "$model": "dtmi:digitaltwins:isa95:JobOrder;1" }, "description": { "$metadata": {} }, "tags": { "$metadata": {} } }. - Save your workflow.
- Select
Run Triggerand wait for the run to complete. Verify that there are green check marks on all three components of your workflow. If you see any red exclamation marks, select the component for more info regardig the error.
Your completed Azure Logic Apps workflow should now look like this:

Copy the HTTP GET URL from your HTTP trigger in your workflow. You will need it when configuring SAP in the next step.
- Create a new HTTP connection for your Azure Logic App in your SAP system by entering
SM59from the SAP system's search box, which will bring up theConfiguration of RFC Connectionsscreen. SelectEdit->Create, enterLOGICAPPin theDestinationfield and selectHTTP Connection to external serverin theConnection Typedropdown. Click the green check button. EnterLOGICAPPunderDescription. UnderTechnical Settingsenter the hostname of your Logic AppHTTP GET URLcopied earlier (e.g.prod-51.northeurope.logic.azure.com), underPortenter443and underPath Prefixenter the rest of yourHTTP GET URLcopied earlier starting with/workflows/.... In theLogon & Securitytab, scroll down toSecurity Optionsand setSSLtoActive. Click theSavebutton. - Create a new port for your Azure Logic App in your SAP system by entering
WE21from the SAP system's search box, which will bring up thePorts in IDoc processingscreen. Select theXML HTTPfolder. Click on theCreatebutton. In thePortfield enterLOGICAPP. In theRFC destinationselectLOGICAPP. Click theSavebutton. - Create a partner profile for your Azure Logic App in your SAP system by entering
WE20from the SAP system's search box, which will bring up thePartner profilesscreen. Expand thePartner Profilesfolder and select thePartner Type LS(Logical System) folder. Click on theS4HCLNT100partner profile. Click on theCreate Outbound Parameterbutton below theOutboundtable. In thePartner Profiles: Outbound Parametersdialog, enterINTERNAL_ORDERforMessage Type. In theOutbound Optionstab, enterLOGICAPPforReceiver port. Select thePass IDoc Immediatelyradio button. ForBasic typeenterINTERNAL_ORDER01. Click theSavebutton.
To try out your SAP to Azure Logic App workflow, follow these steps:
Enter WE19 from the SAP system's search box, which will bring up the Test Tool for IDoc Processing screen. Select the Using message type radio button and enter INTERNAL_ORDER. Click on the Create button. Click on the EDICC field. In the Edit Control Record Fields dialog, enter LOGICAPP for Receiver Port, S4HCLNT100 for Receiver Partner No. and LS for Receiver Part. Type. Similarily, enter SAPS4H for Sender Port, S4HCLNT100 for Sender Partner No. and LS for Sender Part. Type. Click the green check button. Click on the Standard Outbound Processing button. In the Outbound Processing of IDoc dialog, click the green check button to start the IDoc message processing.
Open the Azure Digital Twins Explorer from the Azure Digital Twins service instance planel in the Azure Portal and check that a new job order digital twin called sap is created. Similarily, you can open the Storage browser of your Azure Storage Account, select Files shares and check that a new IDoc.xml file was created in the sap folder.
Note: To check for IDoc message processing errors, entering WE09 from the SAP system's search box, select a time range and click the execute button. This will bring up the IDoc Search for Business Content screen and you can select each IDoc for processing errors in the table displayed.
Microsoft provides an on-premises data gateway for sending data to on-premises SAP systems from Azure Logic Apps.
Note: To receive data from on-premises SAP systems to Azure Logic Apps in the cloud, the SAP connector and on-premises data gateway is not required.
To install the on-premises data gateway, follow these steps:
- Download and install the on-premises data gateway from here. Pay special attention to the prerequisits! For example, if your Azure account has access to more than one Azure subscription, you need to use a different Azure account to install the gateway and to create the accompanying on-premises data gateway Azure resource. Simply create a new user in your Azure Active Directory if this is the case.
- If not already installed, download and install the Visual Studio 2010 (VC++ 10.0) redistributables from here.
- Download and install the SAP Connector for Microsoft .NET 3.0 for Windows x64 from here. SAP download access for the SAP portal is required. Contact SAP support if you don't have this.
- Copy the 4 libraries libicudecnumber.dll, rscp4n.dll, sapnco.dll and sapnco_utils.dll from the SAP Connector's installation location (by default this is
C:\Program Files\SAP\SAP_DotNetConnector3_Net40_x64) to the installation location of the data gateway (by default this isC:\Program Files\On-premises data gateway). - Restart the data gateway through the
On-premises data gatewayconfiguration tool that came with the on-premsis data gateway installer package installed earlier. - Create the on-premises data gateway Azure resource in the same Azure region as selected during the data gateway installation in the previous step and select the name of your data gateway under
Installation Name.

Note: Further background info regarding the configuration steps can be accessed here.
Note: If you run into errors with the Data Gateway or the SAP Connector, you can enable debug tracing by following these steps.
Once you are ready to connect your own production line, simply delete the VM from the Azure Portal.
-
Edit the UA-CloudPublisher.yaml file provided in the
Deploymentfolder of this repository, replacing [yourstorageaccountname] with the name of your Azure Storage Account and [key] with the key of your Azure Storage Account. You can access this information from the Azure Portal on your deployed Azure Storage Account under Access keys. -
Run UA Cloud Publisher with the following command. The edge PC hosting UA Cloud Publisher needs Kubernetes support and Internet access (via port 9093) and needs to be able to connect to your OPC UA-enabled machines in your production line:
kubectl apply -f UA-CloudPublisher.yaml
Note: On Azure Kubernetes Services Edge Essentials, you can get the IP address of your Kubernetes cluster by running Get-AksEdgeNodeAddr from a Powershell window.
Note: You can query for the external Kubernetes port of your UA Cloud Publisher service by running kubectl get services -n <namespace> from a Powershell window.

-
Open a browser on the Edge PC and navigate to http://[IPAddressOfYourKubernetesCluster]:[KubernetesPortOfYourPublisherService]. You are now connected to the UA Cloud Publisher's interactive UI. Select the Configuration menu item and enter the following information, replacing [myeventhubsnamespace] with the name of your Event Hubs namespace and replacing [myeventhubsnamespaceprimarykeyconnectionstring] with the primary key connection string of your Event Hubs namespace. The primary key connection string can be read in the Azure Portal under your Event Hubs' "share access policy" -> "RootManagedSharedAccessKey". Then click
Apply:PublisherName: "UACloudPublisher", BrokerUrl: "[myeventhubsnamespace].servicebus.windows.net", BrokerPort: 9093, BrokerUsername: "$ConnectionString", BrokerPassword: "[myeventhubsnamespaceprimarykeyconnectionstring]", BrokerMessageTopic: "data", BrokerMetadataTopic: "metadata", SendUAMetadata: true, MetadataSendInterval: 43200, BrokerCommandTopic: "", BrokerResponseTopic: "", BrokerMessageSize: 262144, CreateBrokerSASToken: false, UseTLS: false, InternalQueueCapacity: 1000, DefaultSendIntervalSeconds: 1, DiagnosticsLoggingInterval: 30, DefaultOpcSamplingInterval: 500, DefaultOpcPublishingInterval: 1000, UAStackTraceMask: 645, ReversiblePubSubEncoding: false, AutoLoadPersistedNodes: true -
Configure the OPC UA data nodes from your machines (or connectivity adapter software). To do so, select the OPC UA Server Connect menu item, enter the OPC UA server IP address and port and click Connect. You can now browse the OPC UA Server you want to send telemetry data from. If you have found the OPC UA node you want, right click it and select publish.
Note: UA Cloud Publisher stores its configuration and persistency files in the cloud within the Azure Storage Account deployed in this solution.
Note: You can check what is currently being published by selecting the Publishes Nodes tab.
Note: You can see diagnostics information from UA Cloud Publisher on the Diagnostics tab.
For your real production line, you can enable automatic asset onboarding for your industrial assets with a fixed data model (e.g. energy meters, valves, pumps etc.) via Azure OpenAI Service, UA Edge Translator and UA Cloud Publisher, by following these steps:
- Deploy an instance of Azure OpenAI Service in the Azure Portal.
- Deploy a Large Language Model to your Azure Open AI Service instance, GPT-4 is recommended for best results.
- Configure UA Cloud Publisher deployed for your own production line to use your Azure OpenAI instance via its built-in user interface.
- Deploy UA Edge Translator on a PC with Kubernetes support located in the same network as your industrial asset and UA Cloud Publisher. You can use the UA-EdgeTranslator.yaml file from the
Deploymentfolder of this repository by callingkubectl apply -f UA-EdgeTranslator.yaml. - Create a Web of Things (WoT) Thing Description using the Azure OpenAI Service via the UA Cloud Publisher's user interface and send it to UA Edge Translator.


This work is licensed under a Creative Commons Attribution 4.0 International License.