This repository serves as an R tutorial for how to take survey data (from Qualtrics, for example) and reshape it to be compatible with cjoint. This tutorial uses simulated data taken from an experiment by S.R. Gubitz.
The data are from a study on incivility by S.R. Gubitz. The simulated data are available for practice in this repository. I will keep this repository updated with the status of this paper as it progresses through the publication pipeline.
This conjoint was programmed by Gubitz in Qualtrics, using survey flow and pipe-text in order to create a conjoint design. This is not a force-choice conjoint design, but the reshaping process is similar.
```{r}
## Load packages
library(tidyverse)
library(cjoint)
I have also included the data for those who wish to follow along on their computer.
srg_dat <- read_csv("Gubitz simulated data.csv")
NOTE: In this case, the variables in this dataset are already recoded according to the abovementioned coding scheme.
To aid the reshaping process, it helps to recode the data columns using a systematic naming convention. I have found that the best convention is as follows: variablename_taskiteration_index. Take, for example, the variable education-level of a candidate in a conjoint. For each task iteration, we would code the education variables as: education_1, education_2, education_3, until the last task.
This coding scheme should also be used for respondent answers in each task iteration, including force-choice questions. For instance, if the respondent is asked to pick between two candidates, this variable should be coded: choice_1, choice_2, choice_3, until the last task.
If the respondent is answering a battery of questions--related to the candidate, for example--this variable can be captured in the index portion of the variablename_taskiteration_index scheme. For instance, if the respondent is asked in each iteration three questions on the leadership qualities of a candidate, this should be coded: leadership_1_1, leadership_1_2, leadership_1_3, for the first iteration. In the second iteration, it would be, leadership_2_1, leadership_2_2, and leadership_2_3. This pattern continues until the last iteration.
It does not matter if one decides to recode the variables using this scheme on the actual survey (i.e. in Qualtrics) or in R (the rename function works well). However, renaming variables in the following format is essential for the following reshaping process.
The logic of reshaping is as follows:
-
First, we take the data, which is in wide format, and
gatherbased on the conjoint task-specific variables into long format. Because of our coding scheme, we have indicated each task using an underscore and then numbering the task. This conjoint experiment has six iterative task; thus, we are aiming for 6 rows per respondent (that is, one row per task). a) Code:gather(key = task, value = score, contains("_1"), contains("_2"), contains("_3"), contains("_4"), contains("_5"), contains("_6")) -
Next, we separate each variable into three variables: the variable name, the iteration, and the index. Even if most variables do not have an index, we still need to do this to capture variables which have an index (see "Renaming Variables" for more details on this). b) Code:
separate(task, c("variable", "iteration", "index")) -
Once we separate, we can create a variable for when there is an index present or not. c) Code:
mutate(index = ifelse(is.na(index), "", index)) -
Then we can
unitethevariableandindexcolumns to make a new variable, which is named as the variable and the index number. This way, we can later easily access the battery. d) Code:unite("variable_index", c("variable", "index"), sep = "") -
Finally, we wish to spread the variable name is its own column, and each row for those columns contains the values of that variable. e) Code:
spread(key = variable_index, value = score)
srg_reshape <- srg_dat %>%
  #first step is gathering all the variables that we want to use as our attributes;
  #because we have named each task iteration in this format, using contains will get each conjoint-related variable
  gather(key = task, value = score, contains("_1"), contains("_2"), contains("_3"), contains("_4"), contains("_5"), contains("_6")) %>%
  #we need to separate these variables out by characteristics; this can be done using `separate`, because variable were meaningfully named using underscores
  separate(task, c("variable", "iteration", "index")) %>%
  #creating an indicator of variables that were a part of an index
  mutate(index = ifelse(is.na(index), "", index))  %>%
  #create a variable specific column
  unite("variable_index", c("variable", "index"), sep = "") %>%
  #spreading out the variables so that each meaningful variable (or attribute) is a column
  spread(key = variable_index, value = score) %>%
  #lastly, because the data are a mix of upper and lower case, I use clean_names to make the variables names follow a uniform convention (this is optional, but recommended)
  janitor::clean_names()
As mentioned, there were six tasks in the Gubitz experiment. This means that for each respondent, we should now have six rows.
srg_reshape %>% filter(response_id == "R_1Ibe8eFUzu8FGJf") %>% select(1:3)
We can now use our reshaped data for our AMCEs
In order to calculate AMCEs, we must make sure our data are properly cleaned. We must make sure that our outcome of interest--here it is news--is an integer and does not have any missing values. We also much make sure our predictors of interest, are factor variables.
srg_clean <- srg_reshape %>%
  #first, we want to make sure our outcome of interest is a numeric variable
  mutate(news = as.numeric(news)) %>%
  #next, we want to make sure our predictors of interest are factors
  mutate_if(is.character, as.factor) %>%
  #lastly, we want to make sure our outcome of interest has no missing values (either by filtering them out, or through MI, etc...)
  filter(!is.na(news))
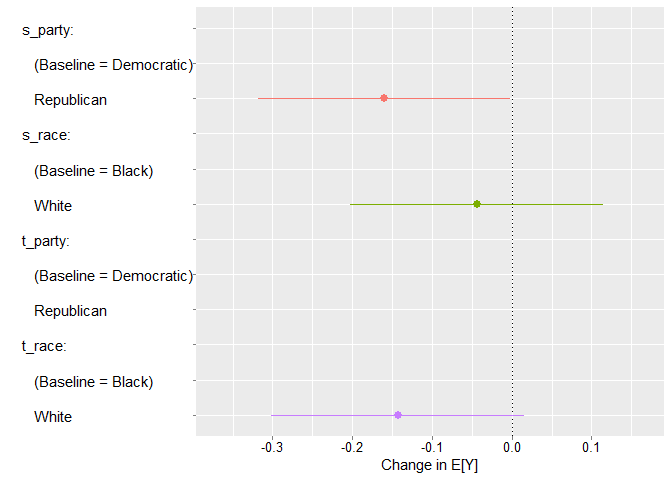
Now we can plot our AMCEs. Remember that these results are meaningless, because this is simulated data.
srg_clean %>%
  amce(formula = news ~ s_party + t_party + s_race + t_race) %>%
  plot()
